- Swingly
- Posts
- The Gap-Down Playbook: Yield Shock, Tech Weakness, Seasonality
The Gap-Down Playbook: Yield Shock, Tech Weakness, Seasonality
In partnership with

OVERVIEW
🟥 Risk-Off
Nasdaq (QQQ): Wedge + H&S breakdown. Failed $574 demand zone, gapping to 50D EMA/POC. Structure remains bearish; avoid intraday chop.
Midcaps (MDY): Gapping into 20D EMA; prior setups already rolled. Breadth misleading — full avoid.
Small Caps (IWM): Relative strength leader. Gap only to 10D EMA. Tactical long-on-weakness possible at $231 (10D EMA) or $228 (20D EMA).
Focused Stock (ORLA): Multi-touch base since April; breakout retest at $11.25 POC. Miners ripping, equities rolling — strong long setup.
Focused Group (XLE): Weekly breakout confirmed. RS vs SPX spiking, USO breaking higher. Commodity leadership (energy + metals) taking over.

MARKET ANALYSIS
Protect Your Profits: Defense Is King

Equities are starting September on the back foot, with futures pointing sharply lower (S&P –1.2%, Nasdaq –1.5%). Seasonality is a headwind here: September has historically been the weakest month for stocks, with the S&P 500 averaging –4.2% over the last five years.
The immediate catalysts are twofold:
Tariffs & Fiscal Risk → A federal appeals court ruled that Trump-era global tariffs were illegal, raising the prospect of billions in refunds. Bond markets are already pricing in added fiscal stress, driving yields higher (10Y at 4.29%, 30Y near 5%).
Rates & Jobs Data → With the Fed decision looming mid-month, all eyes are on Friday’s August jobs report. Strong prints would reinforce “higher-for-longer” rate pressure, while any softening could provide temporary relief.
Context matters: August delivered another month of index gains (SPX +2%, Nasdaq +1.6%), including five new all-time highs for the S&P. Historically, when the S&P notches 20+ new highs by August, September has often seen a pullback as markets digest gains.
Nasdaq

QQQ VRVP Daily Chart
% over 20 EMA: 53.46% | % over 50 EMA: 48.51% | % over 200 EMA: 61.38%
For our regular readers, you’ll know of our short bias on QQQ that has been clear for weeks — dating back to early August when we flagged the low-volume rally inside an ascending broadening wedge.
That wedge remains the dominant structure, and the latest tape only reinforces the short side of the argument.
Friday’s session was decisive: price failed to hold the highlighted $574 demand box, broke the 10-day EMA on elevated volume, and unwound Thursday’s bounce.
Pre-market action shows QQQ gapping directly into the 50-day EMA and VRVP Point of Control (POC) around $561.
Technically, this is where a reflex bounce could emerge which is why chasing fresh shorts into the gap is unattractive. But the broader structure remains negative.
Not only is the wedge setup maturing, but a head-and-shoulders top is also forming, layering bearish conviction.
Pattern Stats (Thomas Bulkowski)
Ascending Broadening Wedge (bull market): Downside breakouts rank 33/36 in performance, with average declines of –12% and 71% meeting their target.
Head-and-Shoulders Top (bull market): Ranks 9/36, with average declines of –16% and 51% meeting their target.
This isn’t a segment we’d be looking to trade long or short intraday — too choppy, too nonlinear.
From a swing lens, however, QQQ remains structurally vulnerable. Unless buyers reclaim $574 quickly, the path of least resistance stays lower toward the 50-day and possibly deeper (which would be an attractive short play).
S&P 400 Midcap

MDY VRVP Daily Chart
% over 20 EMA: 76.25% | % over 50 EMA: 68.50% | % over 200 EMA: 63.25%
On paper, midcap breadth still looks solid but the index tape tells a different story. MDY is gapping sharply lower this morning, right into its 20-day EMA, erasing last week’s breakout momentum.
This underscores why relying on breadth or indices alone is misleading as the tape is far too choppy to anchor exposure decisions.
The reality is that many midcap setups which looked promising during the August short squeeze have already rolled over. By late last week, our scans were producing fewer valid setups, a sign that the underlying thrust was losing quality even as breadth metrics stayed elevated.
Yes, a reflex bounce off the 20-day EMA is likely, but structurally, this is not a segment we want to engage.
For us, it’s a full avoid: too much chop, too little asymmetry, and far better opportunities elsewhere (hint, hint…precious metals).
Russell 2000
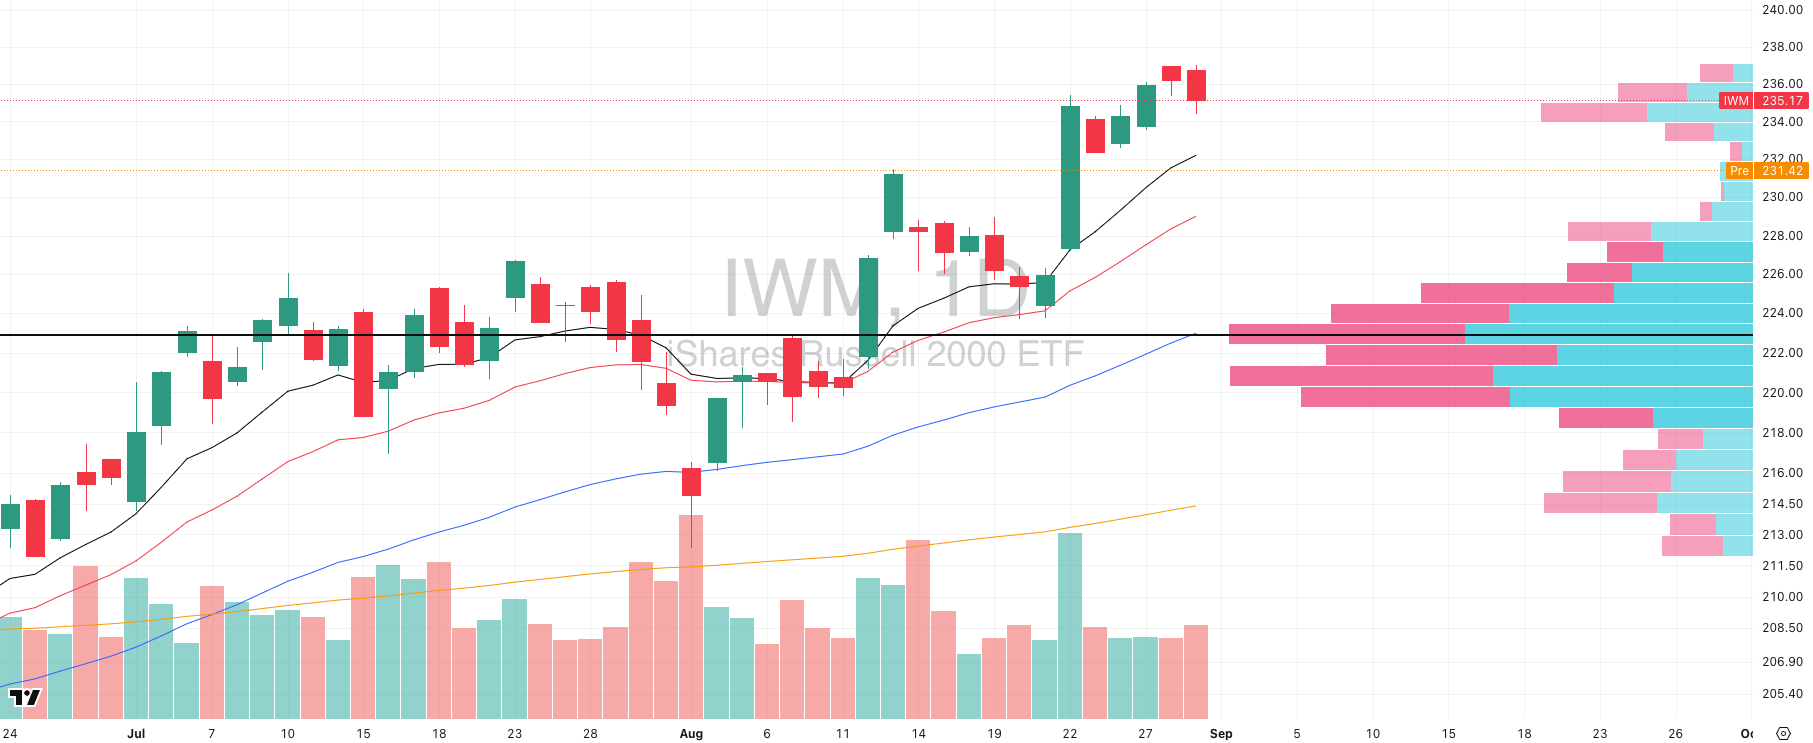
IWM VRVP Daily Chart
% over 20 EMA: 78.48% | % over 50 EMA: 71.18% | % over 200 EMA: 60.78%
Unlike QQQ and MDY, where the breakdowns look disorderly, small caps are showing a different character. The gap down this morning is modest in relative terms, pulling only into the 10-day EMA, while the others are testing deeper levels.
Structurally, IWM has been the relative strength leader for weeks, aided by elevated short interest that continues to provide fuel.
This makes IWM the one index where a tactical long-on-weakness setup actually makes sense. Two key levels matter:
10-day EMA (~$231) → If buyers defend here, a bullish engulfing pattern on the 15-min or lower intraday chart could be the trigger.
20-day EMA (~$228) → A deeper flush into this level would align with both a logical support test and an attractive reward/risk entry.
The logic is simple: small caps remain the highest short interest segment, and their outperformance relative to large caps suggests continued squeeze potential. If there’s an intraday reversal worth taking, it’s here.
🧠 Mindset Check: The Edge of Sitting Out
One of the hardest lessons for active traders is realizing that not trading can be the highest-ROI move in the playbook.
Most of us feel the pull of action bias and the belief that you have to be constantly pressing buttons to make progress. But markets don’t pay you for effort, they pay you for discipline.
Why Flat ≠ Passive
1. Preserving Open Equity
If you’ve built a strong run of gains in recent months, the real alpha now might be locking them in by avoiding chop. Protecting +50% in realized gains through a period of noise and failed moves due to lack of direction is just as powerful as finding the next winner as it compounds the same way, but without any drawdown risk.
2. Carry Works in Your Favor
In 2025, cash isn’t dead money. At ~4% yields, a flat portfolio still generates income while keeping you 100% liquid. That means even in waiting mode, capital is compounding.
3. Flexibility Is Alpha
Drawdowns restrict choice whilst cash unlocks it. The trader with fresh capital is the one who can size up instantly when the tape flips back in their favor. You don’t waste time digging out of a hole; you’re ready to strike when the high-conviction setup appears.
After aggressive 3–4 month market surges (think Aug–Nov 2020 or Mar–Jun 2023), win rates in breakout systems historically dropped 25–40% in the next 1–2 months. Our own data confirms this: when our baseline breakout win rate of ~42% slips under 30%, that’s the signal to step back and play defense.
Cash as a Tactical Position
Ask yourself:
Is breadth thinning out?
Has your system win rate dropped below 30%?
Do you have recent gains worth defending?
If two or more are true, cash is a deliberate position with positive expectancy.
Stop Drowning in Market News. Focus On Making Money.

Every day: 847 financial headlines, 2,300 Reddit stock mentions, 156 Twitter trading threads, 12 IPO updates, 94 crypto developments.
Your problem isn't lack of information; you have too much.
While you're scanning headlines wondering what matters, profitable trades slip by. The signal gets buried in noise.
What if someone did the heavy lifting for you?
Stocks & Income reads everything:
Twitter traders
Reddit buzz
IPO announcements
Crypto insider takes
Crowdfunding opportunities
Market news
Then we send you only what can actually move your portfolio.
No fluff. No useless news. Just actionable stock insights in 5 minutes.
We track every source so you don't have to. You get the 3-5 opportunities worth your time, delivered daily.
Stop wasting time on useless “investing news” and start thinking critically about real opportunities in the stock market.
Stocks & Income is for informational purposes only and is not intended to be used as investment advice. Do your own research.
FOCUSED STOCK
ORLA: A Tight Base = Big Potential
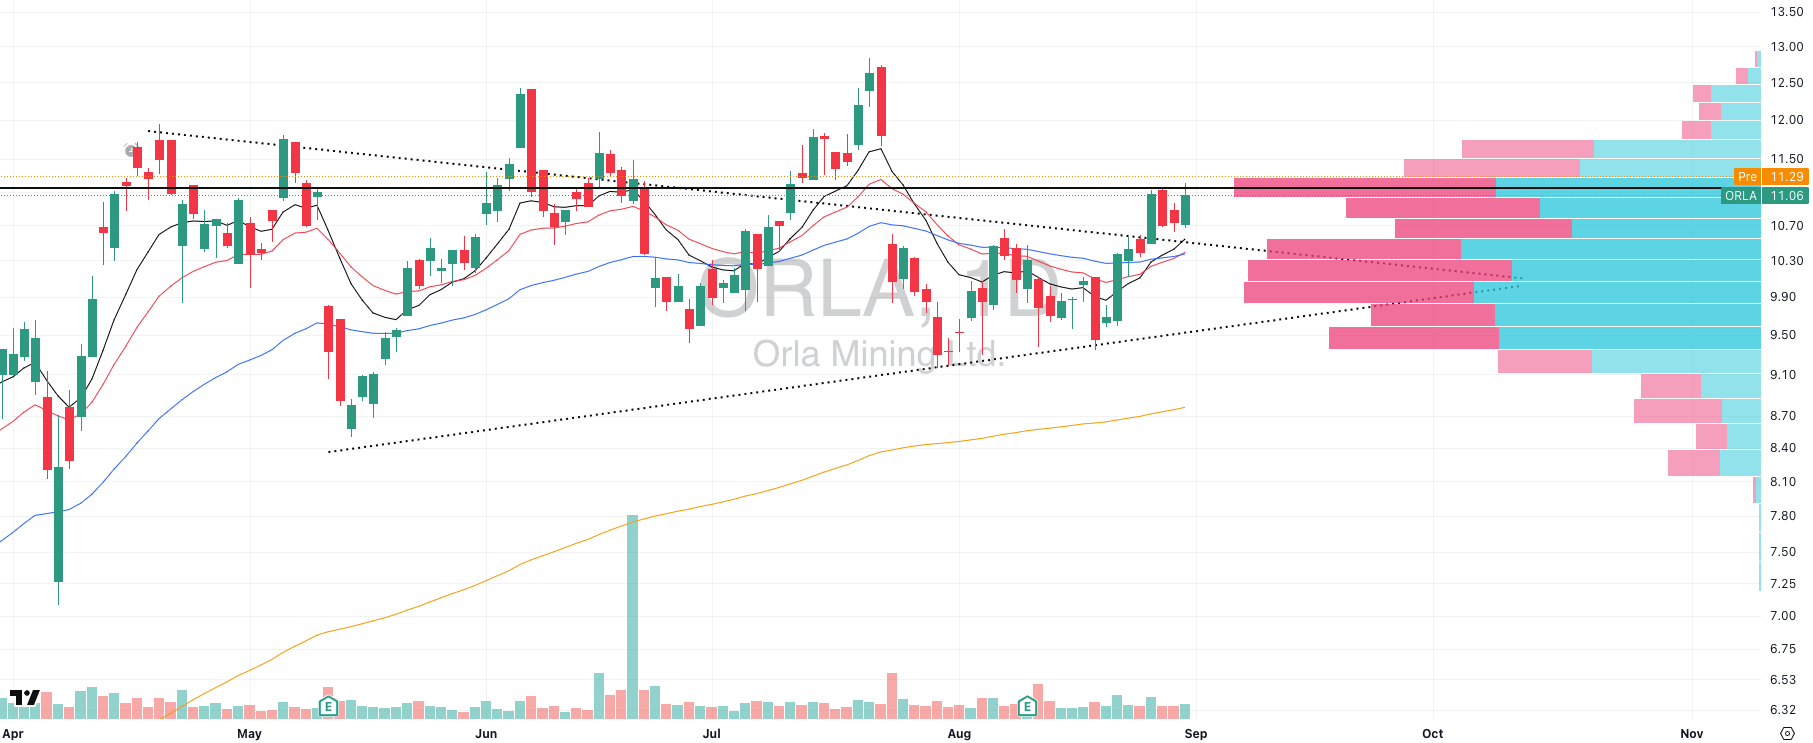
ORLA VRVP Daily Chart
ADR%: 5.06% | Off 52-week high: -13.8% | Above 52-week low: +190.3%
ORLA has quietly been building one of the most attractive technical structures in the precious metals space.
Since April, the stock has carved out a multi-touch ascending base, repeatedly tightening into the $11 zone. Last week’s breakout attempt carried directly into the POC (~$11.25), where supply briefly pushed back and ORLA showed a healthy first retest of the breakout level.
What makes this compelling is the alignment with sector flows: GDX and SIL are breaking out strongly, while equities roll over. ORLA is pressing right at resistance as miners surge, giving it strong tailwinds.
Key Levels & Structure
Immediate resistance: $11.25 POC (current battle zone).
Support cluster: $10.00–10.30 (multi-bounce base, high-volume node).
Breakout trigger: Clean push and close above $11.25 on volume opens the path back toward the 52-week highs.
FOCUSED GROUP
XLE: Follow The Relative Strength

XLE VRVP Daily Chart
Energy just put itself back on the map. Last week’s breakout in XLE on the weekly chart is significant: it marks a clean move through long-standing resistance.
While relative volume hasn’t exploded yet, the technical structure combined with macro context makes this a development we cannot ignore.
Historically, low-rate environments often create tailwinds for dollar-denominated commodities, and oil (closely tied to XLE) has already started to confirm this pattern.

USO Daily Chart
The breakout in USO (United States Oil Fund) adds weight after basing sideways from its August 18th rally off $72, it’s now also breaking higher, showing strong follow-through behavior.
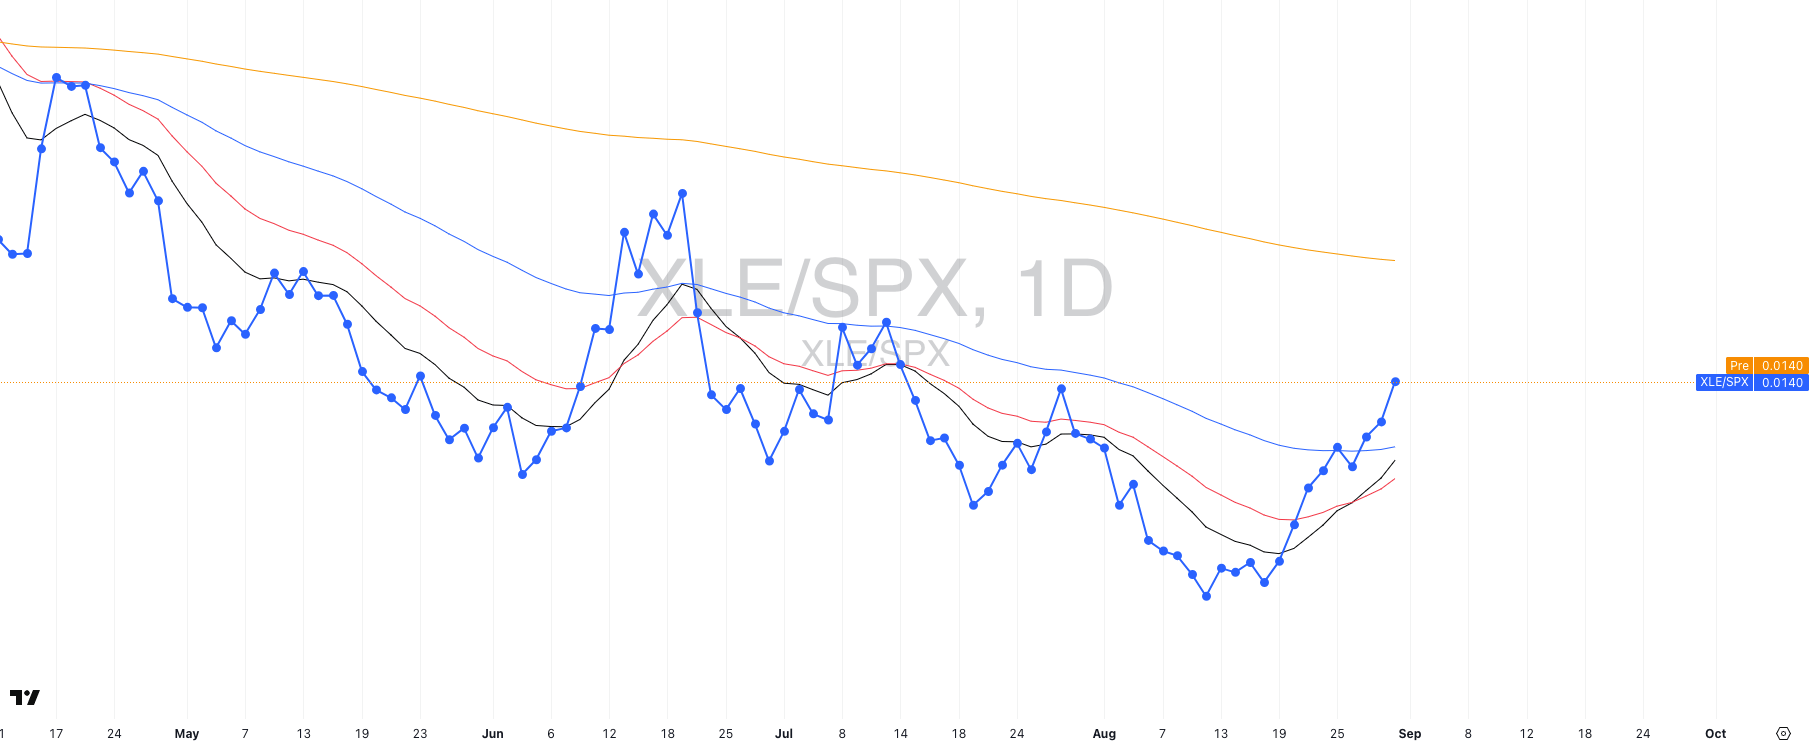
XLE/SPX Relative Strength
Relative strength tells the story even better. XLE/SPX has spiked sharply over the past 2–3 weeks, reclaiming its 50-day relative strength average.
That’s not a small development: when a defensive, commodity-linked group starts to outperform the S&P 500 while other leadership cracks, it signals capital rotation.
This sits alongside what we’ve already seen in precious metals, reinforcing the theme of commodities reasserting themselves as a macro leader.
In Sunday’s Weekend Report in Swingly Pro, our Commitment of Traders breakdown showed early signs of positioning shifts in commodities.
Every week in Swingly PRO, we also publish the strongest momentum stocks by sector and the strongest growth stocks by sector.
Energy’s breakout now puts this group firmly on our radar for inclusion at the top of those lists.

Did you find value in today's publication?This helps us better design our content for our readers |
Reply