- Swingly
- Posts
- The Cleanest Breakout In The Market
The Cleanest Breakout In The Market

MARKET ANALYSIS
Here’s All You Need To Know

The market is continuing to push higher this morning, with S&P 500 futures slightly positive after yesterday’s record close and another major global risk on session.
The main driver remains the same as yesterday: investors are increasingly pricing in the possibility that the U.S. and Iran are moving closer to a deal that could reopen the Strait of Hormuz and reduce the oil shock that has been pressuring markets for weeks.
This matters because the entire macro problem has been oil. If the Strait reopens and crude can move freely again, the inflation pressure that has been hanging over equities begins to ease very quickly.
Brent is still holding above $100, so this is not a clean all clear signal yet, but it is materially better than the panic move we saw when crude was pushing above $115 earlier this week.
The market is not ignoring the risk. Trump has still warned that Iran could be bombed at a much higher level if they do not agree to the peace deal, and the U.S. military also fired on an Iranian oil tanker yesterday after it tried to breach the blockade.
The difference is that the market is now treating those headlines as negotiation pressure rather than immediate escalation.
That is why equities are still holding firm even while the geopolitical tape remains messy.
Yesterday’s market action was very strong, with the S&P 500 and Nasdaq closing at fresh records and the Dow rallying more than 600 points.
The more important point is that the rally was broad enough to matter. Nine of the eleven S&P 500 sectors closed higher, with industrials, technology and communication services all showing leadership.
Energy and utilities were the only sectors lower, which makes sense given the collapse in oil and the renewed preference for growth and cyclical exposure.
Global markets are confirming the same message. Japan’s Nikkei surged more than 5% to a new record as Tokyo reopened after Golden Week, while South Korea’s Kospi also closed at another record high.
The Asia strength is especially important because a lot of that move is still tied to the AI and semiconductor cycle.
Japan, South Korea and Taiwan are all being driven higher by chip demand, AI infrastructure spending and the same global liquidity rotation that has been pushing U.S. growth stocks.
The market is basically saying that AI earnings momentum is still strong enough to outweigh the Iran war risk, at least for now.
That is also why the U.S. market has been so resilient. The S&P 500 is not rallying because the macro backdrop is perfect. It is rallying because earnings remain strong, AI demand remains real, and oil is finally starting to move in the right direction.
AMD helped reinforce that yesterday after surging on strong guidance, and the broader semiconductor complex continues to act as one of the clearest leadership areas in the market.
The concern, as we have discussed repeatedly, is not whether growth is strong. Growth is clearly strong.
The concern is that some of the leading growth areas are now technically extended, which means the market can still be bullish while the best entries become harder.
This is why we need to separate direction from entry quality and directionally, the market still looks strong. Structurally, short term breadth dipped and is now improving, global markets are confirming, AI remains the dominant leadership theme, and falling oil is removing one of the biggest macro headwinds.
From an execution standpoint, chasing the most extended semiconductor and mega cap names after several weeks of vertical expansion still carries poor asymmetry.
The better opportunity remains pullback longs, tight bases, and rotation into strong groups that have not yet reached extreme ATR extension.
The most constructive part of the current tape is that even when geopolitical headlines remain aggressive, the market is not breaking down.
That tells us buyers are still willing to look through the Iran risk as long as oil does not reaccelerate and the deal process continues moving forward.
Today’s focus should be simple: watch whether Brent can stay close to the $100 area without reclaiming the highs, watch whether the AI and semiconductor leadership continues to hold, and watch whether buyers keep rotating into broader growth rather than only chasing the same extended leaders.
Nasdaq
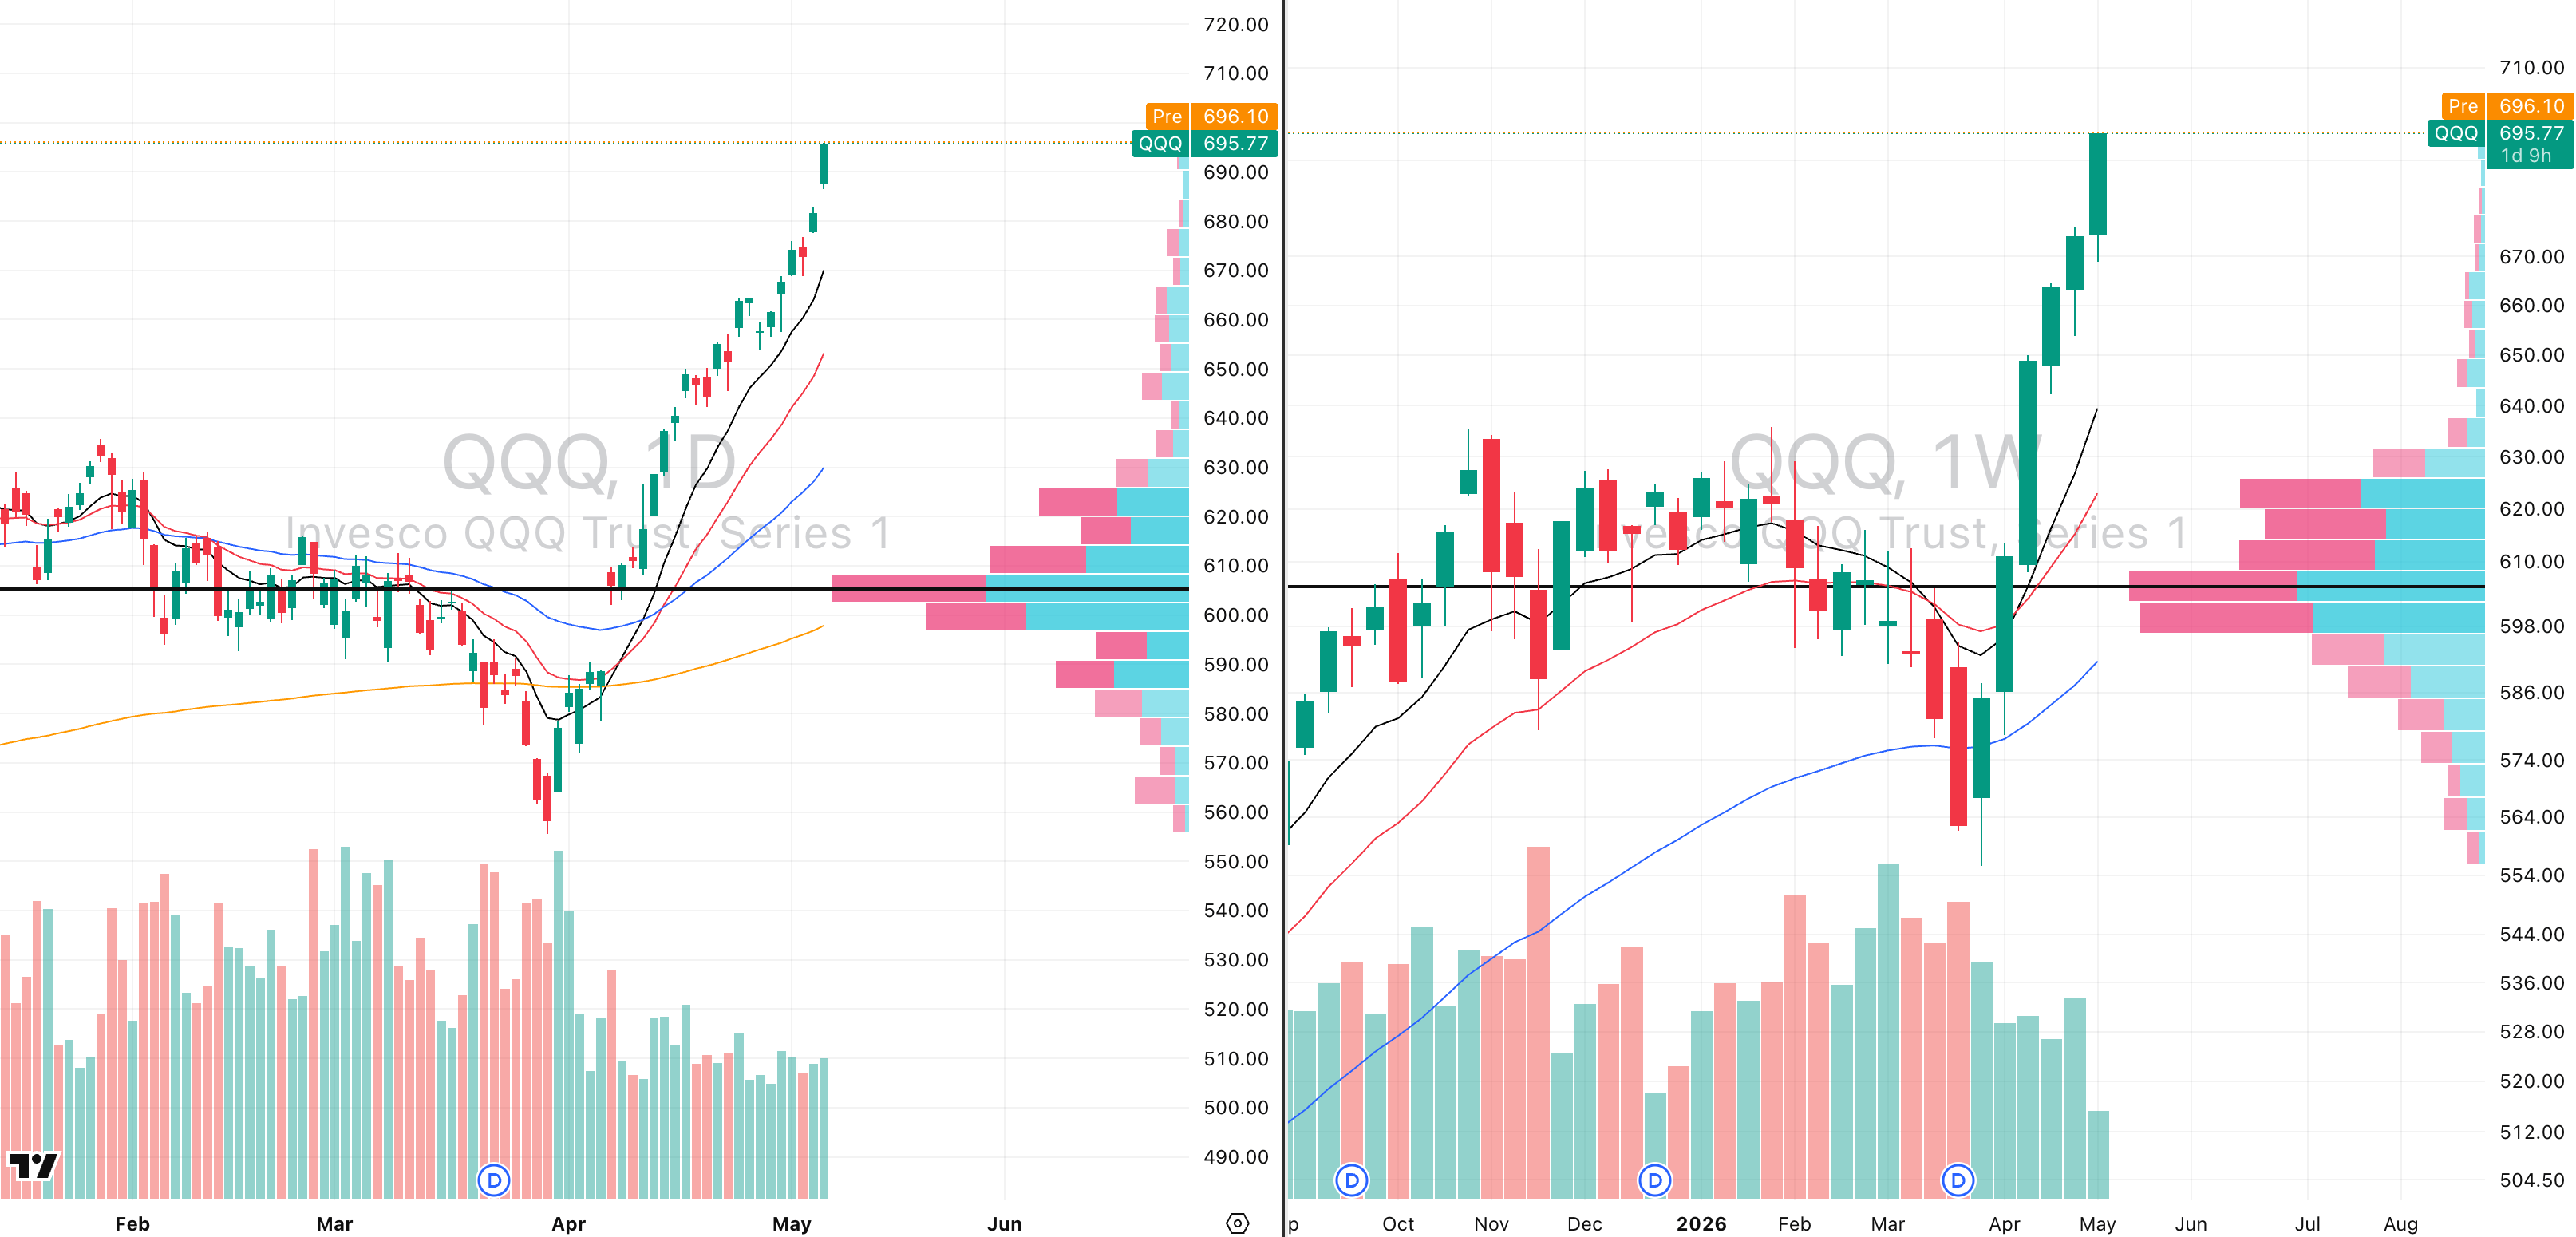
QQQ VRVP Daily & Weekly Chart
62.37%: over 20 EMA | 56.43%: over 50 EMA | 55.44%: over 200 EMA
QQQ still has extremely high relative strength, with the RS rating now sitting around 79.4 versus the SPX.
We have also seen a slight uptick in relative volume over the last three sessions, which is important because the Nasdaq has pushed around 4.08% during that period.
Yesterday’s candle had an intraday range of roughly 1.44%, which is around 0.22% greater than the expected daily range.
That tells us the Nasdaq is not just grinding higher quietly. It is expanding in both price and range.
The issue is still extension as the QQQ is now sitting around 8.85 ATR multiples above its 50 day moving average, which is extremely stretched.
The closer we get to around 10 ATR multiples, the more the mean reversion risk starts to rise exponentially.
That does not discredit the strength of the Nasdaq. It simply tells us that the quality of new entries becomes much more important.
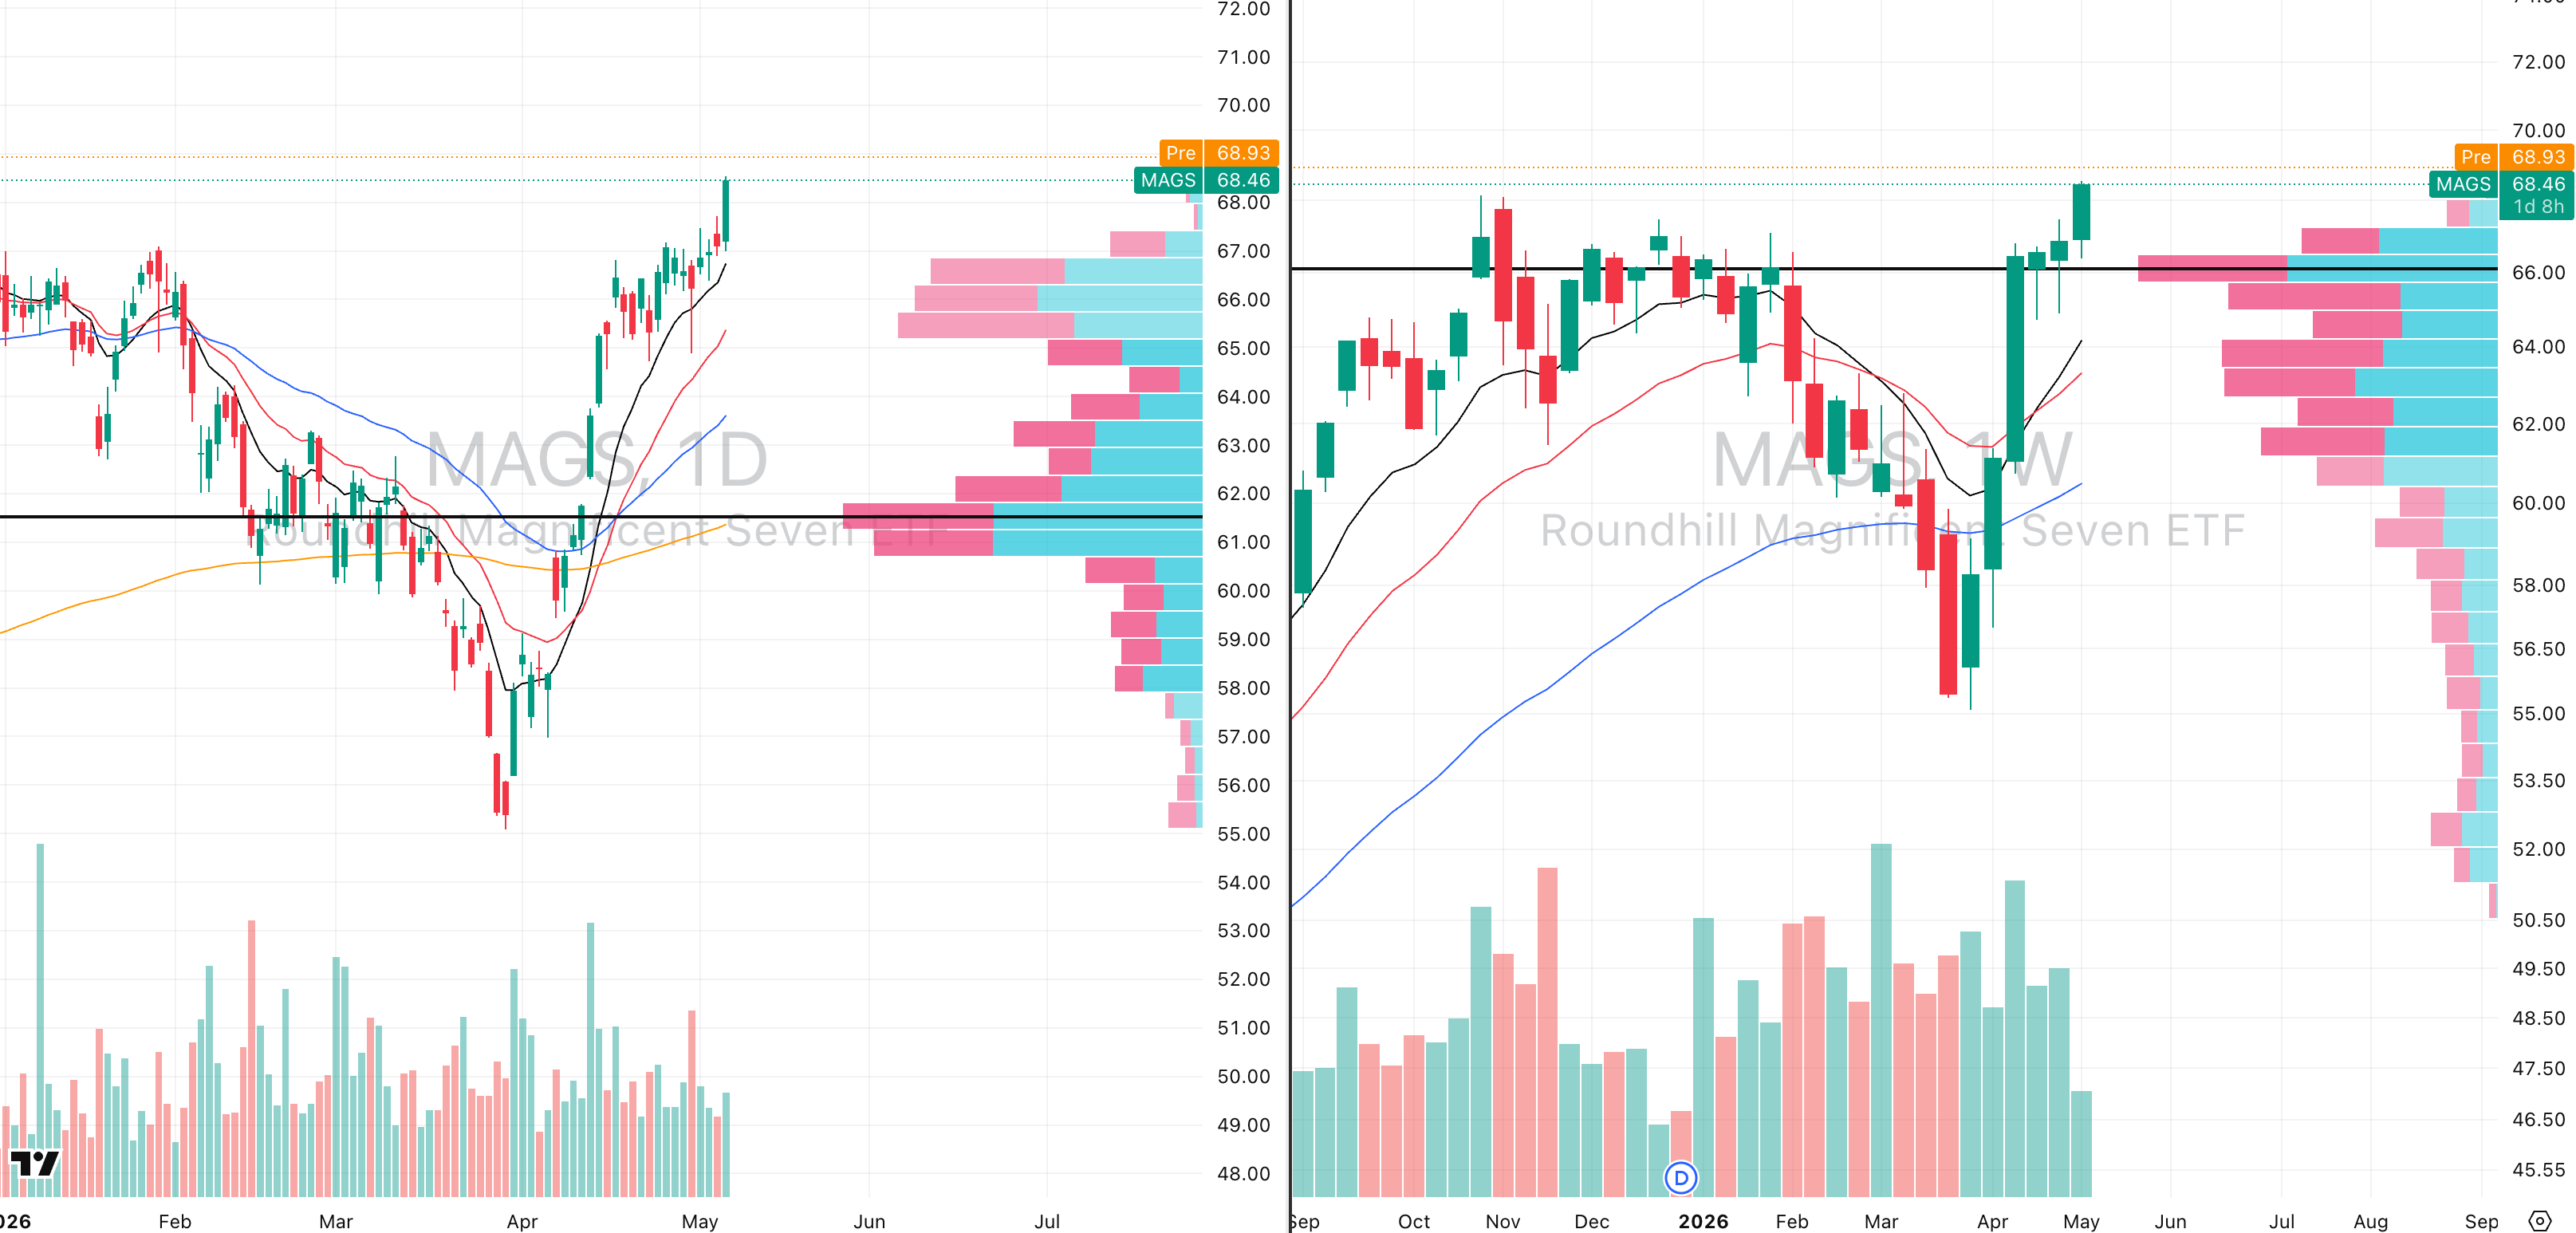
MAGS VRVP Daily & Weekly Chart
A lot of this strength is still coming from the Magnificent Seven, which materially broke out yesterday after consolidating inside a continued Stage 2 rally structure.
This matters because the Magnificent Seven are not just a random group of leadership stocks. They are the real engine behind the U.S. equity market.
In 2025, the Magnificent Seven accounted for more than 50% of all gains inside the U.S. equities market.
In 2024, they accounted for just over 40% of all gains and these names disproportionately drive both the S&P 500 and the Nasdaq, so when they are holding trend and breaking out, it is very difficult to argue that the market is weak.
The Magnificent Seven ETF itself is still sitting around 5.5 ATR multiples above its 50 day moving average, which is hot but not as stretched as QQQ itself.
Yesterday’s expansion was also very strong because it came after a test of the rising 10 day moving average.
Between 67.38, which was the high of the consolidation range, and yesterday’s highs at 68.53, the visible range volume profile continued to show very strong buyer aggression.
At 67.38, we saw roughly 118,000 shares traded green versus only around 47,000 shares traded red.
At the top of yesterday’s candle around 68.53, we saw another three to one imbalance in favour of buyers, with roughly 303,000 shares traded green versus only around 107,000 shares traded red.
The important point is that buyer aggression continued to rise throughout the entire session.
With this level of strength inside the Magnificent Seven, which account for roughly 38% to 40% of the Nasdaq, an immediate mean reversion in QQQ becomes less likely.
The market is extended, but the underlying leadership is still showing real demand.
That means the correct view is not bearish. It is bullish, but disciplined and we still do not want to chase late marginal highs in QQQ at almost 9 ATR multiples from the 50 day EMA.
S&P 400 Midcap
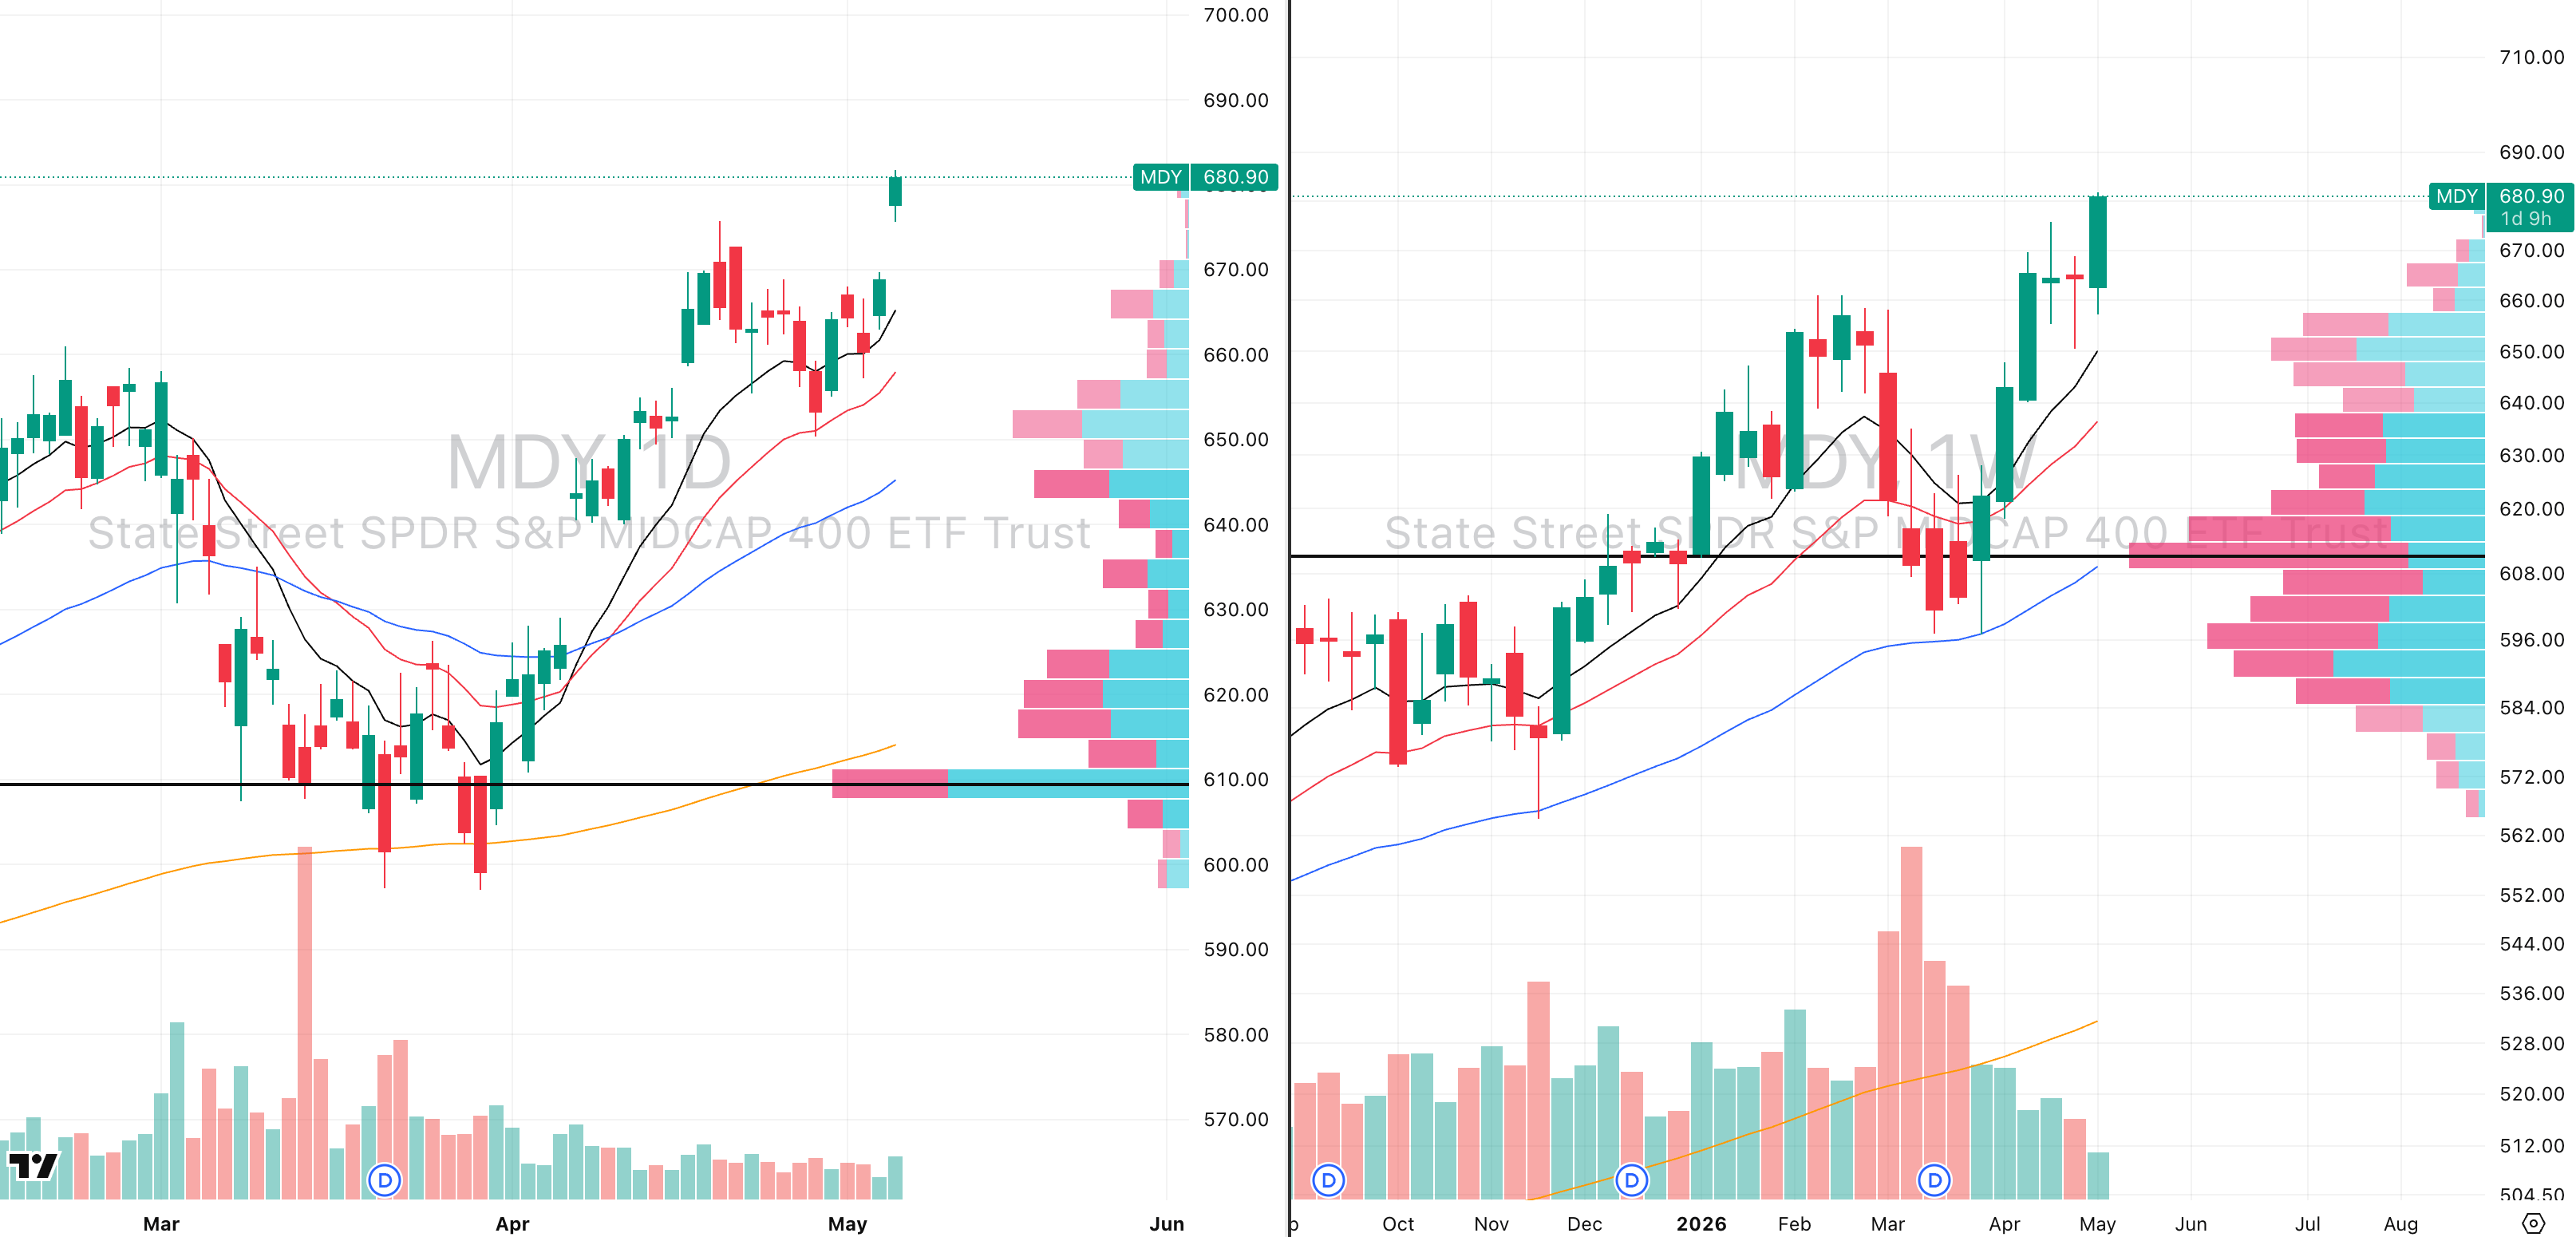
MDY VRVP Daily & Weekly Chart
60.50%: over 20 EMA | 65.50%: over 50 EMA | 60.50%: over 200 EMA
MDY continued higher yesterday with a very strong breakout although the relative volume was still low at only 58% of the 20 day average, so we are still seeing the broader issue of price expanding on below average volume.
That said, relative volume did meaningfully improve versus the last two weeks of trading.
At this stage, that relative improvement matters because the absolute 20 day average is still being distorted by the much higher volume environment from the prior distribution phase.
Yesterday’s move included a gap up and push of roughly 2%, which is around 0.7 times greater than the expected average daily range when including the gap.
We believe the midcaps can continue to rally and climb from here.
The strength across the U.S. market is still being under trusted by a lot of traders, which is exactly what we saw in Sunday’s Commitment of Traders report.
A lot of participants still do not fully believe this rally, largely because of the uncertainty around the U.S. and Iran situation.
This is where price action matters more than narrative and the market is a forward looking discount mechanism, and right now it appears to be pricing in the idea that a large portion of the Iran related uncertainty is already behind us.
From an asymmetry standpoint, MDY is a much cleaner long opportunity than QQQ or even SPY.
The reason is simple. MDY is only around 4.45 ATR multiples above its 50 day moving average, which is meaningfully less extended than QQQ.
That gives the midcaps more upside room before technical extension becomes a serious problem.
MDY is also still fresh inside its Stage 2 continuation breakout.
This increases the quality of the long setup because the index is participating in the risk on move without being as aggressively stretched as the Nasdaq.
It tells us that the rally is moving further down the capitalization curve, and that is exactly what we want to see in a broadening risk on tape.
Russell 2000
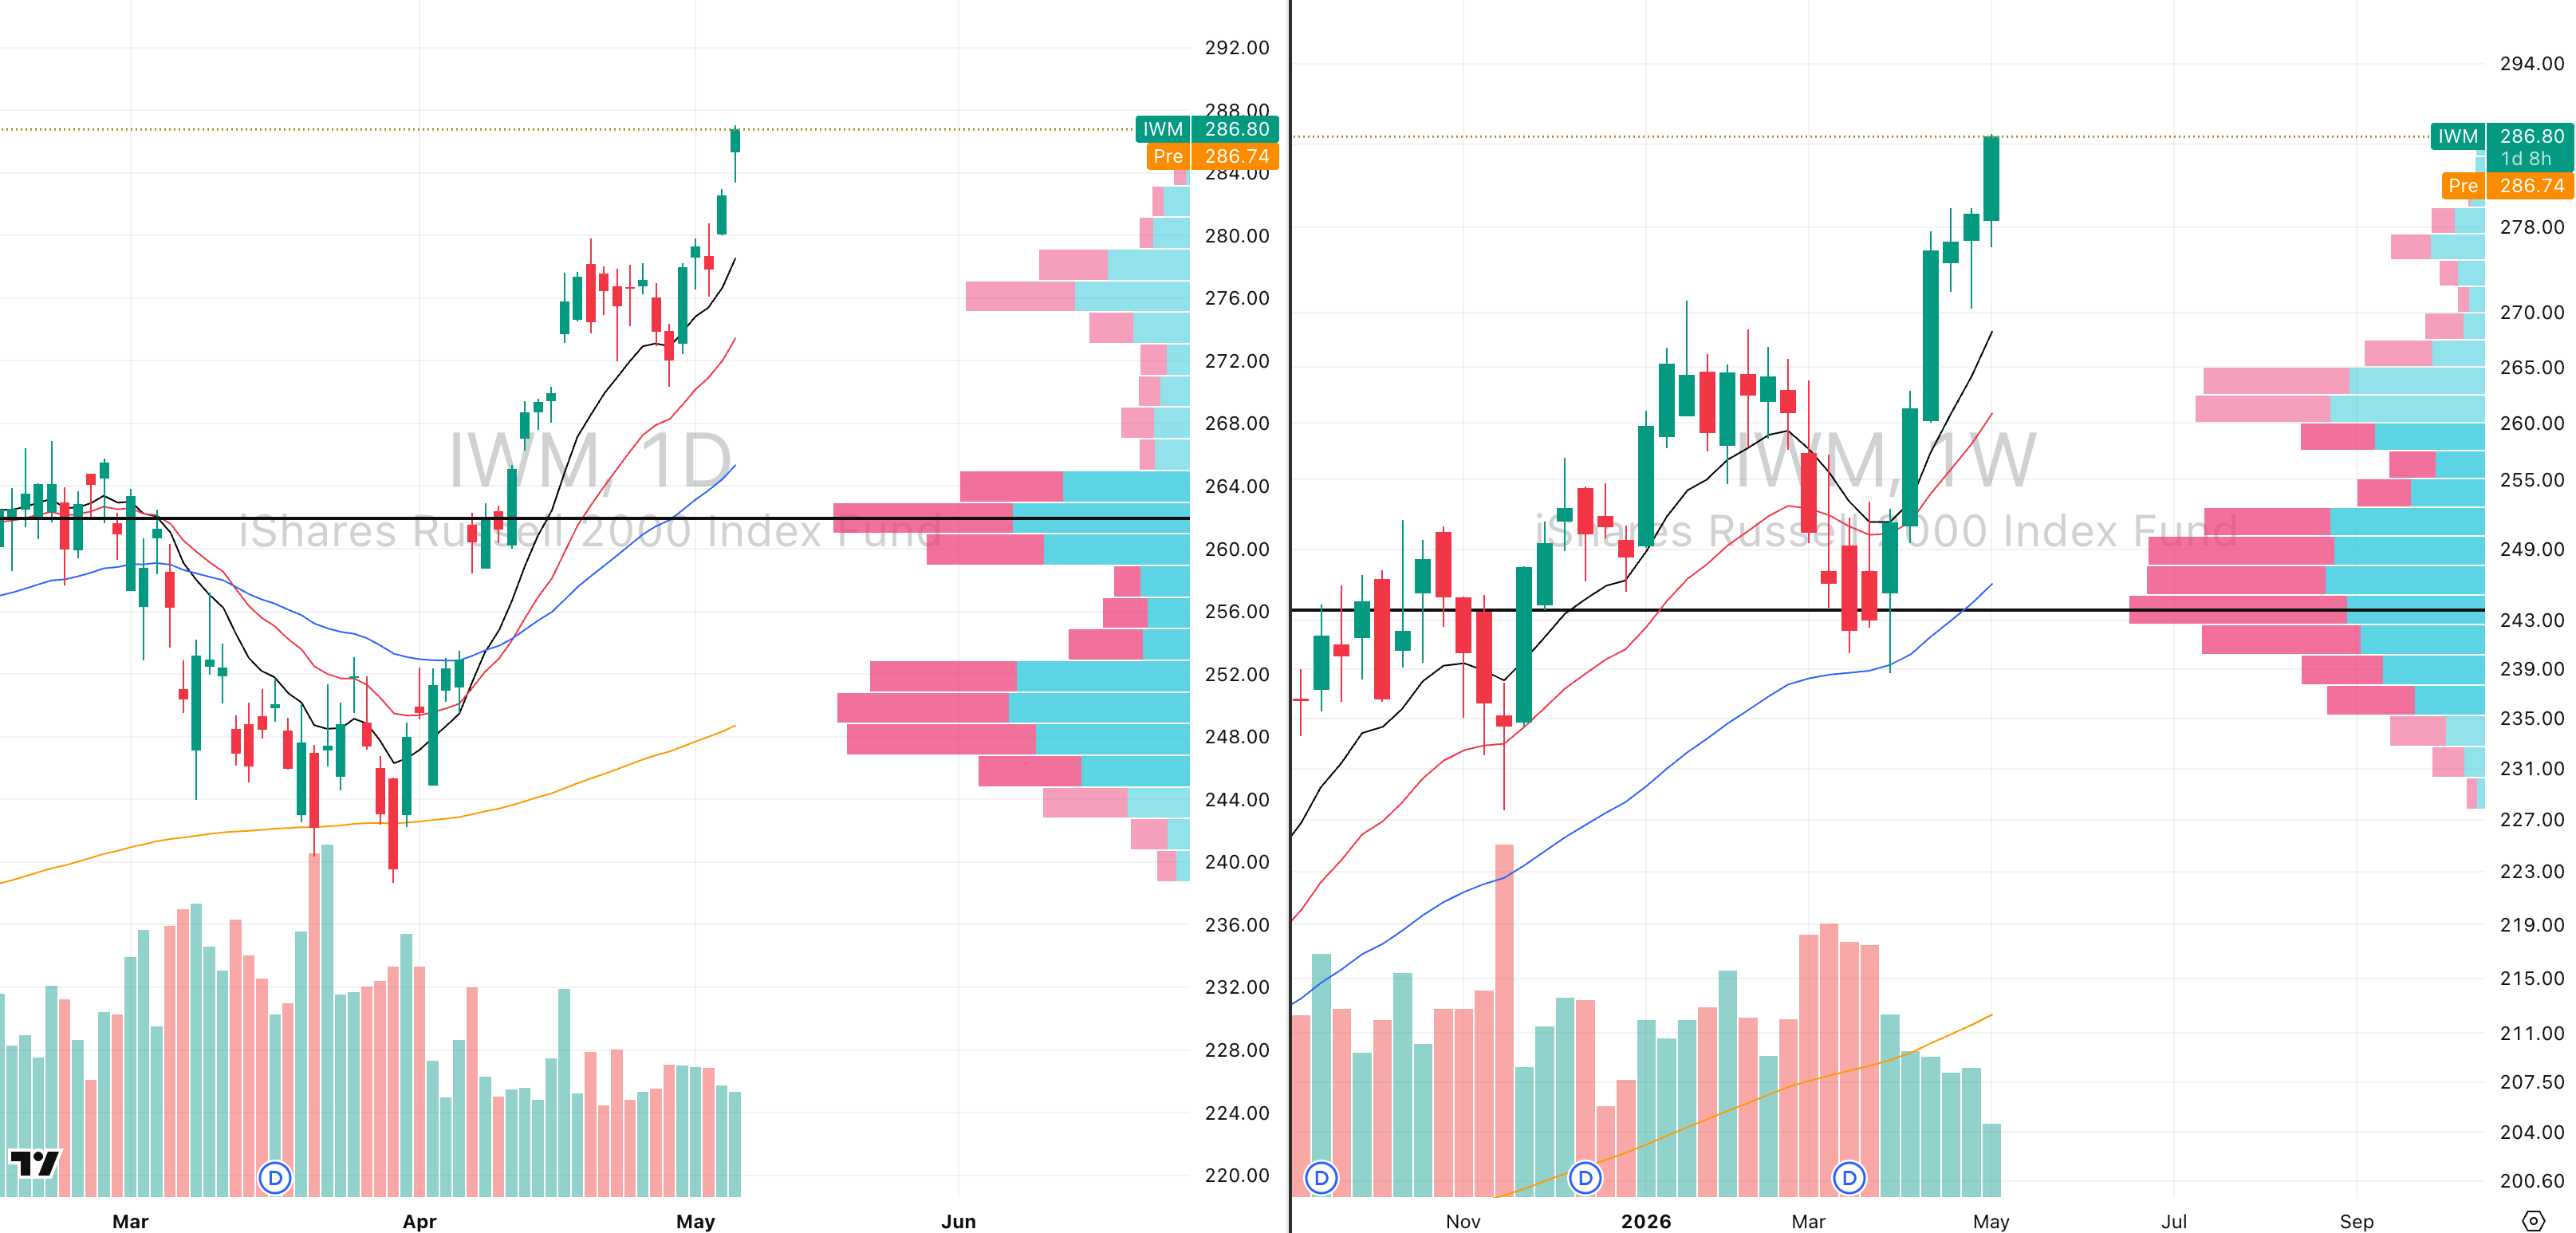
IWM VRVP Daily & Weekly Chart
65.91%: over 20 EMA | 73.49%: over 50 EMA | 62.72%: over 200 EMA
IWM remains the strongest capitalization group inside the U.S. equity market.
The Russell 2000 now has a relative strength rating around 81.4 versus the SPX, which is stronger than both QQQ and MDY.
That is a major signal because small caps are usually the clearest expression of speculative risk appetite.
IWM is now sitting around 6.11 ATR multiples above its 50 day moving average, so it is getting a little hot in the short term.
However, the structure remains very strong and we have not seen a single red candle on the weekly structure for almost six weeks.
Yesterday’s relative volume was still low at around 57%, and relative volume has actually declined over the last three sessions as price has continued expanding higher.
That is something to watch because low volume rallies can create sharp reversals when buyers stop supporting the move.
However, the important caveat is what we are seeing inside the visible range volume profile.
Between 279, which was the top of the consolidation range going back to April 17th, and yesterday’s highs, we are still seeing an average imbalance of roughly three to one in favour of buyer aggression.
At yesterday’s lows around 283.36, we saw roughly 2M shares traded green versus only around 800,000 shares traded red.
At the top of the prior consolidation range around 279, we saw roughly 3M shares traded green versus only around 1M shares traded red.
That tells us buyers are still materially more aggressive than sellers.
The reduction in relative volume is worth respecting, but when we break the volume down more deeply, the majority of that volume is still coming from buyers aggressively hitting the ask and pushing price higher.
That is why we do not want to fight this trend as the IWM is extended enough that we should avoid emotional chasing, but the price action and buyer aggression are still telling us this is a powerful risk on move.
Small caps remain one of the best proxies for broad risk appetite, and right now that message is still clearly bullish.
FOCUSED GROUP
XME: Metals & Mining Are Still The Long Play
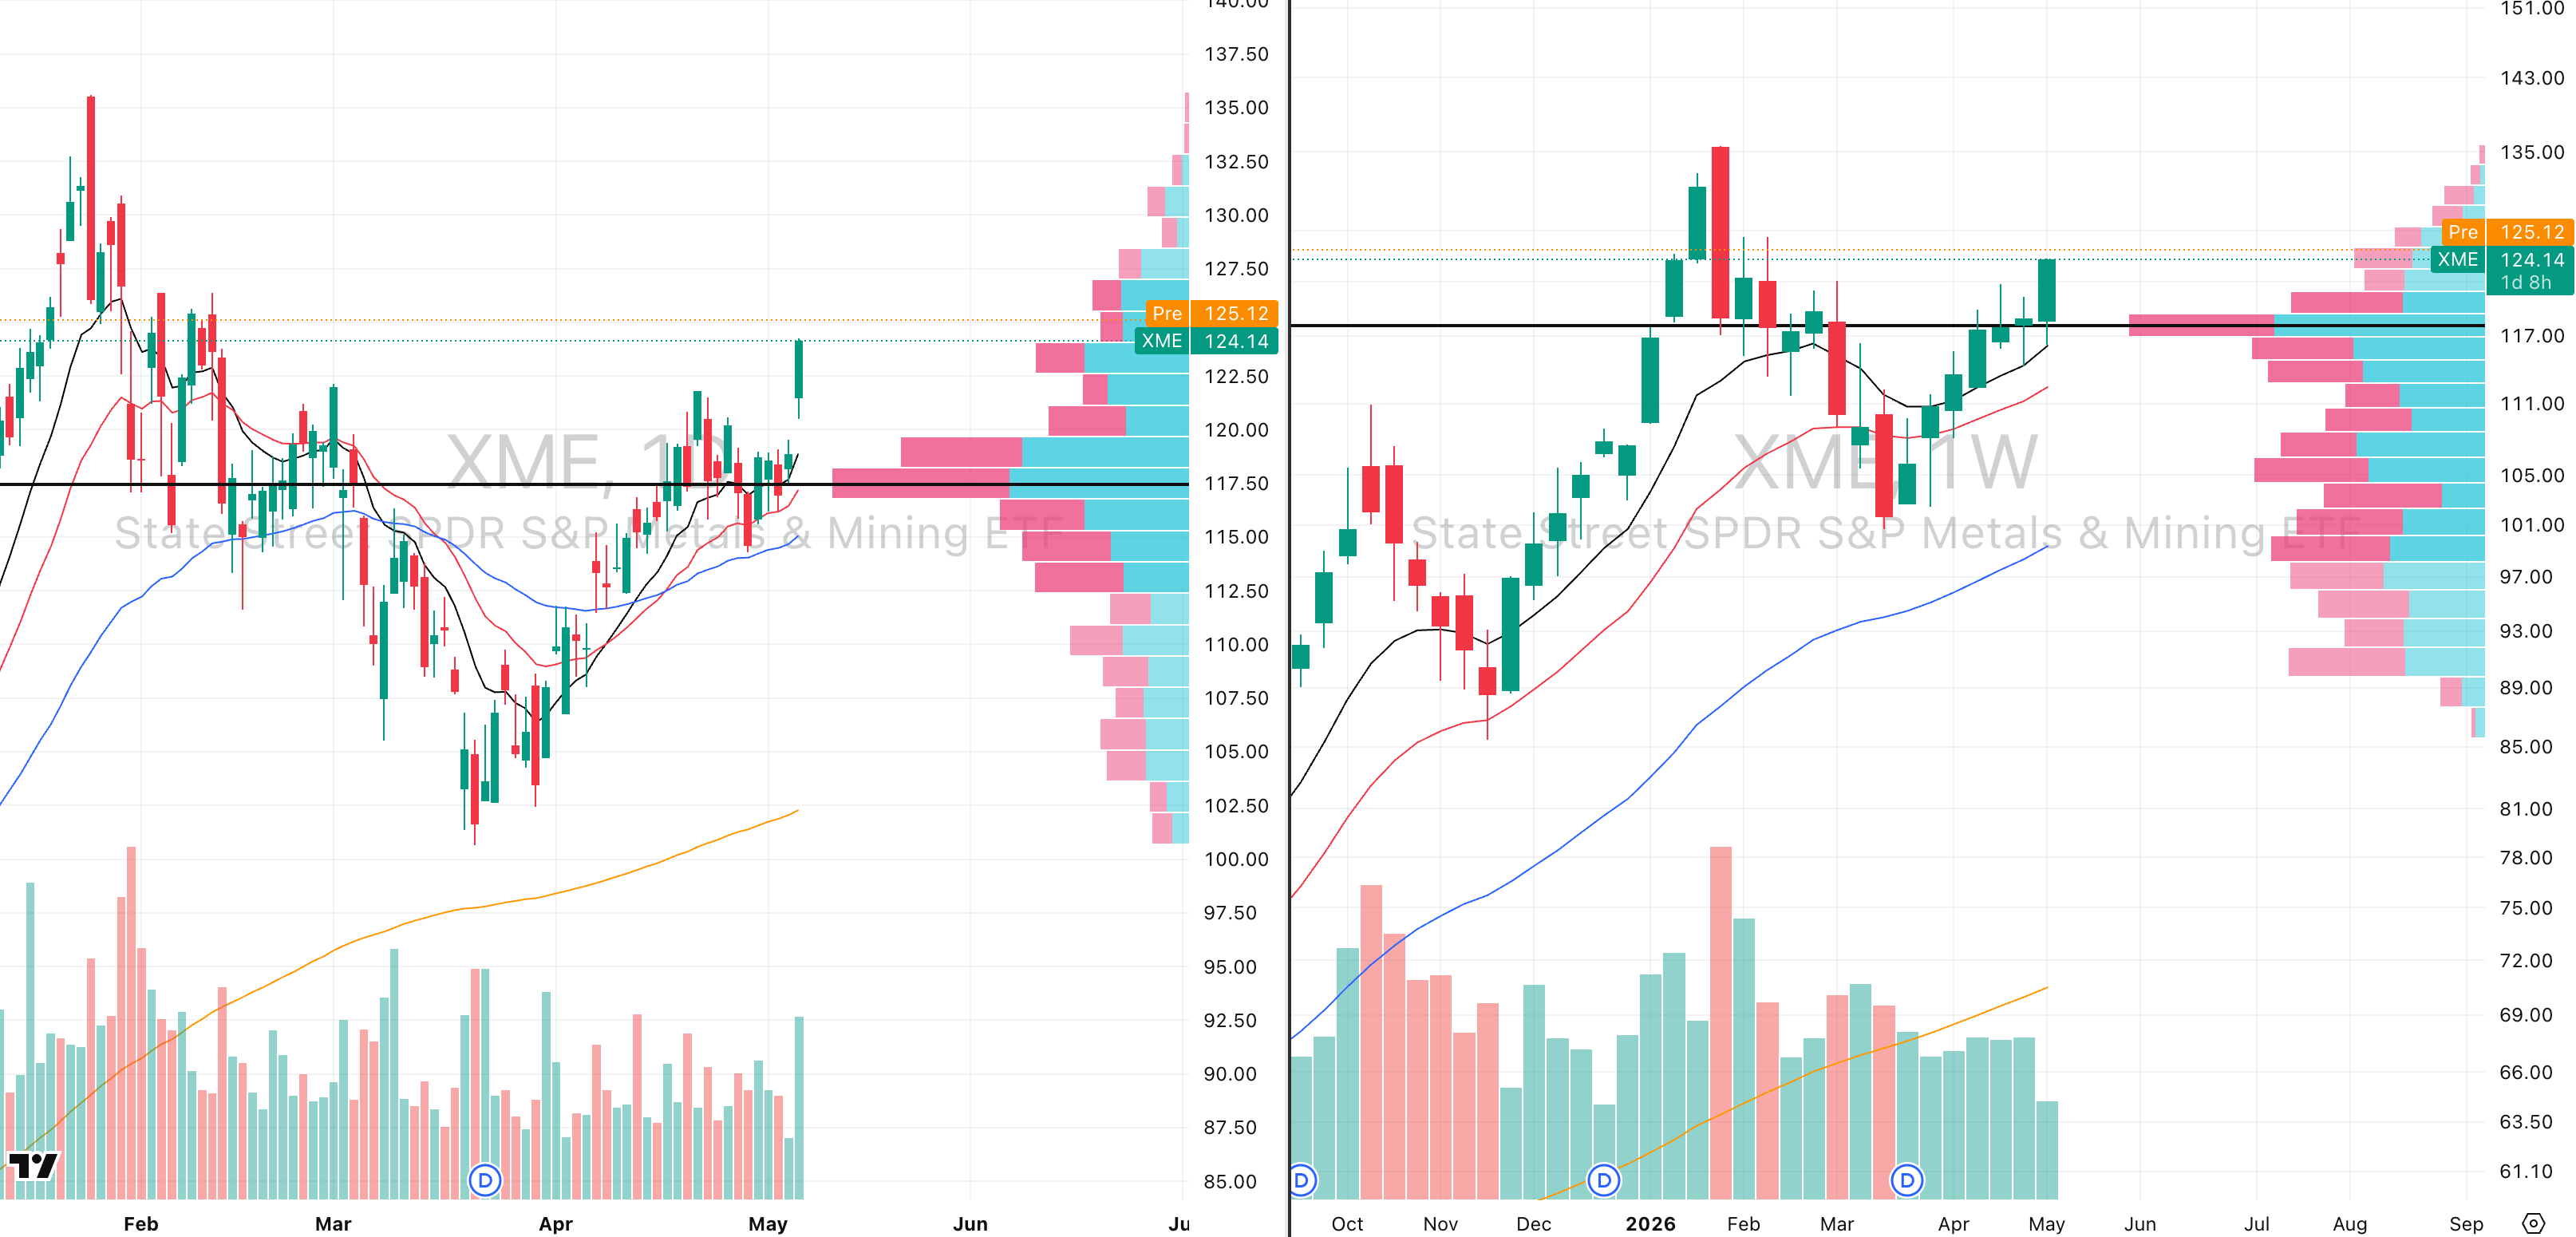
XME VRVP Daily & Weekly Chart
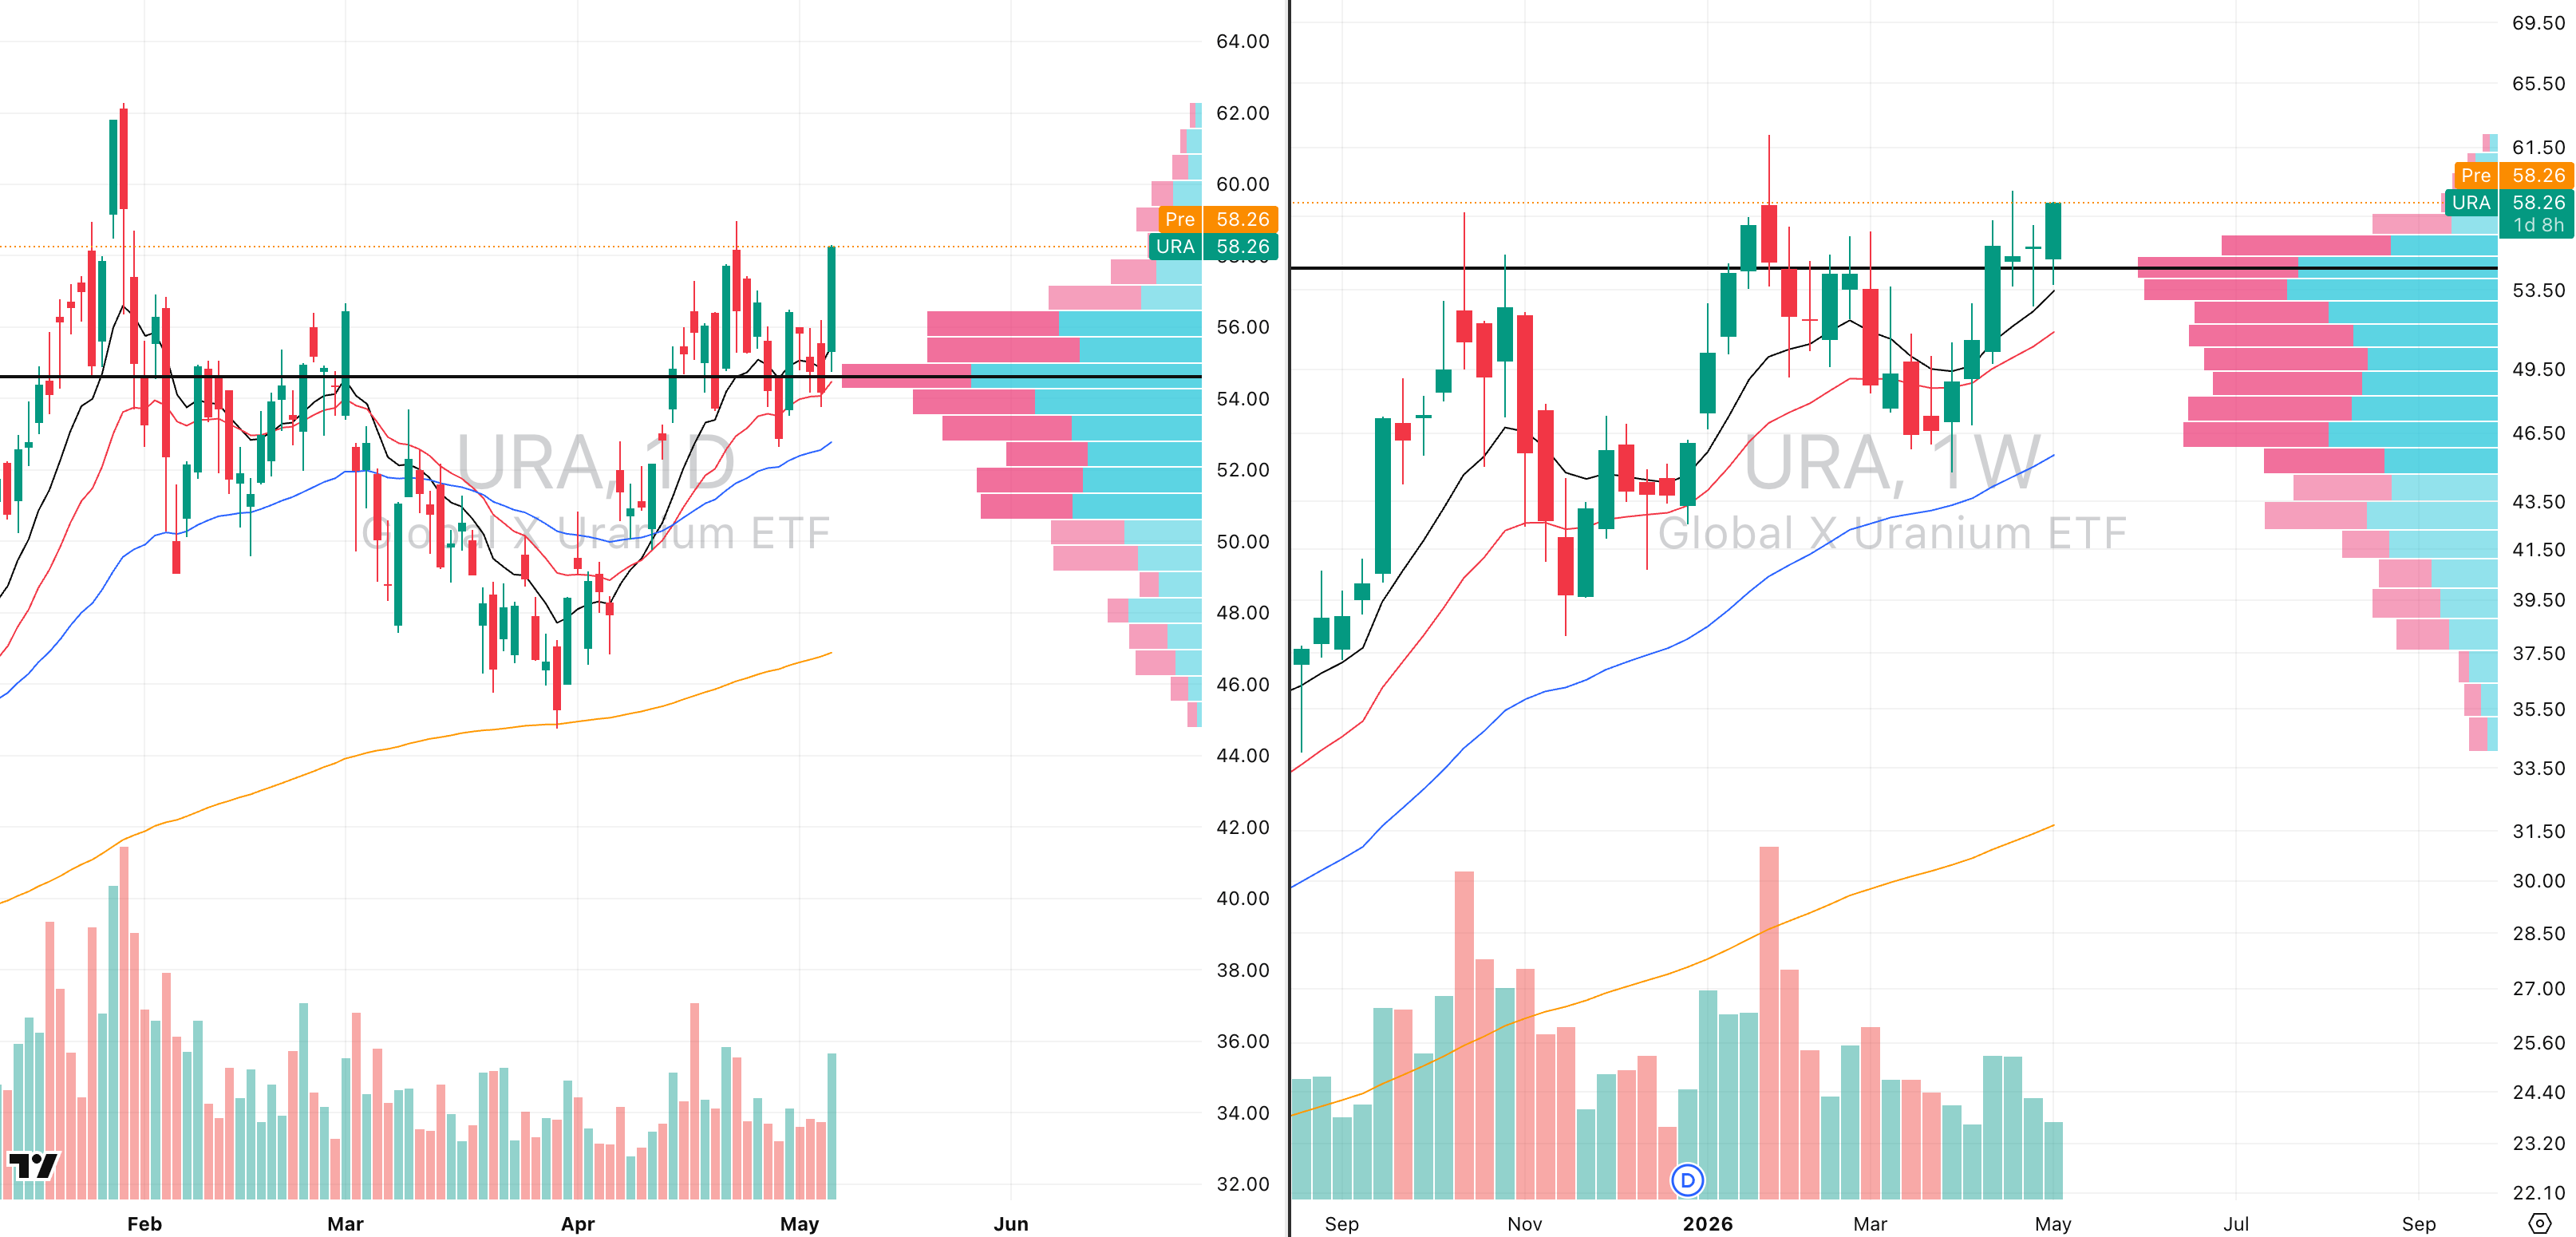
URA VRVP Daily & Weekly Chart
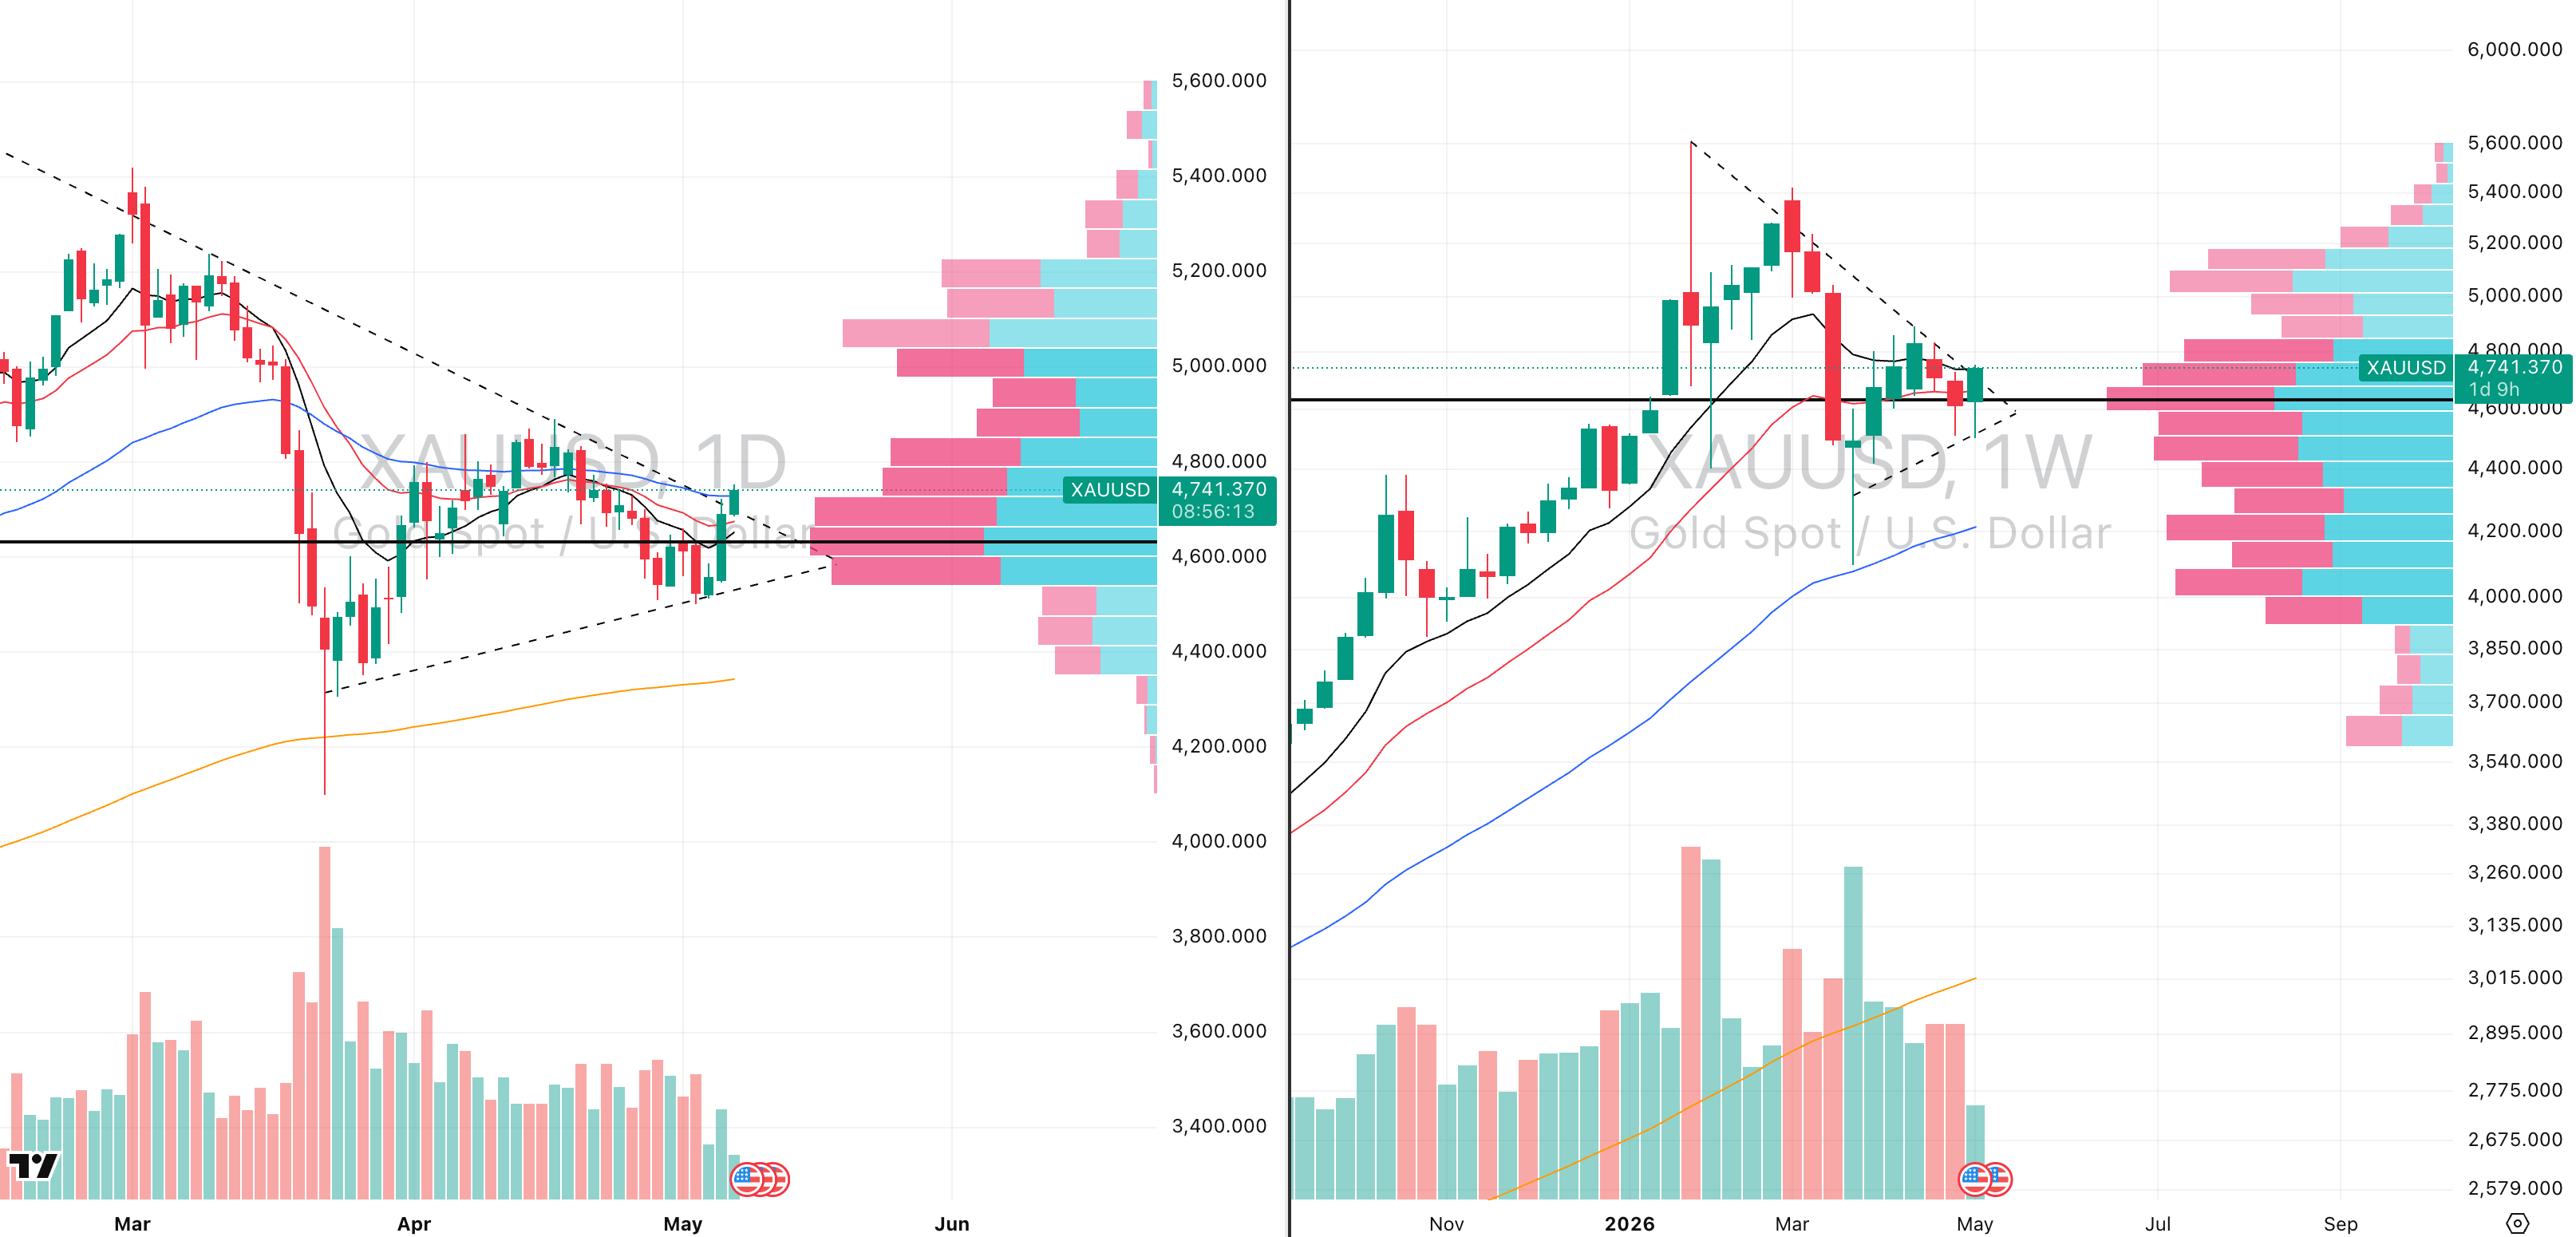
XAUUSD VRVP Daily & Weekly Chart
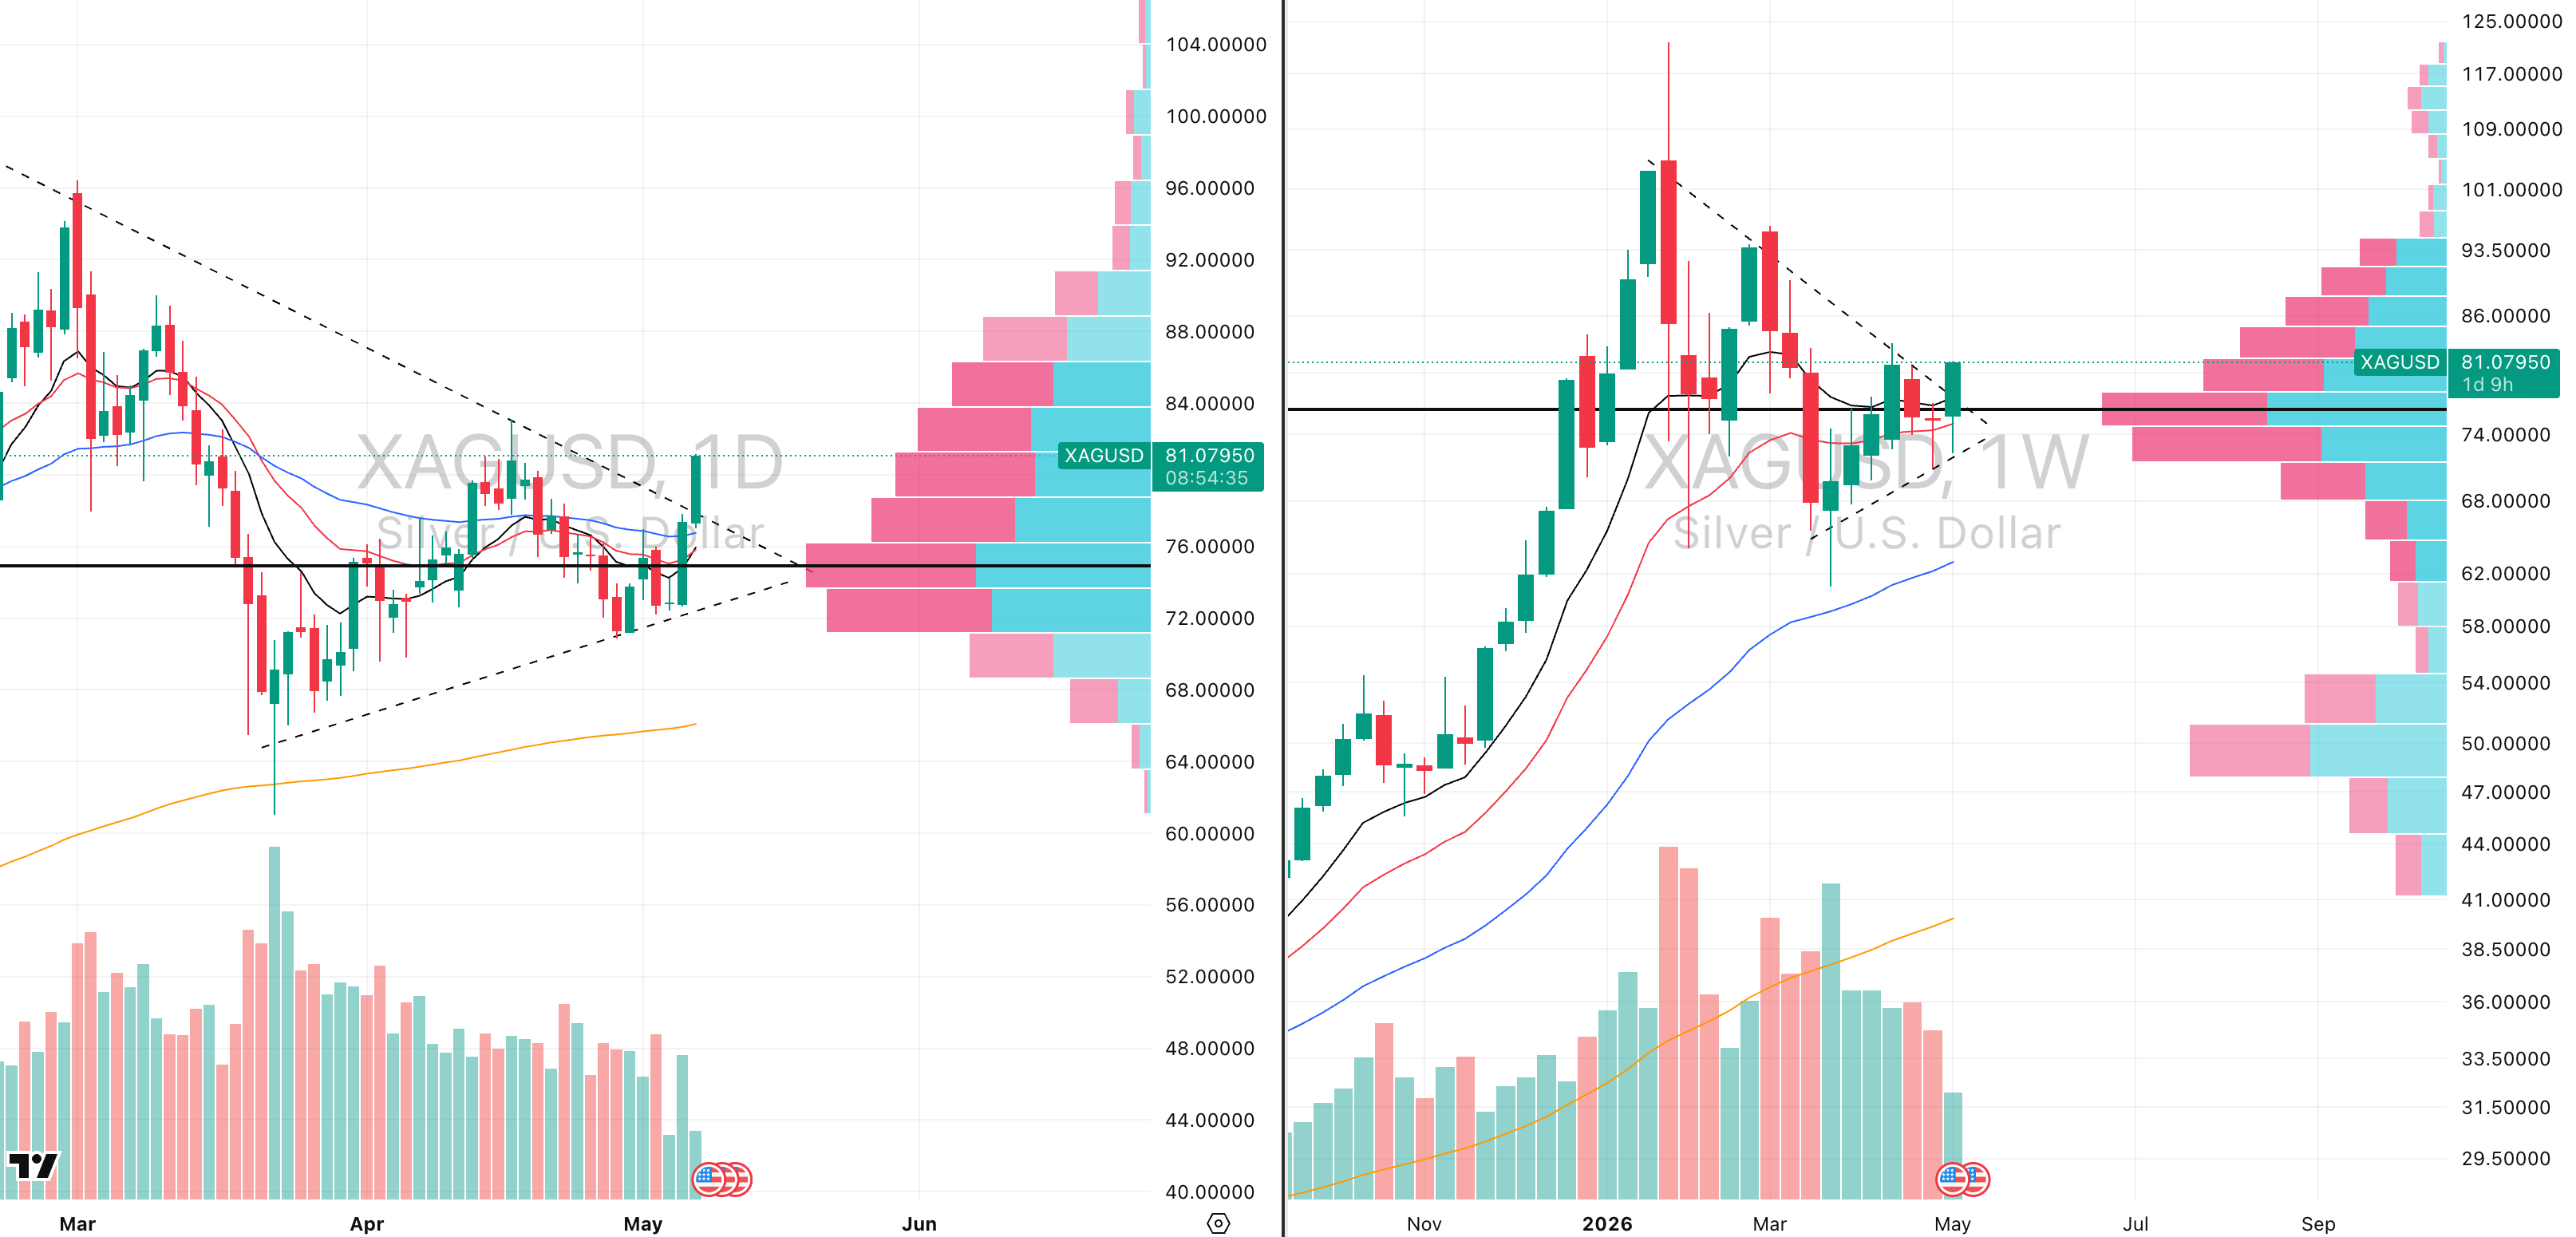
XAGUSD VRVP Daily & Weekly Chart
We remain extremely bullish on the metals and mining segment, and this is still where we want to be pushing exposure.
XME had a very strong breakout yesterday on 150% relative volume, with its relative strength rating now at 90 versus the SPX and still climbing.
The important point is that XME tested its rising 10 week moving average at 116.17 on Monday, held that level, and then expanded aggressively higher.
That is exactly what we want to see from a group starting a fresh rally phase.
This is not isolated strength. The entire metals complex is confirming the same move.
URA also broke out yesterday on 152% relative volume, with a 90 relative strength rating versus the SPX.
URA is showing the same structure as XME, with a strong test of the rising 10 week moving average followed by expansion higher.
Gold is now breaking out from a very tight base after building higher lows since March 23rd, giving us roughly 43 days of compression.
Silver is even more attractive from our perspective because it has higher volatility and a stronger 92 relative strength rating versus the SPX.
Silver is breaking out this morning, and although the best entry was yesterday, we do not believe it is too late for exposure.
The key point is simple: XME, URA, gold and silver are all moving together.
This is a fresh breakout phase, not a late stage chase.
The group has rising moving average support, improving relative strength, expanding volume and tight bases.
This is exactly the environment where breakouts can be rewarded.
We would be focusing on the strongest names inside metals and mining, using XME and URA as the main group proxies.
From our perspective, this is one of the cleanest long exposure areas in the market right now.

Did you find value in today's publication?This helps us better design our content for our readers |
Reply