- Swingly
- Posts
- The Bounce Everyone Wants to Believe In
The Bounce Everyone Wants to Believe In


MARKET ANALYSIS
Here’s What You Need To Know

We saw a very needed bounce to start this premarket in February, with equities building on Monday’s strength and continuing to respect their intermediate weekly structure.
Despite elevated volatility across asset classes last week, the broader market has so far behaved like it is digesting gains rather than transitioning into distribution.
From a trend perspective, the most important takeaway is that key indices remain above their rising 10-week moving averages, keeping the intermediate trend intact.
Short-term price action remains noisy, largely due to ongoing mega-cap earnings and recent positioning resets, but this has not translated into meaningful weekly damage.
One notable macro development came from Washington, where Donald Trump announced the launch of a $12 billion U.S. strategic critical minerals stockpile, known as Project Vault.
The initiative is aimed at reducing U.S. reliance on China for rare earths and critical materials, with funding expected to combine private capital and government-backed loans.
Markets reacted quickly, with rare earth and critical mineral equities seeing sharp premarket strength, reinforcing the policy-backed bid under domestic resource and infrastructure-linked themes.
This aligns well with the broader leadership we’ve been tracking in industrials, materials, energy-adjacent services, and select infrastructure names, rather than speculative growth.
Precious metals also rebounded after last week’s historic liquidation, supporting the view that the recent sell-off was primarily a positioning reset as things clearly got very overbought and the long trade was crowded.
Nasdaq

QQQ VRVP Daily & Weekly Chart
44.55%: over 20 EMA | 53.46%: over 50 EMA | 54.45%: over 200 EMA
The NASDAQ defended a critical level yesterday, bouncing cleanly off the rising 50-day EMA, which we highlighted as one of the most important levels to hold.
More importantly, on the higher timeframe, this bounce also came directly off the weekly point of control and the rising 10-week moving average, which keeps the broader weekly structure intact.
That said, the bounce lacked conviction, with relative volume coming in at just 90% of the 20-day average, suggesting demand was present but not aggressive.
There remains heavy supply overhead around the 628 area, which is likely to continue driving volatility and intermittent downside pressure.
Breadth remains weak, with only ~45% of NASDAQ stocks above their 20-day EMA, indicating that participation is still very narrow.
In fact, despite the QQQ closing higher, the average NASDAQ stock declined on the session, meaning gains were driven by a small handful of names.
The key takeaway is that the NASDAQ is still in a large weekly base and volatility contraction pattern that has been developing since October 2025.
At this stage, the most constructive outcome would be sideways contraction, allowing the market to absorb supply rather than attempting premature breakouts.
S&P 400 Midcap
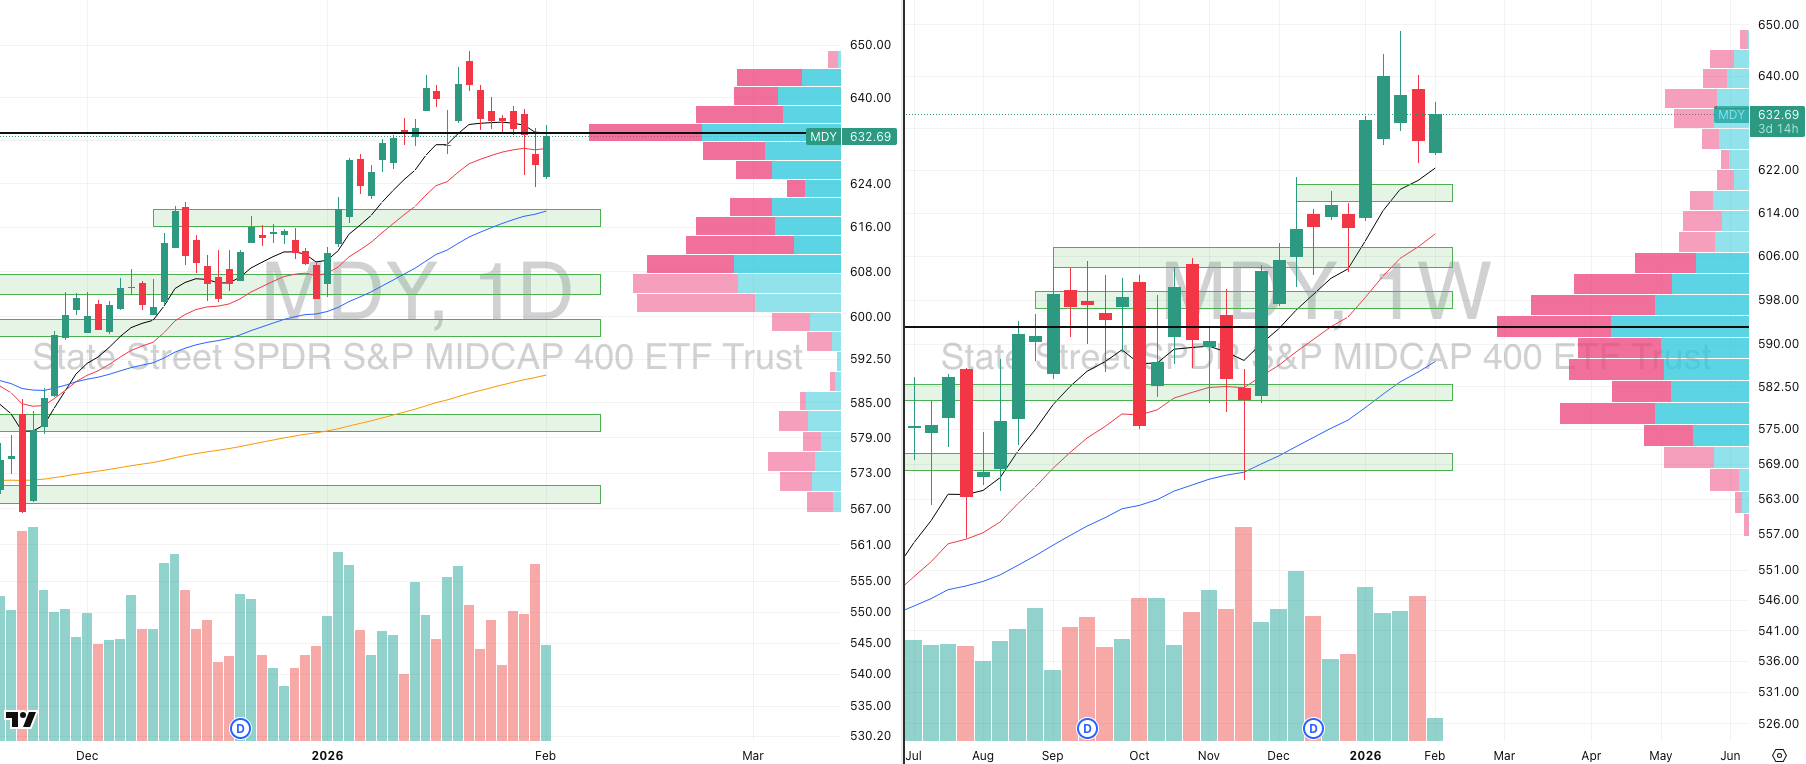
MDY VRVP Daily & Weekly Chart
50.12%: over 20 EMA | 65.91%: over 50 EMA | 64.66%: over 200 EMA
Mid-caps continue to show relative strength versus the NASDAQ and defended Friday’s lows around 624 with clear evidence of demand.
The visible range volume profile shows aggressive buying as price approaches the rising 10-week moving average near 623.
At 625, buying pressure exceeded selling pressure, and near Friday’s lows the imbalance was even more pronounced, with nearly double the green volume versus red.
This behaviour is consistent with a healthy stage-two rally that began after the Morning Star formation in mid-November.
On a breadth basis, mid-caps remain structurally stronger, with roughly 66% of stocks above their 50-day EMA, compared to just ~53% in the NASDAQ.
Until big-tech earnings are fully resolved, mid-caps remain better positioned and are likely to continue outperforming.
Russell 2000
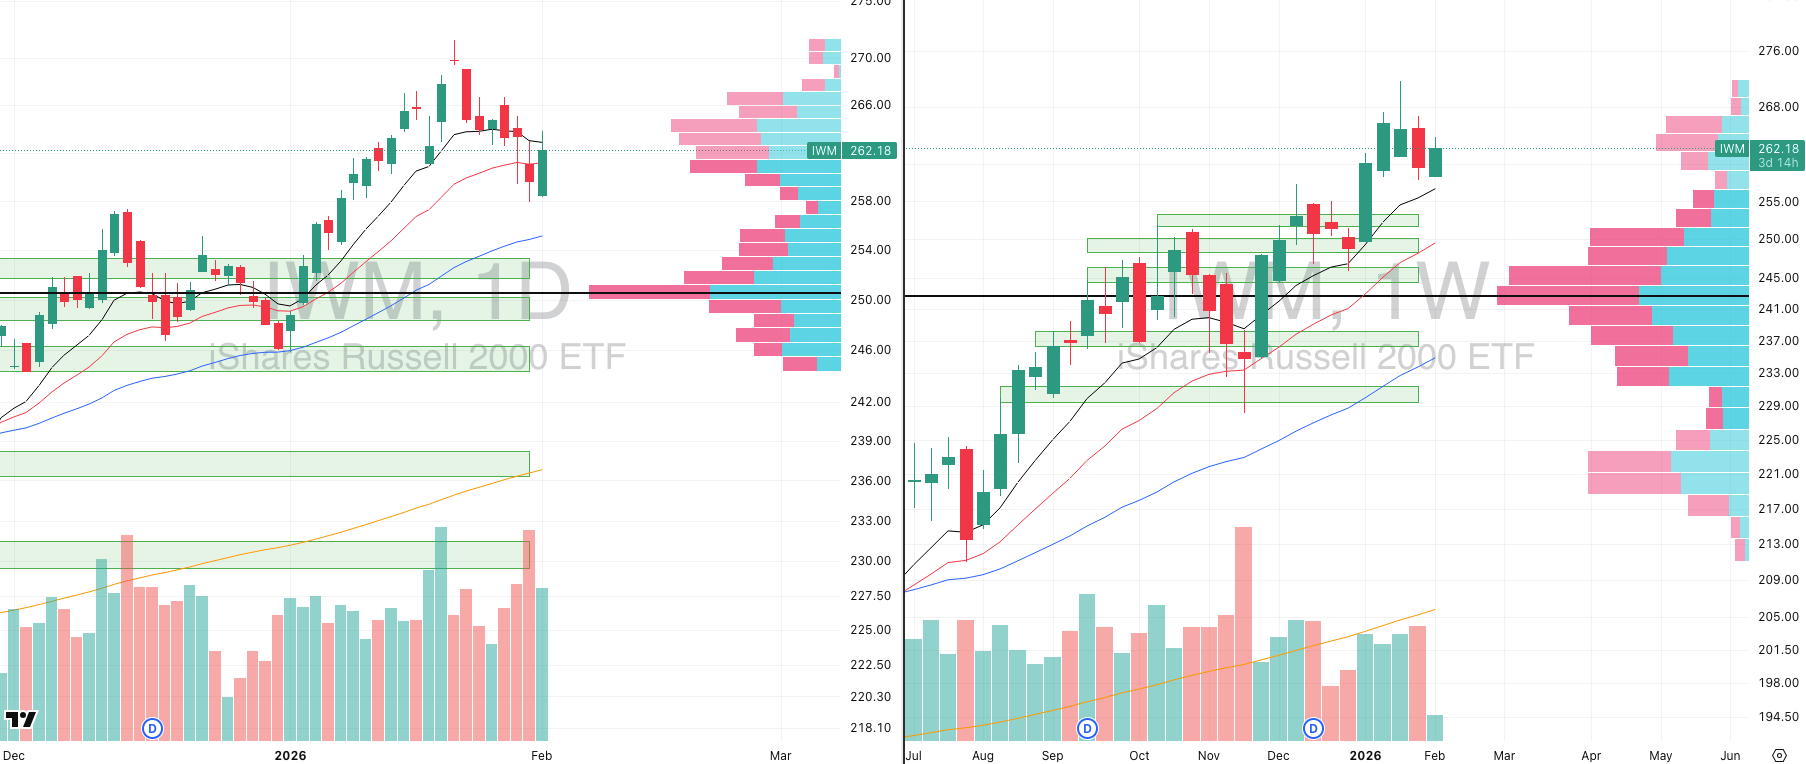
IWM VRVP Daily & Weekly Chart
56.84%: over 20 EMA | 63.24%: over 50 EMA | 65.61%: over 200 EMA
Small-caps are now the strongest capitalisation group, with a relative strength of ~83 versus the S&P 500.
Yesterday’s bounce came on 110% relative volume, confirming genuine demand stepping in at key levels.
Although price rejected the declining 10-day EMA near 264, the more important takeaway is the intact weekly structure.
On the weekly chart, small-caps remain in a confirmed stage-two rally that began after the November Morning Star reversal.
Volume profile data shows aggressive accumulation at recent lows, with roughly 3.4 million shares traded green versus just 1.2 million traded red.
A retest of the rising 10-week moving average near 256.7 would not be surprising and would still be considered constructive.
From a probability standpoint, strength continues to reside in small- and mid-caps, not the NASDAQ.
FOCUSED STOCK
PRIM: Strongest Stock, Strongest Sector
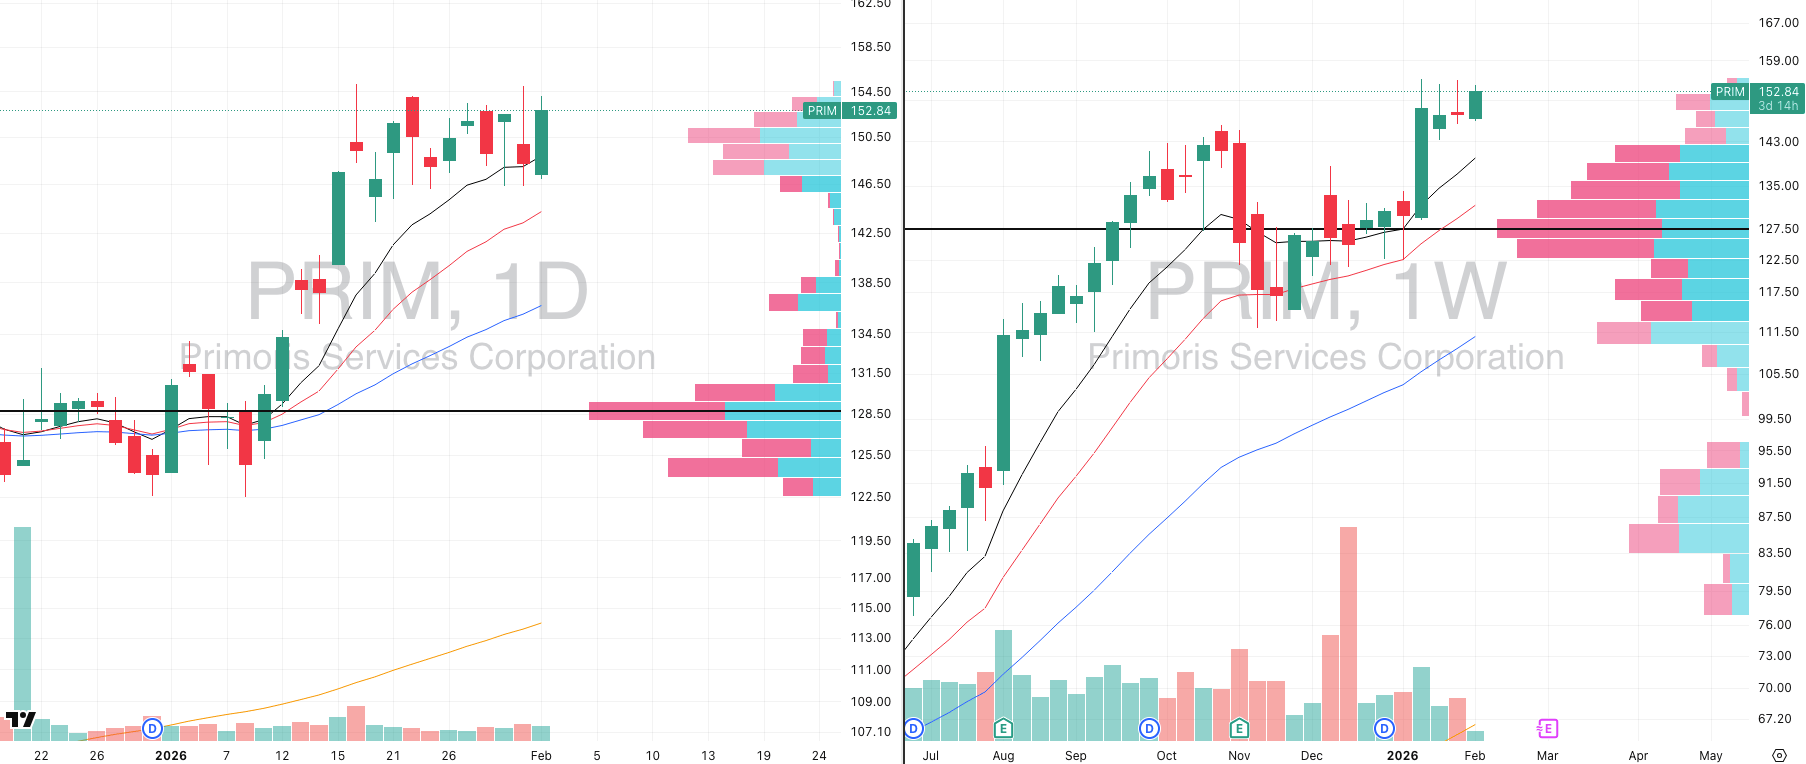
PRIM VRVP Daily & Weekly Chart
ADR%: 4.06% | Off 52-week high: -1.5% | Above 52-week low: +212%
PRIM continues to stand out as a leadership name, with a relative strength rating of 98 versus the S&P 500.
The stock sits within the industrials sector, which remains one of the strongest areas of the market.
PRIM broke above its 10-week moving average in mid-January and has since been contracting in a clean volatility contraction pattern.
Price is holding above the rising 10-day EMA, which keeps the short-term trend constructive.
The company is tightly linked to infrastructure, utilities, energy, and industrial services and all areas are seeing sustained capital inflows.
This is exactly the type of behaviour we want to see in a market with elevated volatility: relative outperformance, tight price action, and clean structure.

Did you find value in today's publication?This helps us better design our content for our readers |
Reply