- Swingly
- Posts
- The Bottom Might Finally Be In
The Bottom Might Finally Be In
OVERVIEW
What You Need To Know
Nasdaq (QQQ & QQQE)
QQQ confirmed the weekly Morning Star reversal by reclaiming the 10/20/50-day EMAs, but still sits under the key descending trendline — meaning the trend is repairing, not repaired.
QQQE showed much stronger demand, printing 326% RVOL off the 20-week EMA, signaling rotation into mid-tier tech and away from crowded megacaps.
S&P 400 Midcap (MDY)
MDY has been the strongest index, surging from $570 → $600 and forming a textbook weekly Morning Star off the 20-week EMA.
But volume has faded on the way up, and the ETF now sits directly at the $598–$600 supply wall — acceptance above this level opens major upside.
Russell 2000 (IWM)
IWM printed one of the cleanest weekly Morning Stars across all indices after a perfect touch of the 20-week EMA at $236.
Price is now hitting the $244–$246 supply shelf on declining volume — meaning the next move depends on whether buyers can force acceptance above this zone.
APP (Focused Stock)
APP delivered a textbook momentum-leader pullback, forming a clean 4-day Morning Star-style reversal directly on the reclaimed 20-week EMA.
The long lower wick on day three confirms real institutional demand, making APP one of the most technically coherent setups in the growth space.
XLC (Focused Group)
Communications is re-synchronizing after weeks of lag, led by GOOG strength and XLC reclaiming all daily EMAs off the $110–111 demand shelf.
Price is now pushing into the $114 supply pocket with rising weekly structure — early signs of a sector-wide trend reset are forming.

MARKET ANALYSIS
A Broad(ish) Market Recovery
U.S. equity futures are firmer again this morning, extending the momentum from yesterday’s move. The rebound saw several major indices printing decisive reclaim candles through short-term moving averages, with early signs of rotation broadening outside large-cap tech.
The tone shift is largely driven by expectations of a December rate cut, which now sit above 80%. Markets continue to respond to the idea that the Fed may be easing sooner rather than later, especially with Kevin Hassett emerging as the frontrunner for Fed chair.
Yesterday’s session showed the most convincing breadth improvement in weeks. Participation across mid-caps and small-caps accelerated sharply, helping produce a series of early reversal patterns across sectors that had been under pressure through most of November.
Tech remains a focal point, but leadership is rotating rather than breaking. Alphabet continues to post fresh highs on strong demand around its AI hardware narrative, while Nvidia’s weakness looks more like capital shifting within the AI complex than a deterioration in the theme itself.
Yesterday’s move carried more authority than anything seen over the past two weeks. The recovery in breadth is the standout development, and while key resistance levels still sit overhead across major indices, the market has begun to establish a more constructive footing which driven less by speculation and more by improving participation.
Nasdaq
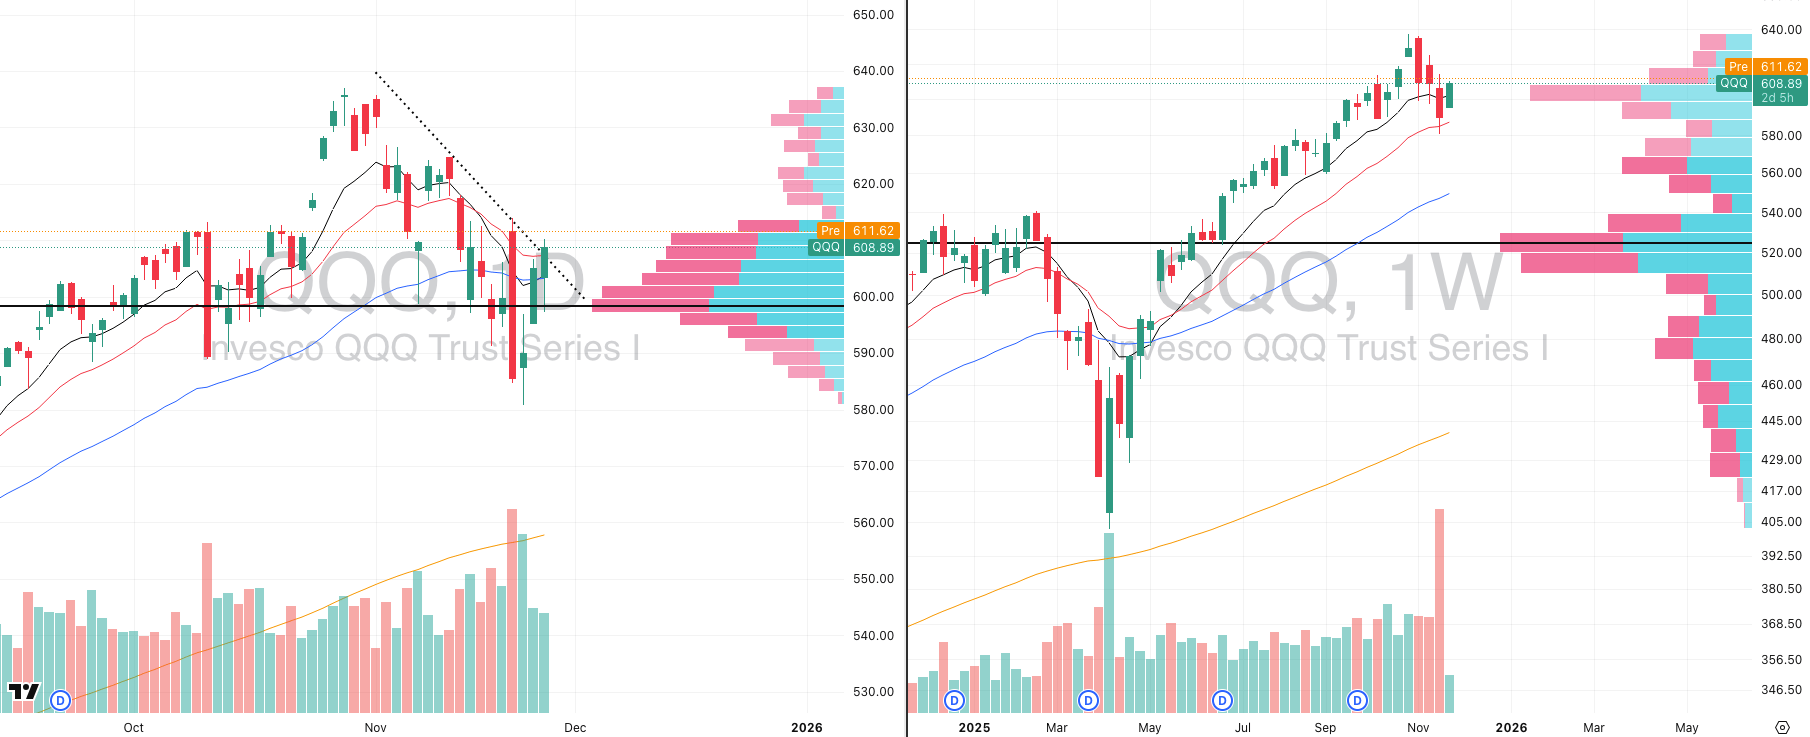
QQQ VRVP Daily & Weekly Chart
% over 20 EMA: 43.56% | % over 50 EMA: 40.59% | % over 200 EMA: 52.47%
The reversal in QQQ was cleaner than it looked in real time, and yesterday’s session confirmed the structure we highlighted going into the week.
Despite only 94% relative volume, the Friday morning star reversal pattern proved valid (more on these in a moment) as the ETF flushed early, undercut support, and then pivoted sharply off the daily POC cluster around $598, where buyers stepped in decisively.
The close back above $608–$610 was very important as this entire band is where the 10, 20, and 50-day EMAs have rolled back into alignment after several weeks of deterioration, and the ETF reclaimed all three in a single session.
This is the first clean higher-low and higher-high sequence QQQ has printed since all November.
The weekly chart shows the QQQ defended the $604 POC, which also aligns with the rising 10-week EMA and holding this area keeps the broader structure in “orderly pullback” territory rather than anything resembling deeper distribution.
The rejection of the descending trendline from the November highs is still present on the daily, but the weekly demand response has taken priority.

QQQE VRVP Daily & Weekly Chart
The QQQE shows far stronger internal demand than QQQ, and yesterday reinforced that gap. Where QQQ pushed only 94% relative volume, QQQE printed an elevated high-volume flush (326%) into the 20-week EMA, absorbed the selling, and pivoted cleanly higher.
On the daily timeframe, QQQE reclaimed its short-term EMAs with conviction and did so while rejecting a structurally significant volume shelf just under $99.
The volume-profile response was not subtle as buyers hit every dip through the low-volume pocket and pushed the ETF back into the $100–$101 resistance band with ease.
This is the part that matters for interpretation: QQQE’s strength signals that money is rotating down the risk curve inside tech, moving away from the narrow megacap trade that dominated the last few months, and when equal-weight tech outperforms cap-weight tech on strong volume, it reflects broadening participation, and also suggests funds are reallocating from crowded megacap names into mid-tier tech where valuations are less stretched and supply-demand dynamics cleaner.
S&P 400 Midcap
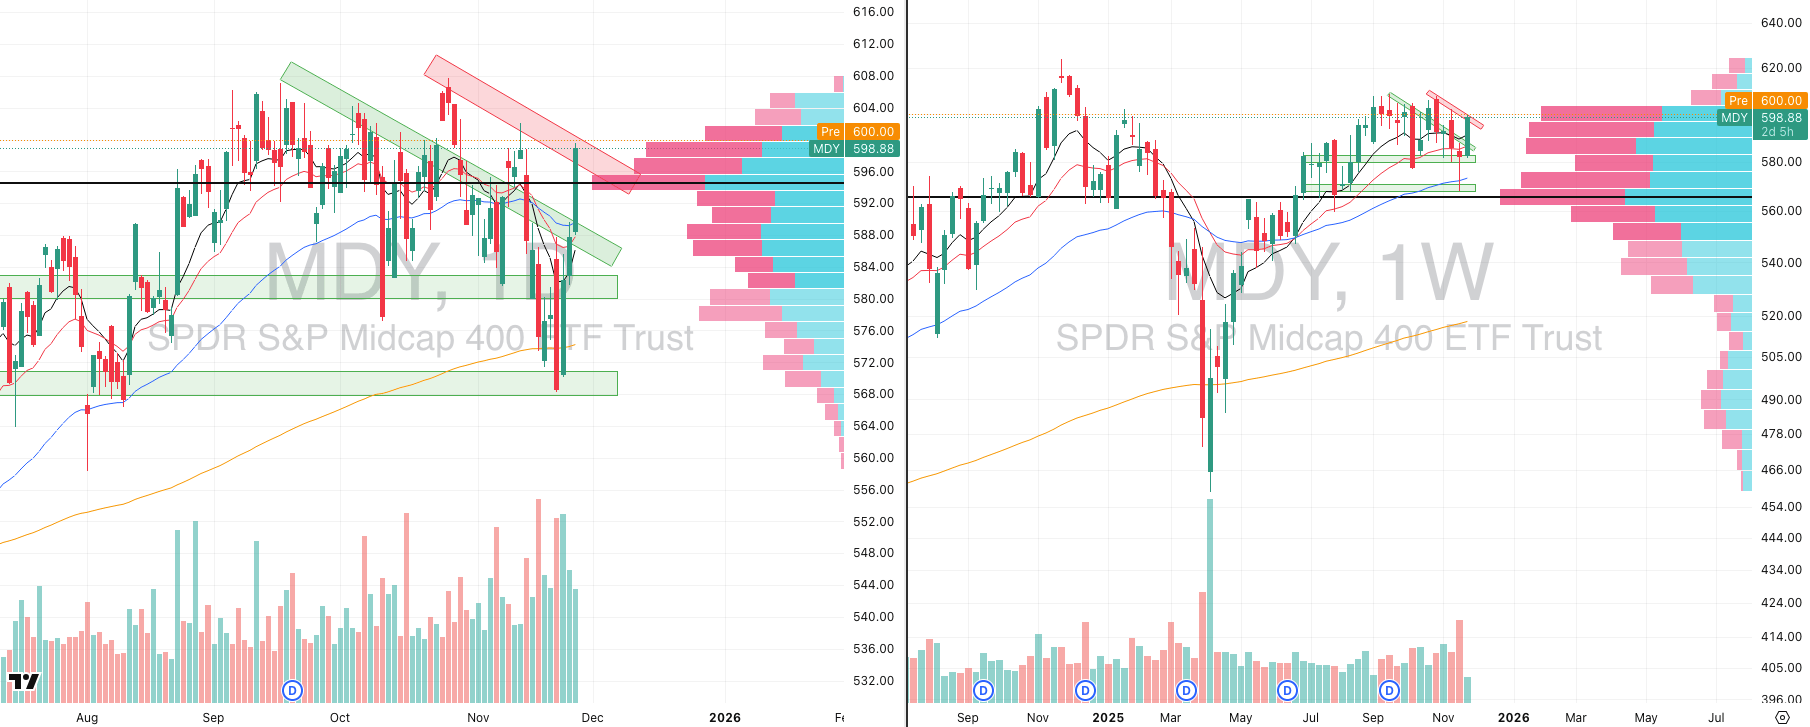
MDY VRVP Daily & Weekly Chart
% over 20 EMA: 70.75% | % over 50 EMA: 52.25% | % over 200 EMA: 56.75%
The rebound in MDY has been materially stronger than what we’ve seen in QQQ or even QQQE as ETF has driven straight into the upper boundary of its main supply cluster at $598–$600, and you can see on the VRVP that liquidity thins sharply above this zone.
This is exactly where a decisive continuation leg could emerge if buyers can force acceptance above $600.
The move from $570 → $600 has been aggressive, but the one blemish is volume as the last three sessions show declining relative volume even as price has accelerated.
That doesn’t invalidate the move, but it does flag that some of the advance hasn’t been supported a surge in real demand. In strong markets, that type of behaviour can persist, but it’s something we track as supply thickens near major resistance.
The weekly chart offers the cleaner read as the MDY is now forming a morning-star reversal off the confluence of the rising 20-week EMA and the mid-autumn demand shelf.
Given the straight-line nature of the last three sessions, we’d be a touch cautious tactically, but structurally this is the strongest resolution we could have asked for from mid-caps.
If MDY can establish acceptance above $600, the volume profile opens materially and the path to trend extension clears very quickly.
Russell 2000
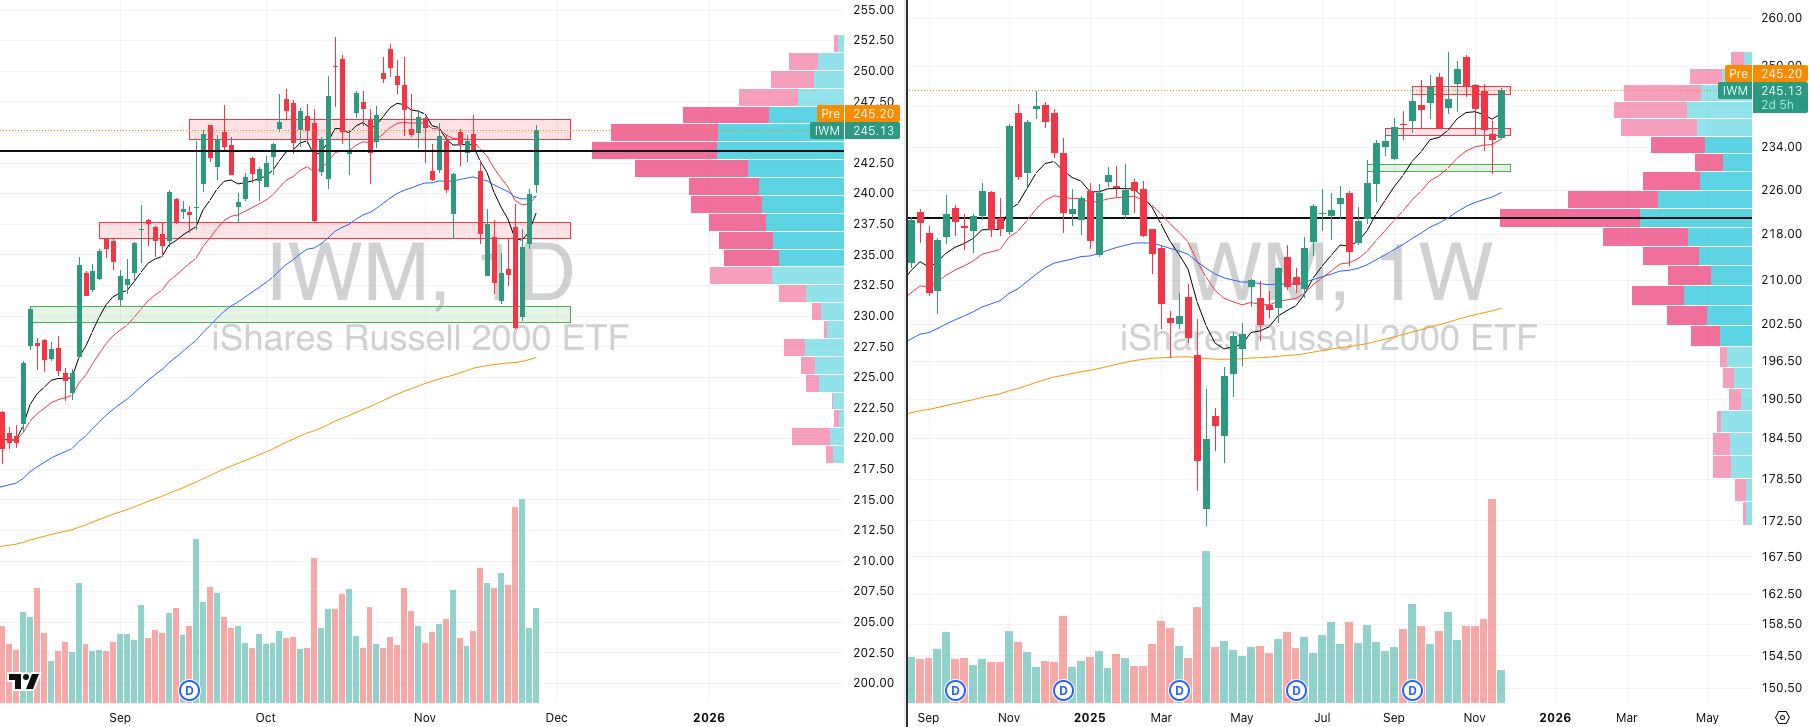
IWM VRVP Daily & Weekly Chart
% over 20 EMA: 65.12% | % over 50 EMA: 52.21% | % over 200 EMA: 58.43%
The Russell 2000 delivered one of the more convincing reversals across the major indices this week, with a clear morning-star formation taking shape on the weekly chart.
The pattern began with Monday’s decisive flush directly into the 20-week EMA at $236—a level that has repeatedly acted as the structural “reset” zone for small-cap momentum during this cycle.
From that touch, IWM staged a broad-based rebound through mid-week, reclaiming short-term moving averages and unwinding the heavy oversold conditions that had accumulated over the prior two weeks.
Price is now pushing directly into the $244–$246 supply band, where the VRVP shows a clear shelf of prior rejection. This is where resistance should be expected to re-emerge (and we again highlight the declining volume on this push).
The Morning Star Pattern Across the Indices
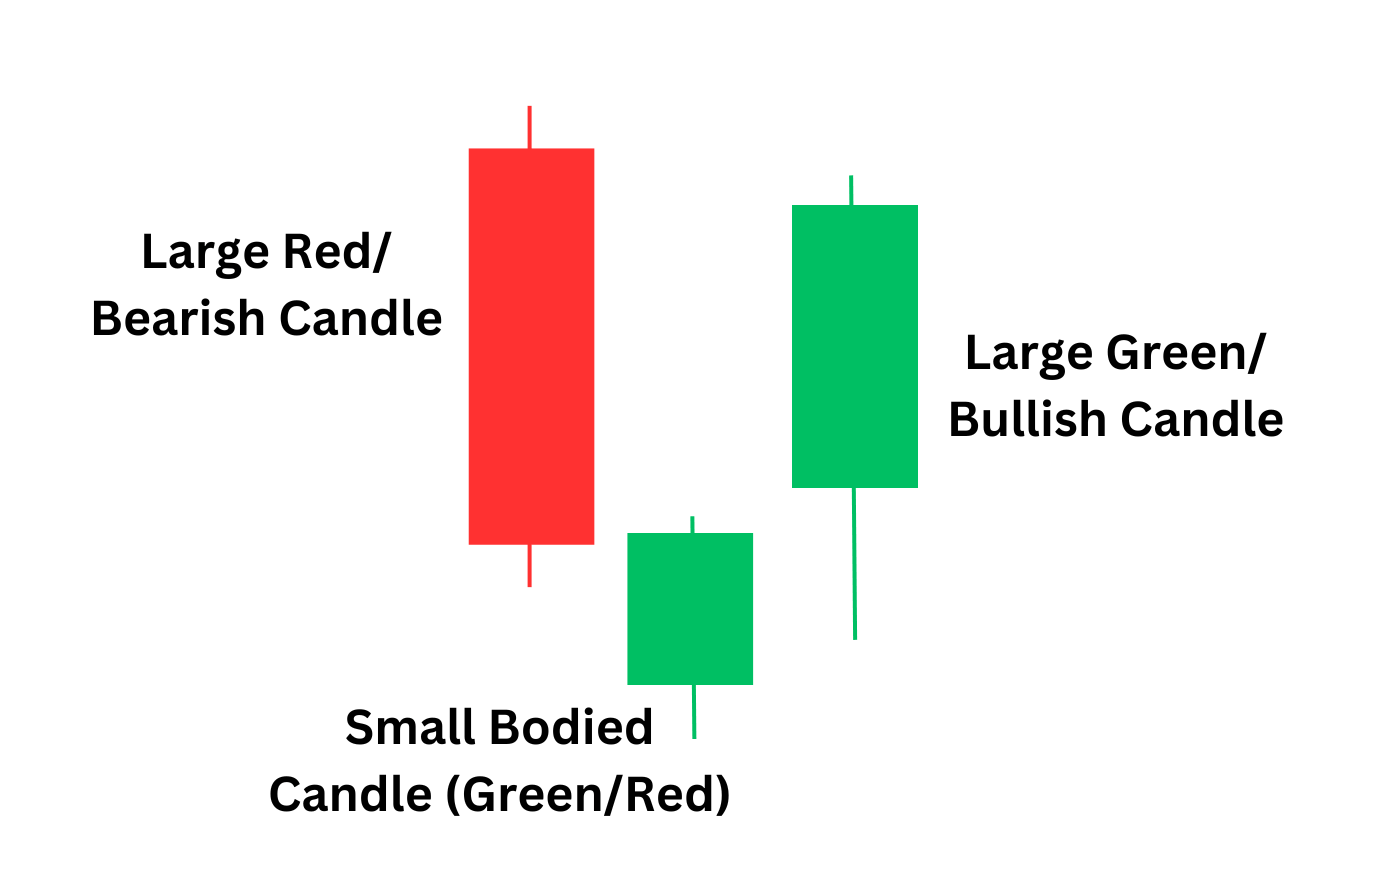
Morning Star Formation
All three index groups, the Nasdaq (QQQ/QQQE), Midcaps (MDY), and Russell 2000 (IWM) are currently printing variations of the morning star formation on their weekly charts.
This is a statistically reliable bullish reversal structure, occurring after a downward retracement within a longer-term uptrend. It consists of:
A decisive down candle
A small-bodied “indecision” candle that stabilizes price
A strong upside continuation candle that recovers at least half of the first candle’s range
This pattern resolves to the upside 78% of the time, and its performance improves when it appears:
Near rising long-term moving averages
During a pullback within an established uptrend
In indices where breadth is expanding (as it is now in mid- and small-caps)
The fact that this pattern is emerging simultaneously across all major U.S. equity groups, and doing so off well-defined support (20-week EMAs, POCs, and volume shelves) is a very constructive signal for the intermediate trend.
It doesn't guarantee follow-through, particularly given the overhead supply zones we’ve identified, but it does confirm that buyers have meaningfully absorbed the early-November selloff and are attempting to regain control of the tape.
3 Tricks Billionaires Use to Help Protect Wealth Through Shaky Markets

“If I hear bad news about the stock market one more time, I’m gonna be sick.”
We get it. Investors are rattled, costs keep rising, and the world keeps getting weirder.
So, who’s better at handling their money than the uber-rich?
Have 3 long-term investing tips UBS (Swiss bank) shared for shaky times:
Hold extra cash for expenses and buying cheap if markets fall.
Diversify outside stocks (Gold, real estate, etc.).
Hold a slice of wealth in alternatives that tend not to move with equities.
The catch? Most alternatives aren’t open to everyday investors
That’s why Masterworks exists: 70,000+ members invest in shares of something that’s appreciated more overall than the S&P 500 over 30 years without moving in lockstep with it.*
Contemporary and post war art by legends like Banksy, Basquiat, and more.
Sounds crazy, but it’s real. One way to help reclaim control this week:
*Past performance is not indicative of future returns. Investing involves risk. Reg A disclosures: masterworks.com/cd
FOCUSED STOCK
APP: Leader Showing a Perfect Pullback
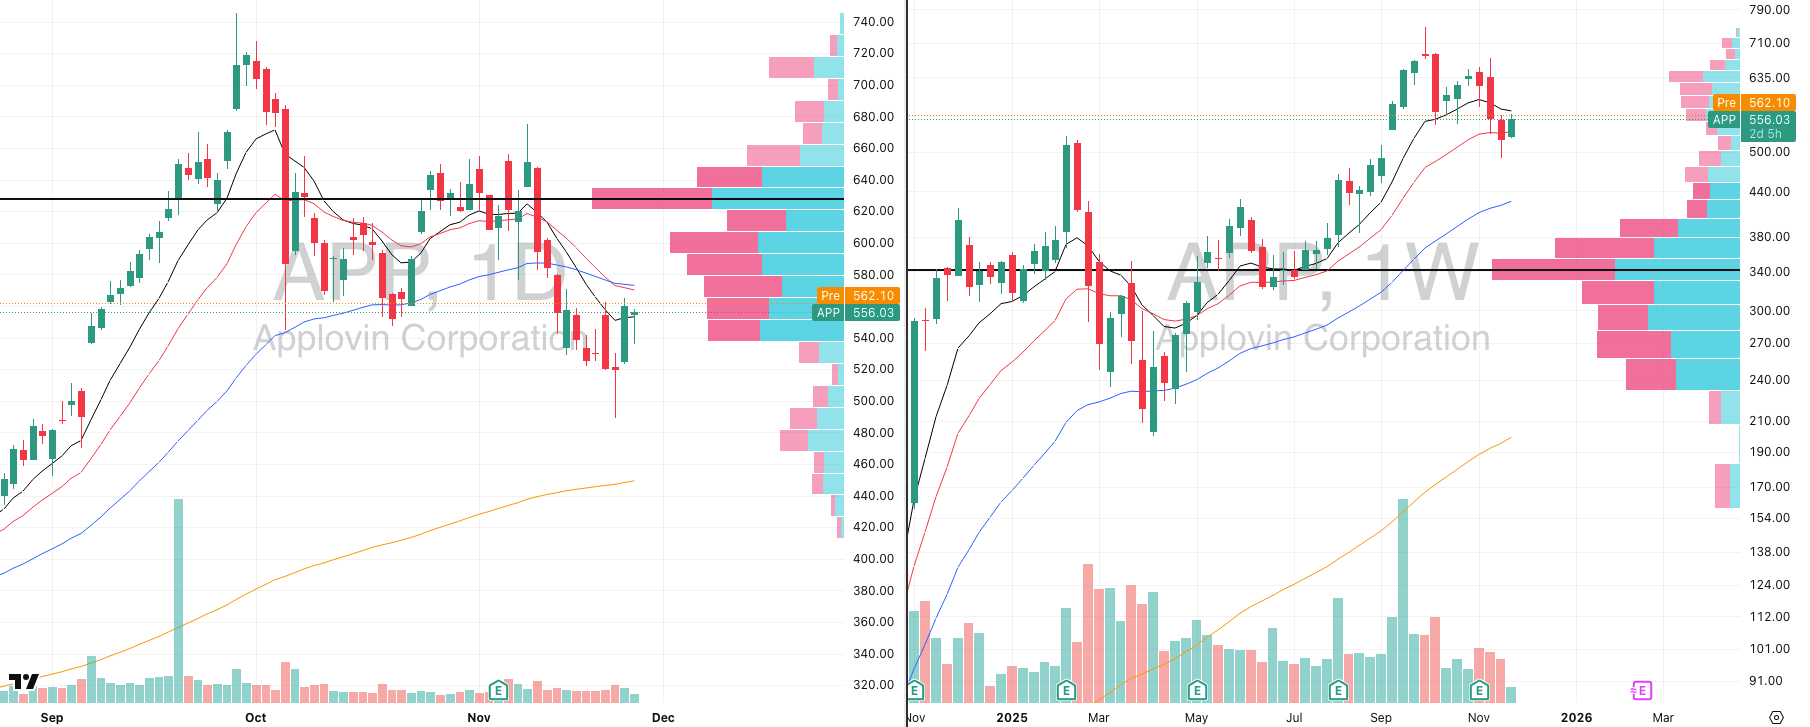
APP VRVP Daily & Weekly Chart
ADR%: 6.09% | Off 52-week high: -25.4% | Above 52-week low: +177.3%
APP continues to behave exactly as a prior-cycle momentum leader should during a period of market stress: controlled retracement, orderly structure, and buyers stepping in at the correct levels.
Over the past four sessions, the stock has carved out a clear morning-star-style reversal sequence, with each candle contributing to a stabilizing base:
A sharp red expansion bar as profit-taking accelerated
A small-bodied stabilization candle
A green hammer that absorbed intraday selling and defended the reclaimed 20-week EMA
A follow-through candle confirming demand
That hammer on day three is the key tell as APP attempted to break under the 20-week EMA intraday which is a level many pullback traders use as a structural momentum line, and was immediately bought back above it, leaving a long lower wick that communicates real demand from longer-term participants.
With the broader market showing synchronized morning-star reversals across major indices, APP’s behavior stands out as one of the more technically coherent setups in the growth/momentum space.
FOCUSED GROUP
XLC: Communications Ready To Rally
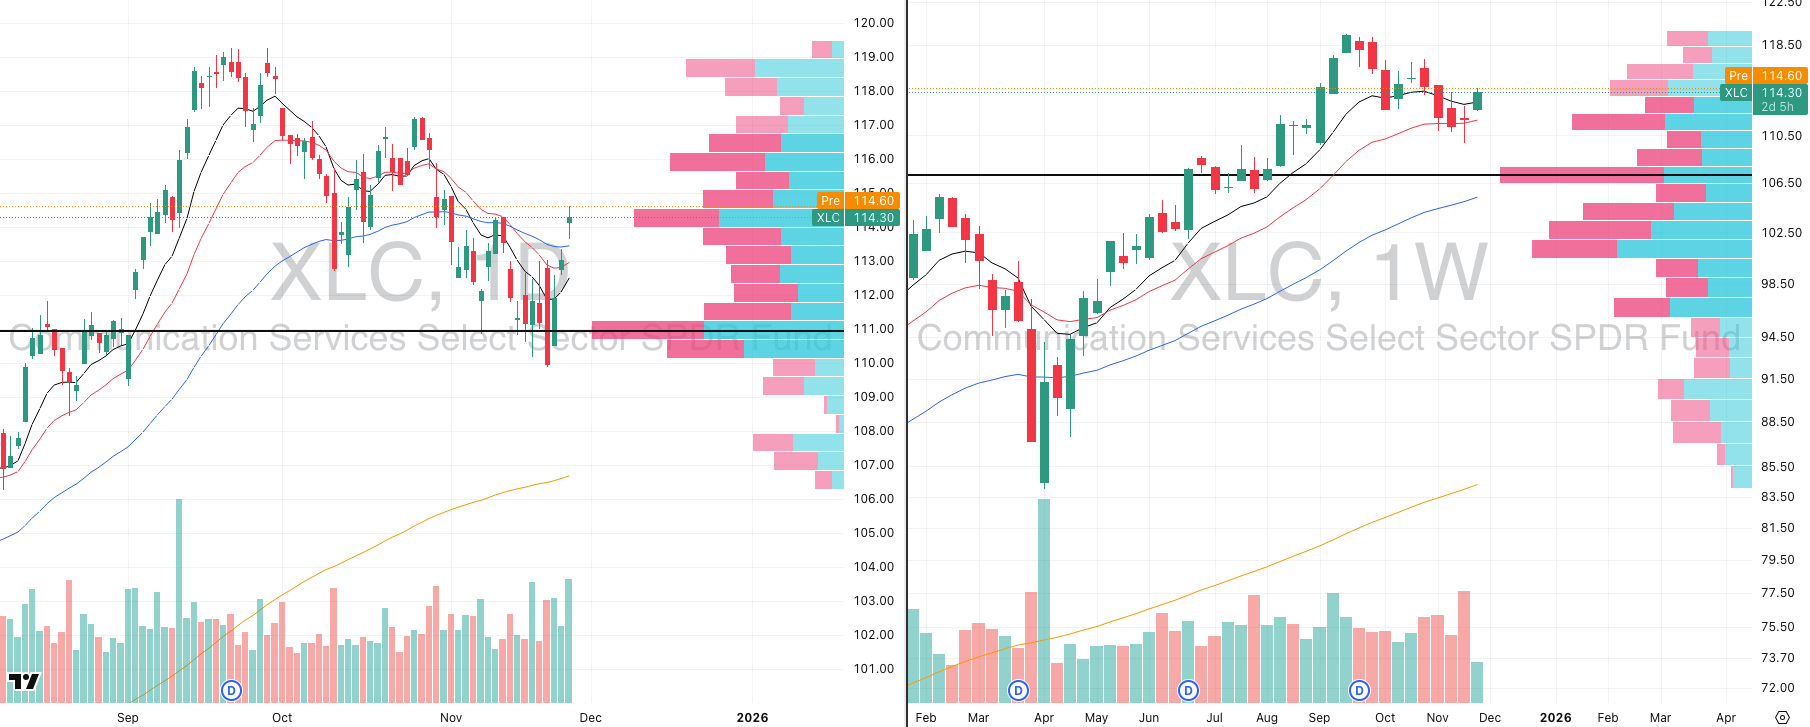
XLC VRVP Daily & Weekly Chart
The entire comms complex is starting to re-synchronize after weeks of sloppy action — led by GOOG and now broadening out.
XLC saw a strong rebound off the $110-111 demand shelf, which has now put in two consecutive higher lows.
Yesterday’s push was clean with GOOG + RDDT strength pulled the whole sector up, and XLC reclaimed all three daily EMAs (META is dragging it down a little).
Price is now pressing back into the $114 supply pocket, but the structure underneath is improving as the rising 20 & 50 EMAs are beginning to flatten and turn.
Weekly chart shows the same story as buyers defended the 20-week EMA perfectly, creating the early stages of a weekly reversal candle.
Did you find value in today's publication?This helps us better design our content for our readers |
Reply