- Swingly
- Posts
- 🟢 The Best Case Scenario Just Hit the Market
🟢 The Best Case Scenario Just Hit the Market
OVERVIEW
This Rally Just Got Real
Macro: Shutdown = noise. Bigger story is Fed cuts priced in + AI euphoria fueling tech.
Nasdaq: QQQ hit ATHs at POC with QQQE confirming breadth → this is still the leading group.
Midcaps (MDY): Flagging off 50-EMA, aiming for $606 test. Watch behavior at supply zone.
Small Caps (IWM): Clear VCP above $240 POC, likely push toward $245 highs. Stronger than MDY.
Focused Stock (AMD): Stage 2 breakout structure intact. Gap-up risky; watch gap-fill or 5-min breakout.
Focused Group (QTUM): ETF broke out on 234% rel volume. Leaders QBTS, IONQ, RGTI all in tight VCPs → higher prices likely.

MARKET ANALYSIS
Bulls Stood Their Ground
U.S. stocks keep grinding higher even as Washington slips into shutdown mode.
History tells us shutdowns rarely derail markets, and so far this one is no exception: S&P 500 closed at fresh record highs yesterday while Nasdaq continues to lead- as it always does.
The immediate challenge isn’t the politics, it’s the data blackout.
With the Bureau of Labor Statistics shut, we won’t get the September payrolls report on Friday. That means the Fed will be forced to make its October 29th decision with less visibility.
Markets are already leaning heavily toward cuts. Wednesday’s weak ADP jobs data reinforced the case, and futures are pricing in three cuts this year. That’s fuel for risk assets and especially growth and tech, where flows are most sensitive to Fed expectations.
At the same time, AI continues to dominate the macro narrative. OpenAI’s secondary sale vaulted its valuation to $500B, making it the most valuable startup globally.
That euphoria spilled into chipmakers like SK Hynix and supported U.S. semis, keeping tech momentum alive.
👉 Practical takeaway: Macro noise is less important right now than two things:
Breadth expansion- whether strength continues to spill beyond mega-cap tech.
The Fed’s October meeting- the market is betting on cuts, and every data delay only increases that focus.
Nasdaq
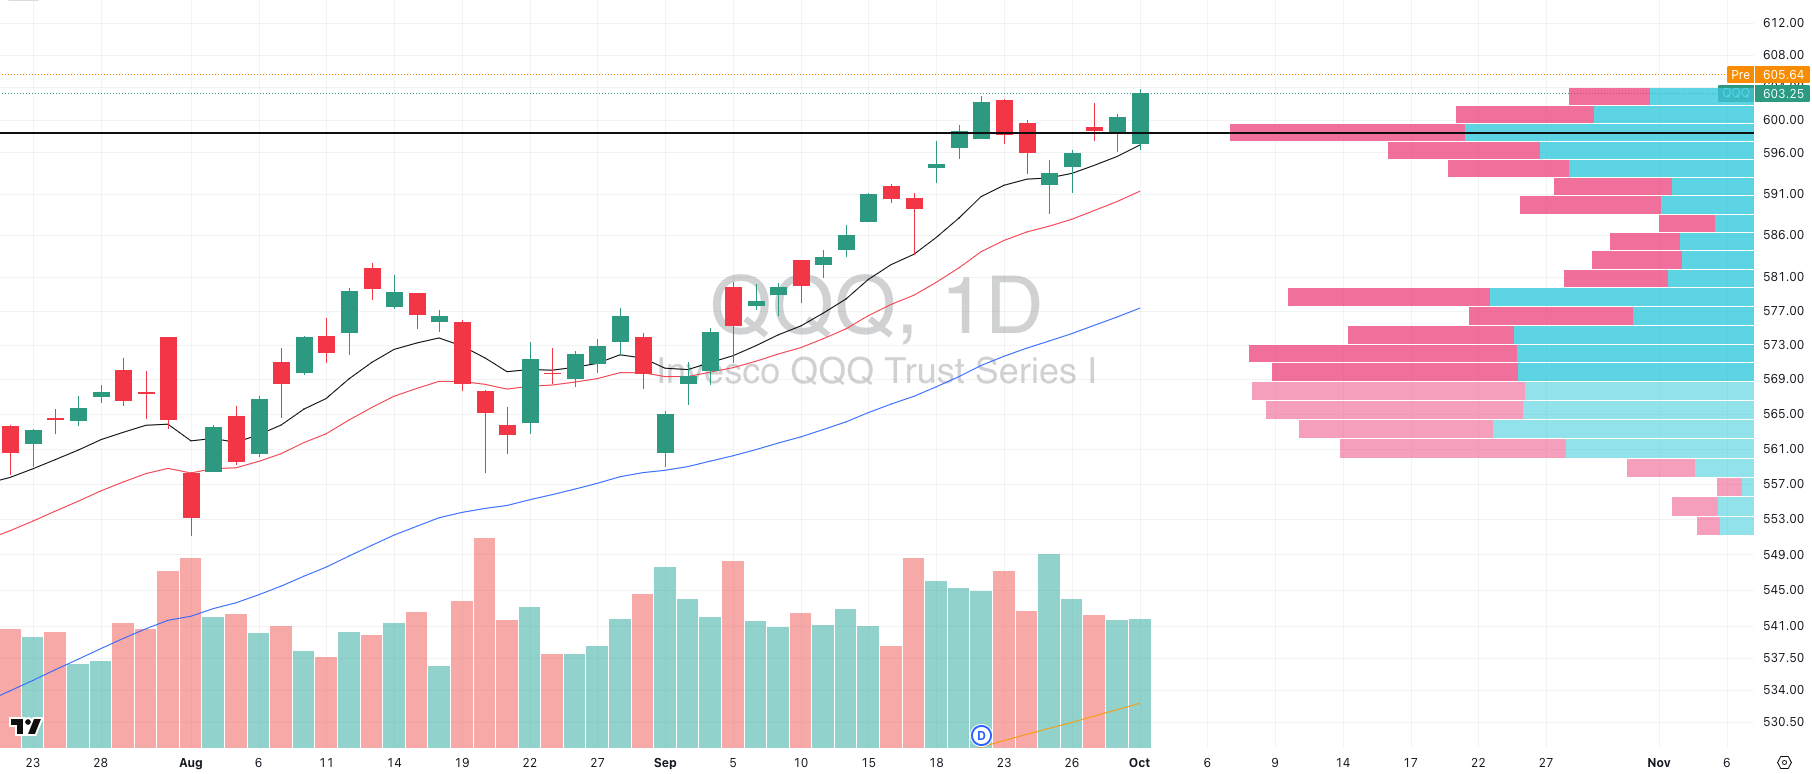
QQQ VRVP Daily Chart
% over 20 EMA: 57.42% | % over 50 EMA: 51.48% | % over 200 EMA: 59.40%
We got exactly what we outlined yesterday: the bulls needed QQQ to push through and take out all-time highs and hold right on its Point of Control (POC).
On the open, demand stepped in instantly at the daily 10-EMA. Leaders across the group surged in unison demonstrating clear signs of institutional buy programs hitting the tape.
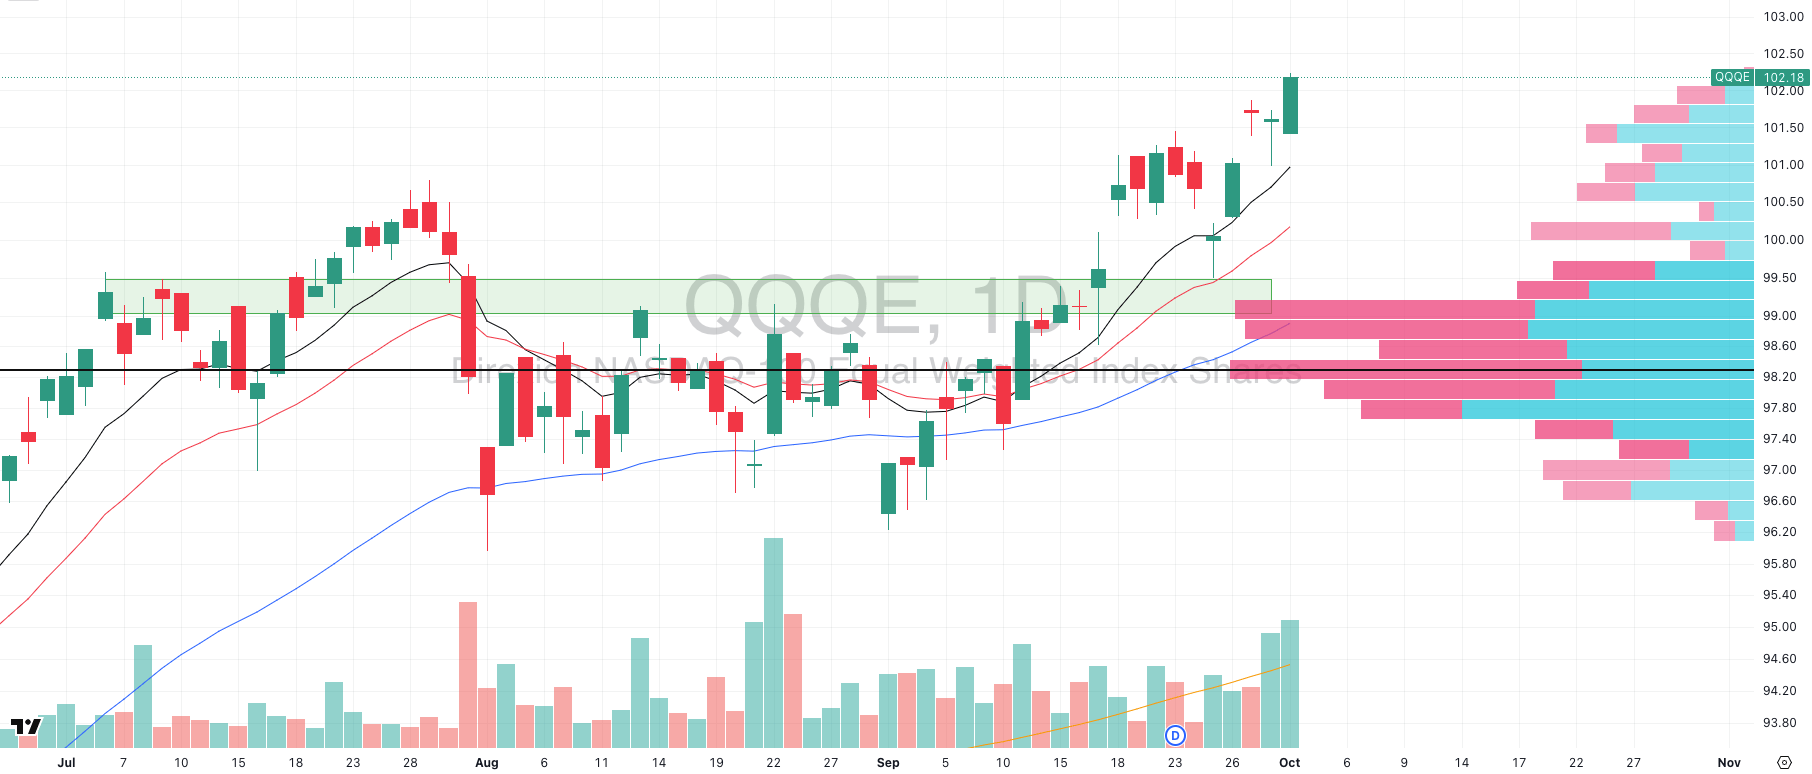
QQQE VRVP Daily Chart
What excites us most is QQQE (equal-weight Nasdaq). Yesterday we flagged our concern that it might gap down at the open. Instead, it reversed immediately and rallied on very high relative volume.
That matters because QQQ can make new highs with just a few mega-cap leaders dragging the index up. QQQE strips that out. When QQQE and QQQ push in tandem, on volume, breadth is confirmed.
It means this isn’t just the NVDA–MSFT–AAPL show; it’s the broader Nasdaq complex catching a bid.
👉 Takeaway: The Nasdaq remains the leading group in the market. This is where you want to prioritize exposure.
When leadership, demand, and breadth all align, probabilities favor continuation. The healthiest setups right now are still coming out of the Nasdaq complex.
S&P 400 Midcap
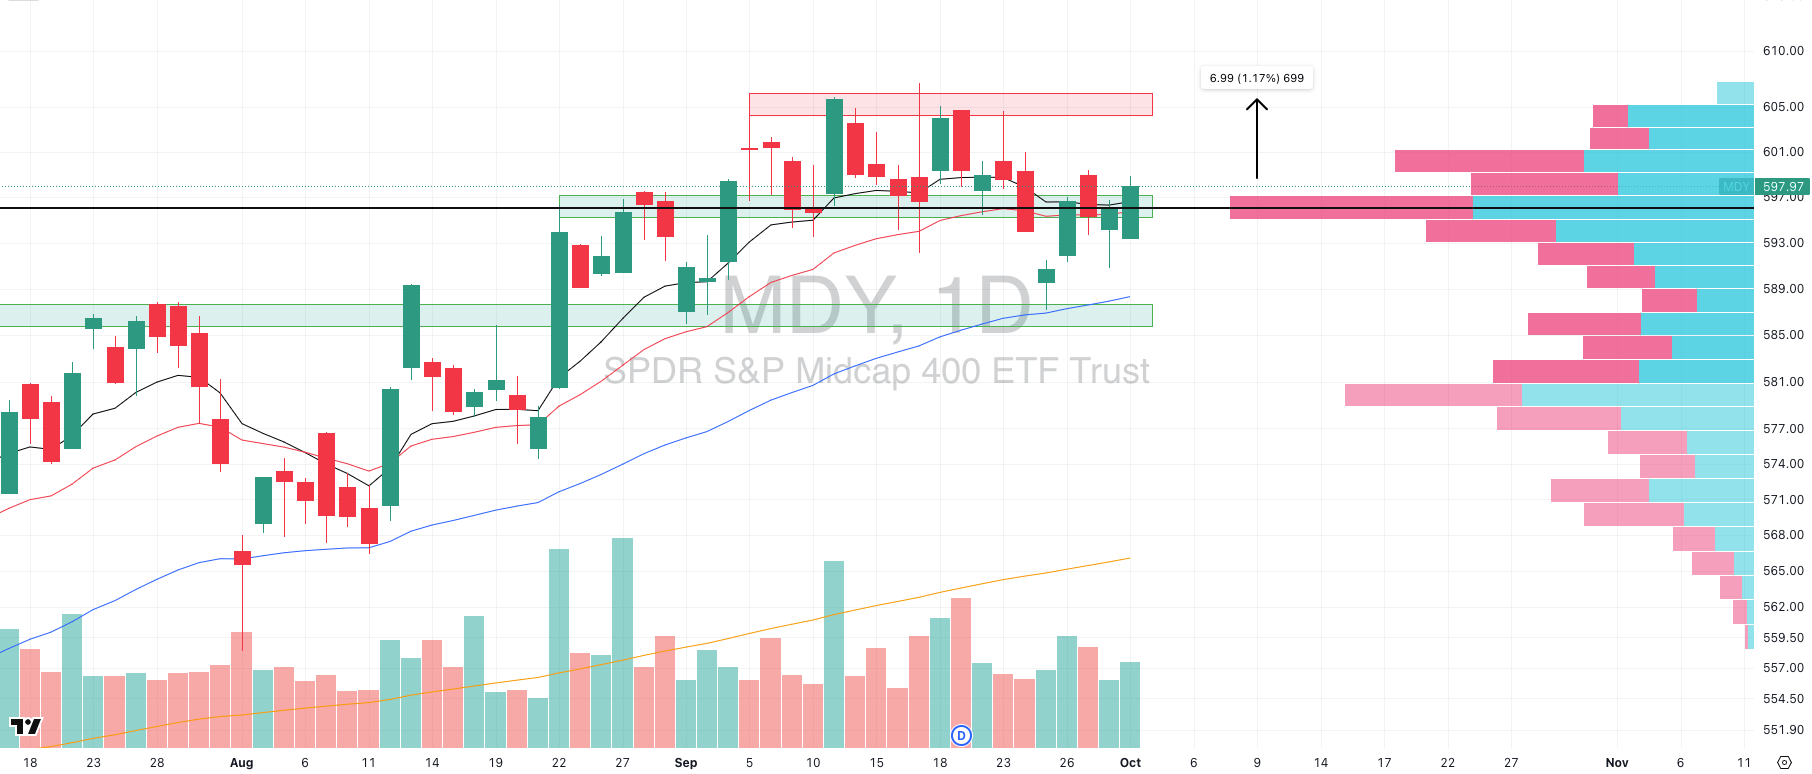
MDY VRVP Daily Chart
% over 20 EMA: 41.14% | % over 50 EMA: 50.87% | % over 200 EMA: 62.09%
MDY is setting up a measured move of roughly +1.2% into its next key supply zone around $606, and that move looks increasingly likely.
Here’s the structure:
Five sessions ago, MDY bounced cleanly off its 50-EMA and began flagging.
Yesterday it opened strong, pushed over its Point of Control (POC), and closed above the demand level at $595.
The lag behind QQQ is clear as the Nasdaq has already broken to fresh highs, while MDY is still pressing into its zone. But structurally, midcaps tend to follow the Nasdaq higher, and that’s exactly what looks to be happening here.
👉 What to watch today isn’t whether we rally the extra 1.2%. That’s almost secondary. The real focus is how MDY behaves once it pushes into the $606 supply zone and overlapping POC area.
If price consolidates and tightens there instead of rejecting, that’s a very healthy signal of acceptance.
Russell 2000
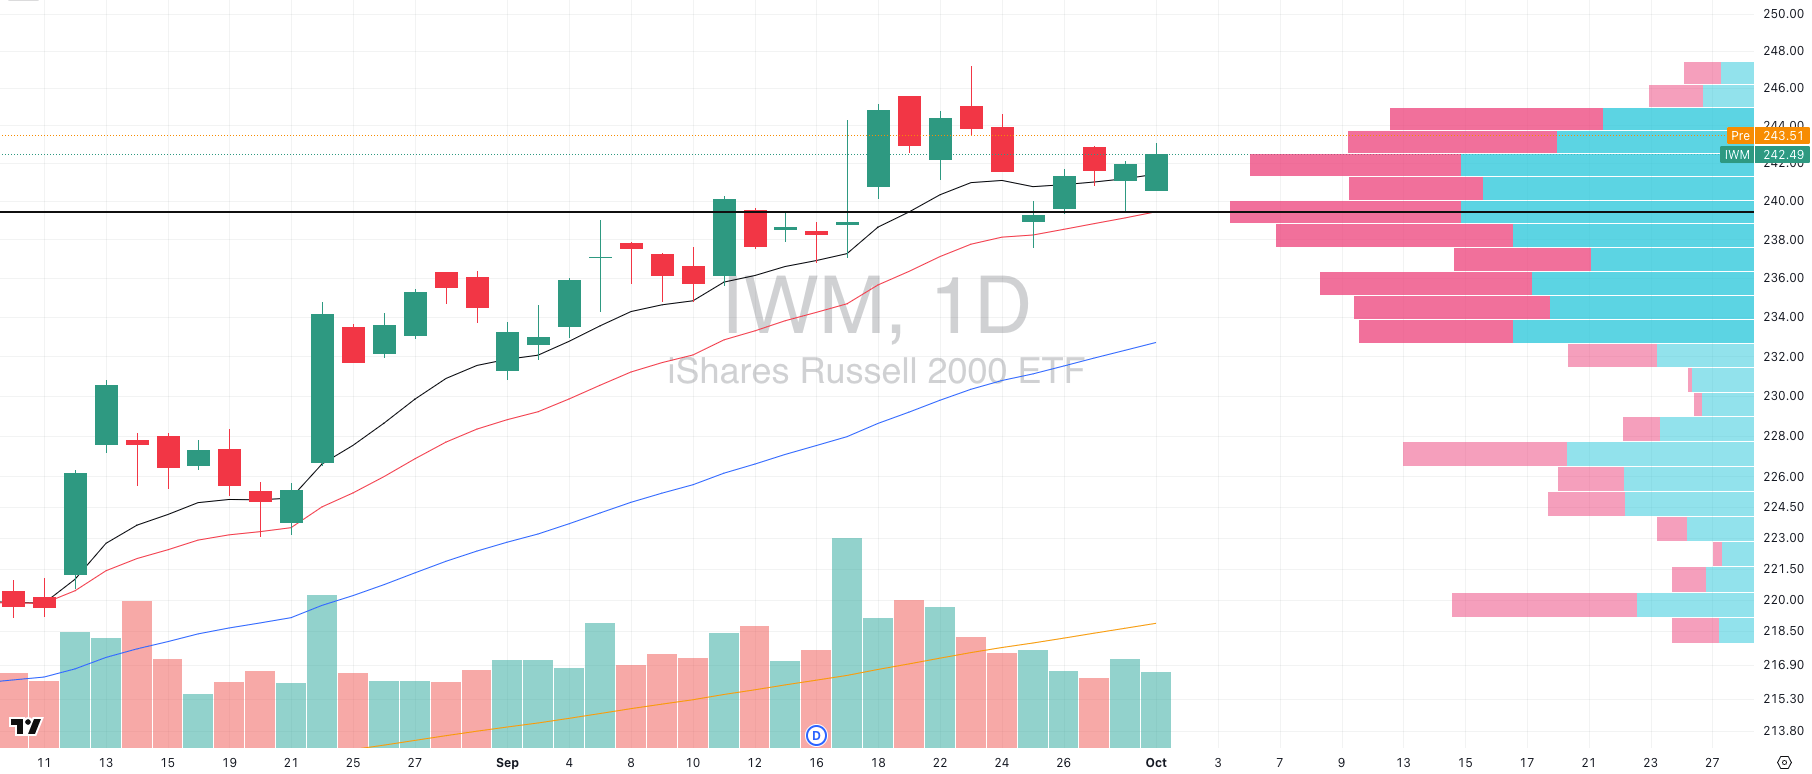
IWM VRVP Daily Chart
% over 20 EMA: 41.17% | % over 50 EMA: 53.32% | % over 200 EMA: 59.17%
Small caps continue to show more strength than midcaps, with a much cleaner structure. Over the last three weeks, IWM has built a clear volatility contraction pattern (VCP):
Price has made higher lows while repeatedly testing and holding the rising daily 20-EMA
Volume has contracted alongside price, confirming the tightening action
IWM is holding firmly above its Point of Control (POC) at $240
This is constructive, quiet accumulation. Unlike MDY, which is still wrestling with supply overhead, small caps look tighter and less noisy.
👉 Our expectation: IWM is well-positioned to make a run toward recent highs around $245, potentially as early as today.
Please remember that Index analysis gives us the roadmap, but it’s never enough on its own.
You can’t avoid screen time and you can’t avoid running scans inside each group to see where the true leadership is setting up.
🧠 Mindset Check: A Stop Out ≠ Set-Up Is Invalid
Traders love to make this mistake, they get stopped out and immediately decide the setup was never valid. That thinking kills more accounts than bad analysis.
Remember, you’re not trading a stock. You’re trading your system.
Most traders forget that. They take a stop-out on AMD, IONQ, or NVDA and immediately think “this trade was wrong.”
But in reality, a single outcome means nothing. The system is the edge, not the stock, not the pattern, not one trade.
This is why stops are so important. A stop is not a verdict. It is a risk unit that keeps you alive long enough to let the law of large numbers play out.
Think of it like this:
If you risk 0.5% of equity per trade, three scratches in a row cost you only 1.5%.
Your next winner, if it runs 15–20%, pays back 3–5x that risk.
That’s asymmetry. That’s the whole game.
You’re not betting on whether this breakout works. You’re betting that over the next 50 breakouts, your system’s probability edge will show up.
Stops are probability filters, not verdicts. A stop is the cost of admission to see if your edge plays out. Nothing more. If you mistake it for a signal of invalidity, you’ll abandon edges before they can pay.
Every valid setup contains variance. Even the highest-quality patterns e.g. VCPs, Stage 2 breakouts, or pullback longs, will fail a percentage of the time. That’s the statistical cost of operating in uncertainty.
The win rate myth kills more traders than bad analysis. You don’t need 70% accuracy to compound capital. Some of the best systems run at 35–45% win rates, because risk control and asymmetric payoffs are the real edge.
FOCUSED STOCK
AMD: A Fresh Stage 2 Rally
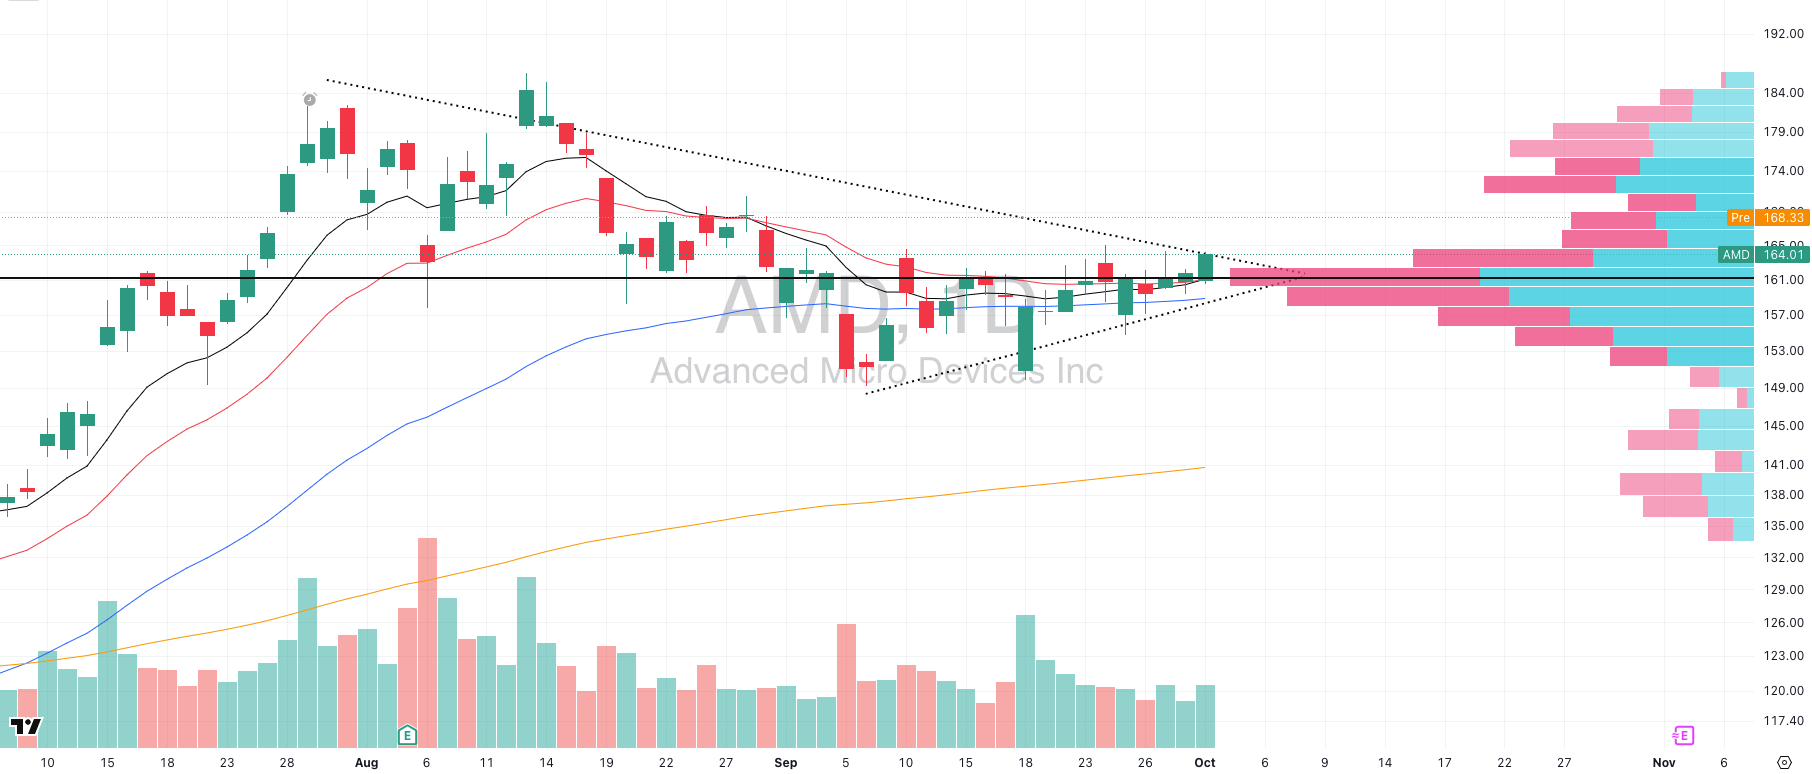
AMD VRVP Daily Chart
ADR%: 3.27% | Off 52-week high: -12.1% | Above 52-week low: +114.4%
AMD is breaking out of a multi-month Stage 2 base, and while it’s lagged some of the hotter semiconductor names (like MU), you simply can’t ignore this kind of structure: higher lows, volume drying up, and a clean push above its Point of Control (POC).
Here’s the key technical read:
Yesterday’s entry: The best long trigger actually came on the bounce and hold over POC intraday, confirming accumulation.
Advanced entry (Sept 18): A pullback long was available around $154, where AMD posted a high-volume reversal. That was the kind of setup only advanced traders catch as you’re buying strength off a volume-backed shakeout and on weakness.
Today’s setup: AMD gapped higher this morning. Chasing the open here carries risk. Safer tactical plays:
Watch for a 5-min opening range breakout. Just know that these can see high stop-out rates.
If price fails and fills the gap, that could present a much cleaner pullback long and often the higher-probability setup when dealing with gap opens.
👉 Big picture: Even if AMD is a relative laggard within semis, the technical base structure is undeniable. A multi-month Stage 2 breakout paired with low-volume pullbacks is the kind of setup institutions pile into and set the stage for multi month rallies.
FOCUSED GROUP
QTUM: The Second Wave Higher Is Coming
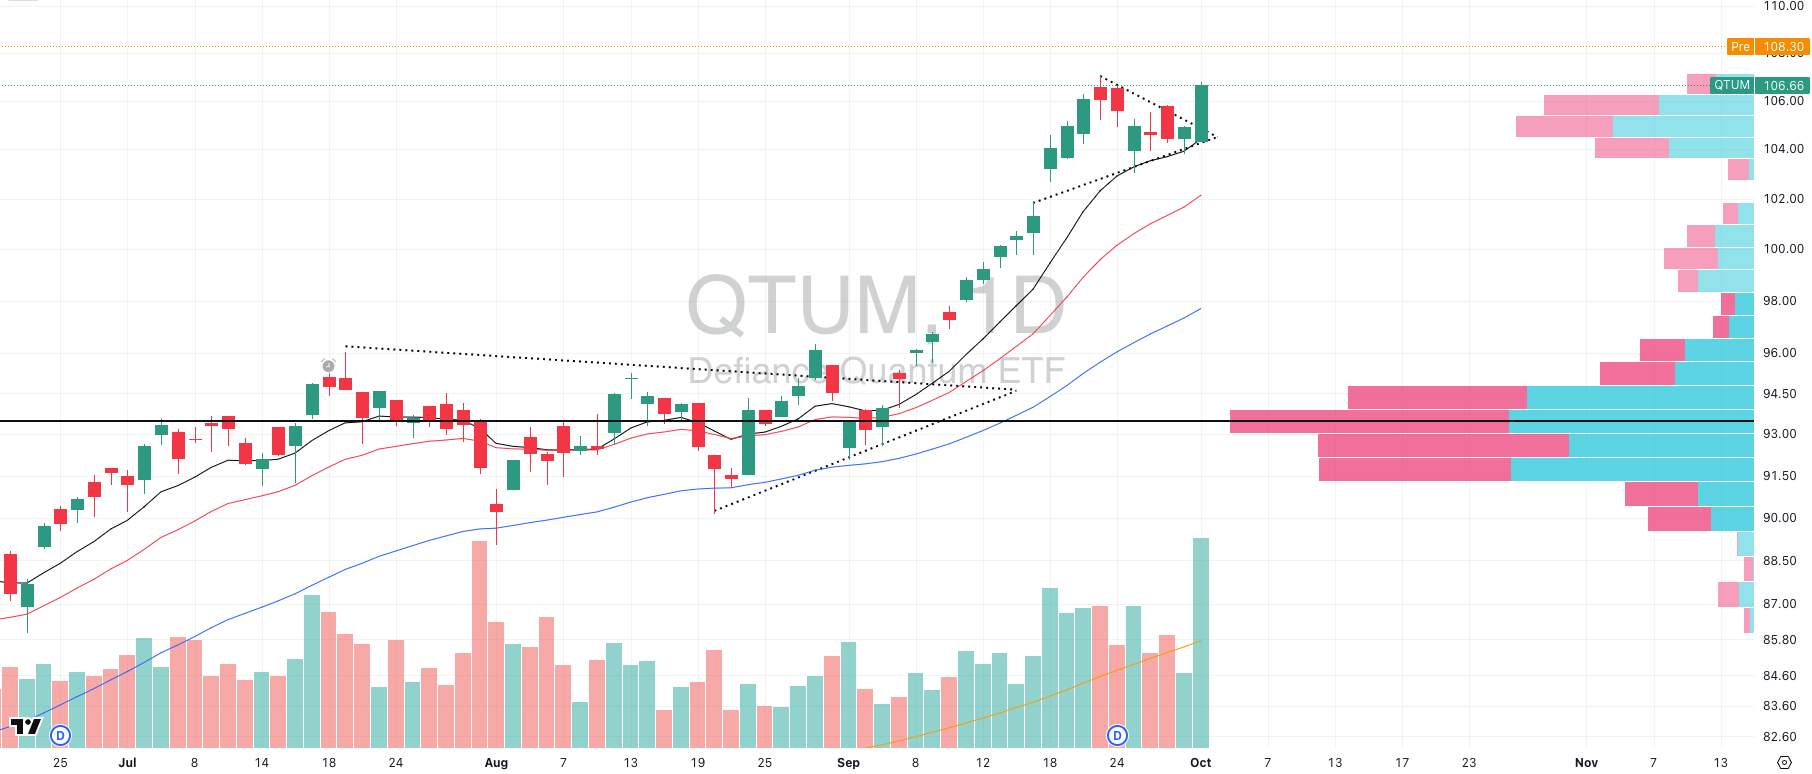
QTUM VRVP Daily Chart
Yesterday, QTUM ETF ripped higher on 234% of its 20-day relative volume, an explosive breakout that immediately caught our attention.
Here’s the irony: QTUM isn’t actually a pure play on quantum computing. Its heaviest weight is NVIDIA- hardly a “quantum” stock- but nevertheless, the ETF still serves as a useful proxy for this emerging growth group.
The leading individual quantum names being QBTS, IONQ, and RGTI, all look nearly identical:
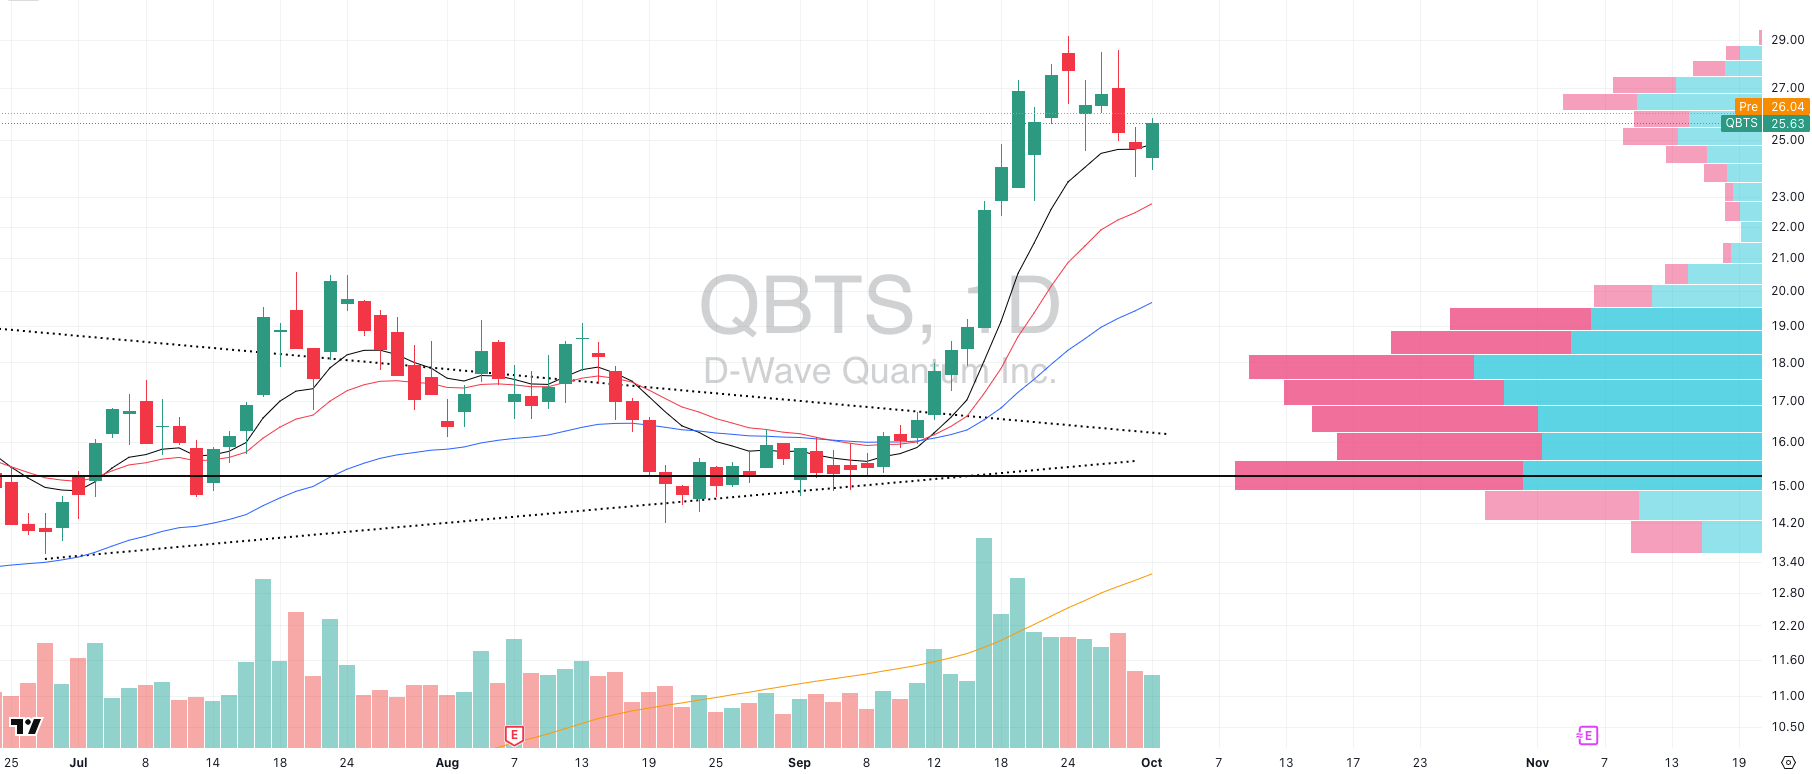
QBTS VRVP Daily Chart
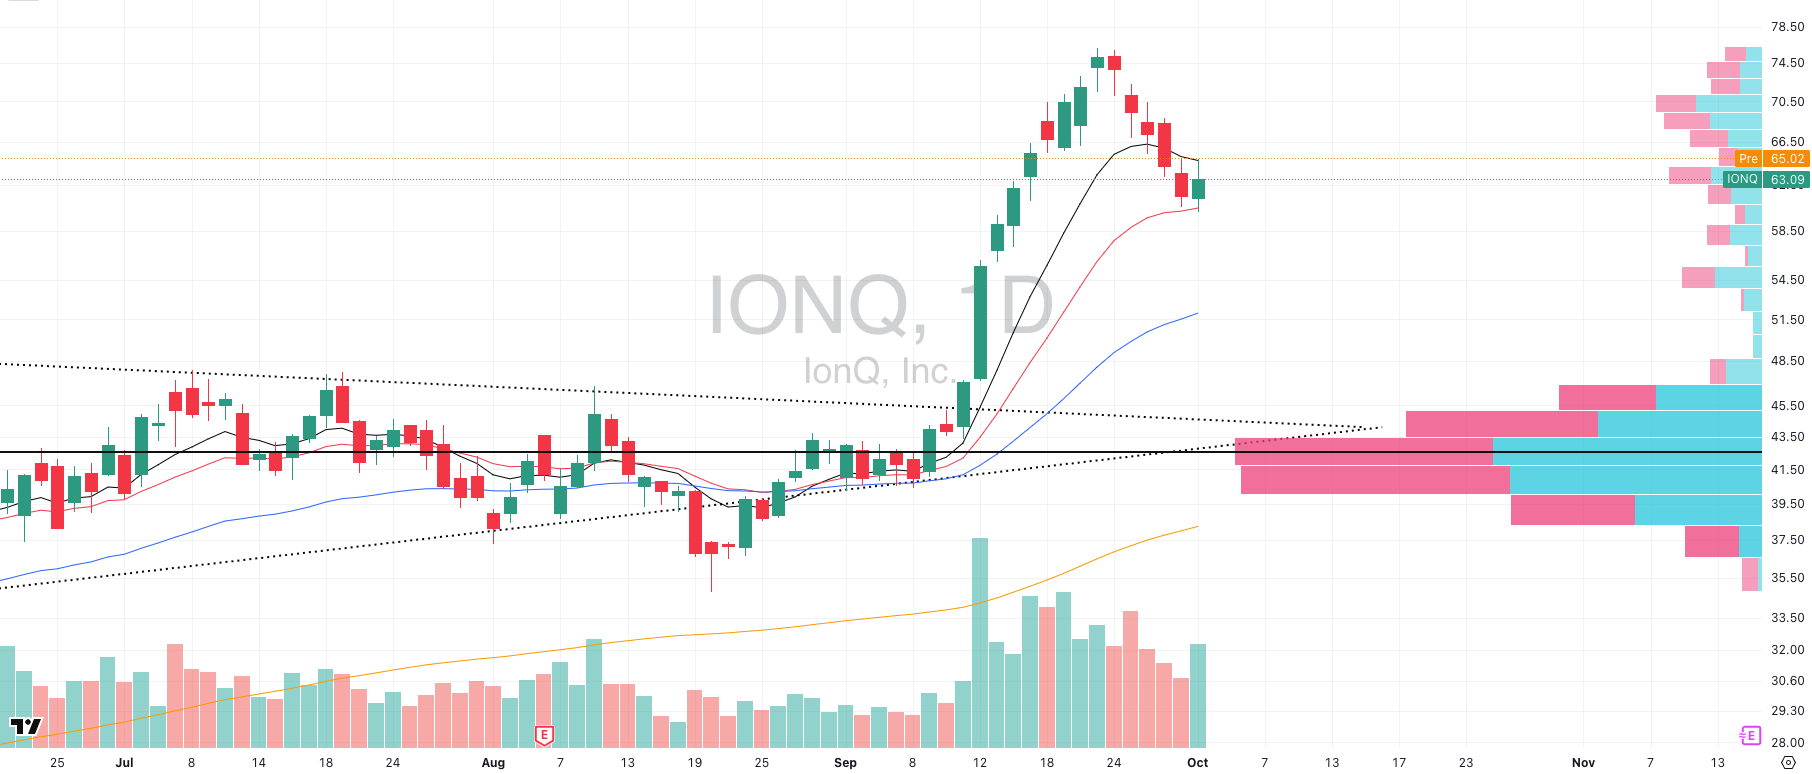
IONQ VRVP Daily Chart
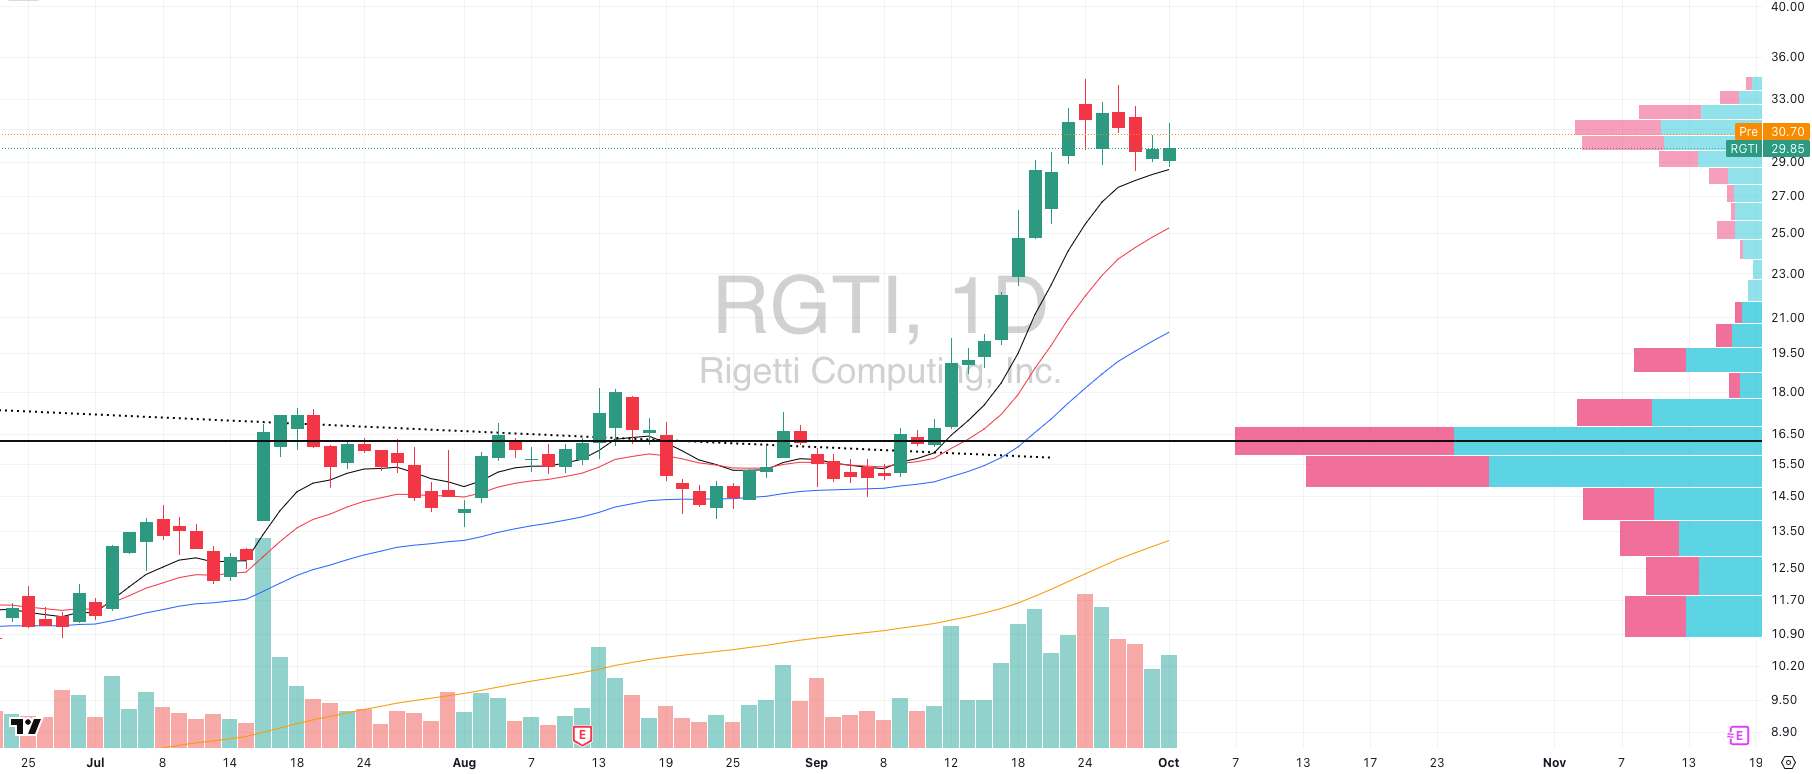
RGTI VRVP Daily Chart
After massive Stage 1 breakouts a few weeks back, each has pulled back constructively on declining relative volume and now sits in a classic Volatility Contraction Pattern (VCP).
This is textbook institutional behavior. You don’t see:
🚀 A group ETF breaking out on extreme relative volume and
🔑 The top speculative leaders consolidating tightly on low volume
…unless large funds are accumulating them in unison.
Full disclosure: we do hold long positions here.
But that doesn’t change the fact that the technicals across this group remain some of the strongest in the entire growth universe right now. These pullbacks on drying volume are healthy resets, not signs of weakness.
👉 Our read: Expect higher prices across QBTS, IONQ, and RGTI over the next few sessions as these bases resolve higher. For growth traders, quantum computing is quickly shaping up as one of the strongest thematic groups in the market.

Did you find value in today's publication?This helps us better design our content for our readers |
Reply