- Swingly
- Posts
- Strong Breadth, Weak Volume: The Market’s Quiet Warning Shot
Strong Breadth, Weak Volume: The Market’s Quiet Warning Shot

OVERVIEW
Key Takeaways from Today’s Report
Markets keep grinding higher despite the ongoing U.S. government shutdown — traders continue to favor momentum over macro fear.
Breadth remains strong: Nasdaq participation broad, but momentum is slowing as volume thins and select leaders (PLTR, META) cool off.
QQQE (equal-weight Nasdaq) has gone parabolic — great breadth confirmation short term, but unsustainable at this pace; consolidation likely.
Midcaps (MDY) rejected at supply near $603–607 — trapped buyers now create potential overhead pressure; failure here risks a deeper markdown phase.
Small Caps (IWM) still constructive above the hourly 10-EMA, but lagging — gap to $244 could fill if momentum fails; large-cap growth remains in charge.
GEV building a textbook base within clean energy (ICLN); higher lows and volume dry-up suggest accumulation, but it’s lagging top peers — wait for confirmation.
XLI (Industrials) finally broke out of multi-week base — strength led by aerospace & defense (KTOS, RKLB) and transportation/logistics stocks; rotation into cyclicals broadening.

MARKET ANALYSIS
Shutdown Drags, Markets Don’t Care & Risk Appetite Holds

AMD x OpenAI: AMD surged over 20% after announcing a major partnership that could give OpenAI a 10% stake in the company, though most of the breakout was later retraced showing some weakness.
Nvidia: Slipped slightly on the AMD news but remains firmly in trend; pullback volume stayed light, suggesting no meaningful supply hit.
Regional Banks: Fifth Third Bancorp’s $10.9B all-stock acquisition of Comerica will create the ninth-largest U.S. bank. The move lifted sentiment across the financial sector and fueled expectations of more M&A activity ahead.
Government Shutdown: Now entering its second week, delaying key economic data such as the September jobs report. So far, markets appear unfazed- Fundstrat’s Tom Lee called it “a sidebar issue” and reaffirmed his call for S&P 500 → 7,000 by year-end.
Nasdaq
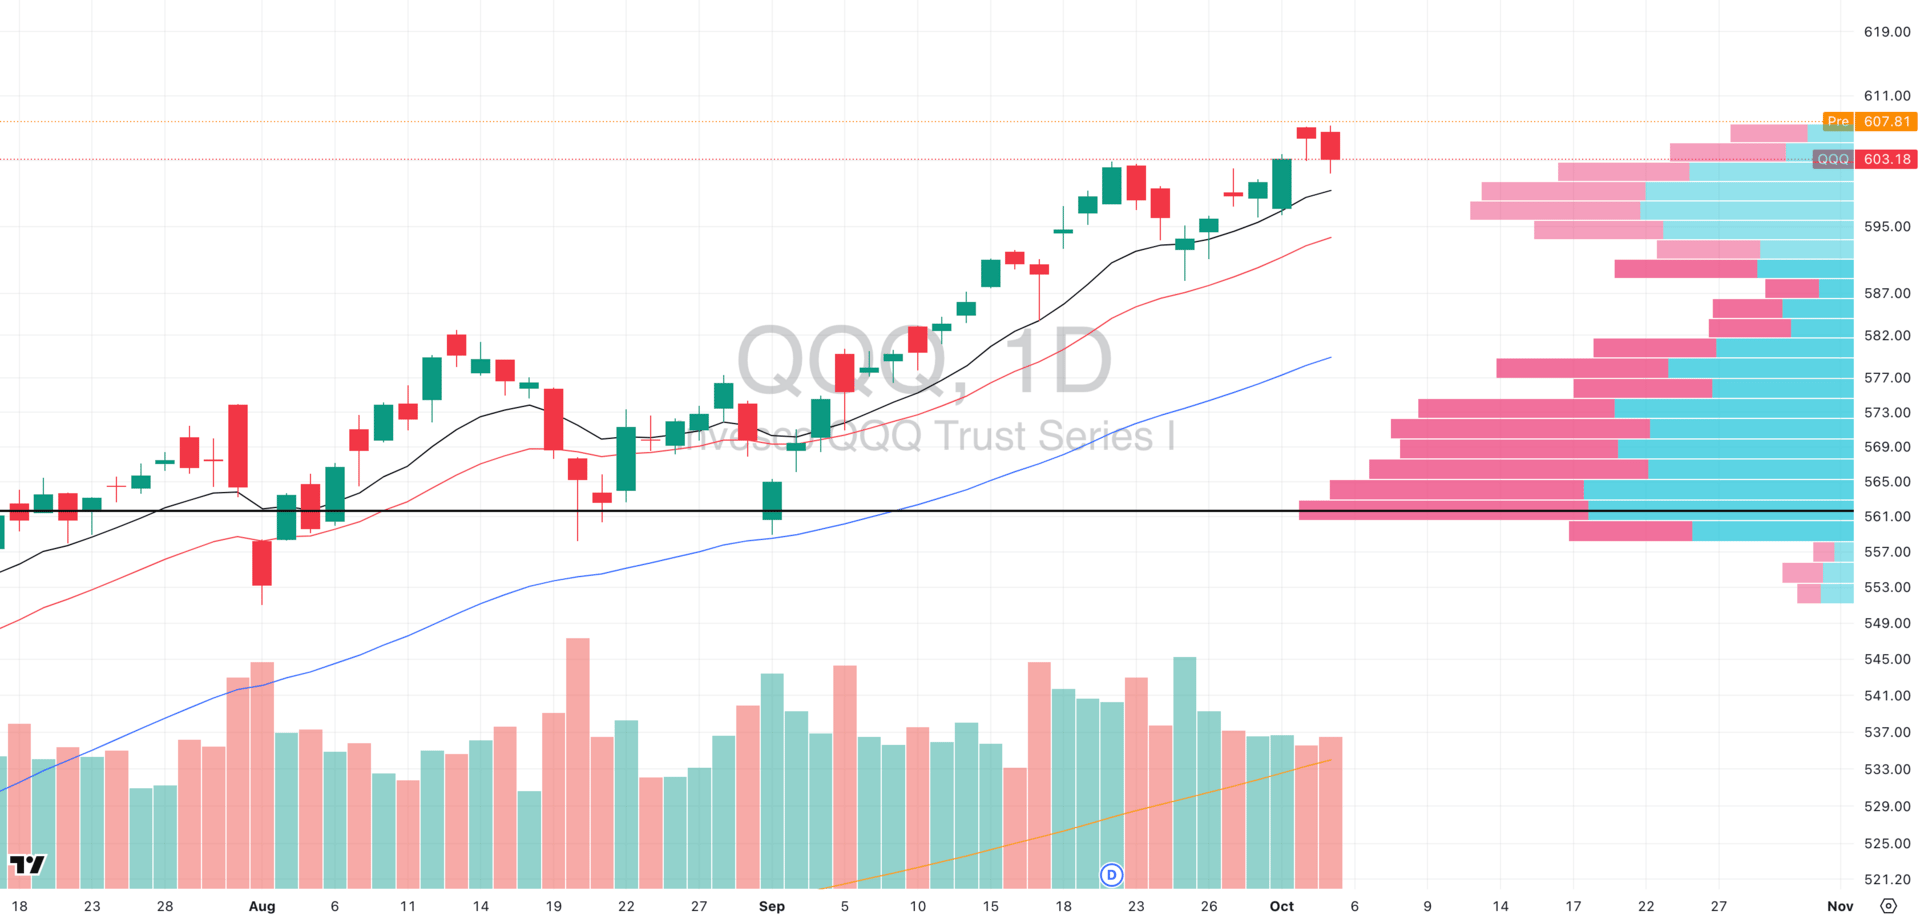
QQQ VRVP Daily Chart
% over 20 EMA: 57.42% | % over 50 EMA: 53.46% | % over 200 EMA: 60.39%
The Nasdaq continues to hold trend integrity, but momentum is beginning to decelerate.
Relative volume has been tapering for the past three weeks on a subtle but important signal that the intensity of demand is fading as price extends.
From a structure standpoint, QQQ is still trending cleanly above its rising 10- and 20-EMAs.
The last two sessions show controlled testing of prior resistance around $602, which has so far flipped into short-term support, and exactly the type of character change that confirms trend maturity rather than exhaustion.
We’re seeing early signs of fatigue in key individual names with stocks like PLTR, TLSA, and META are beginning to lose momentum off recent highs, suggesting that while the trend remains intact, the reward-to-risk for aggressive new entries is narrowing sharply.
Equal-Weight Nasdaq (QQQE)
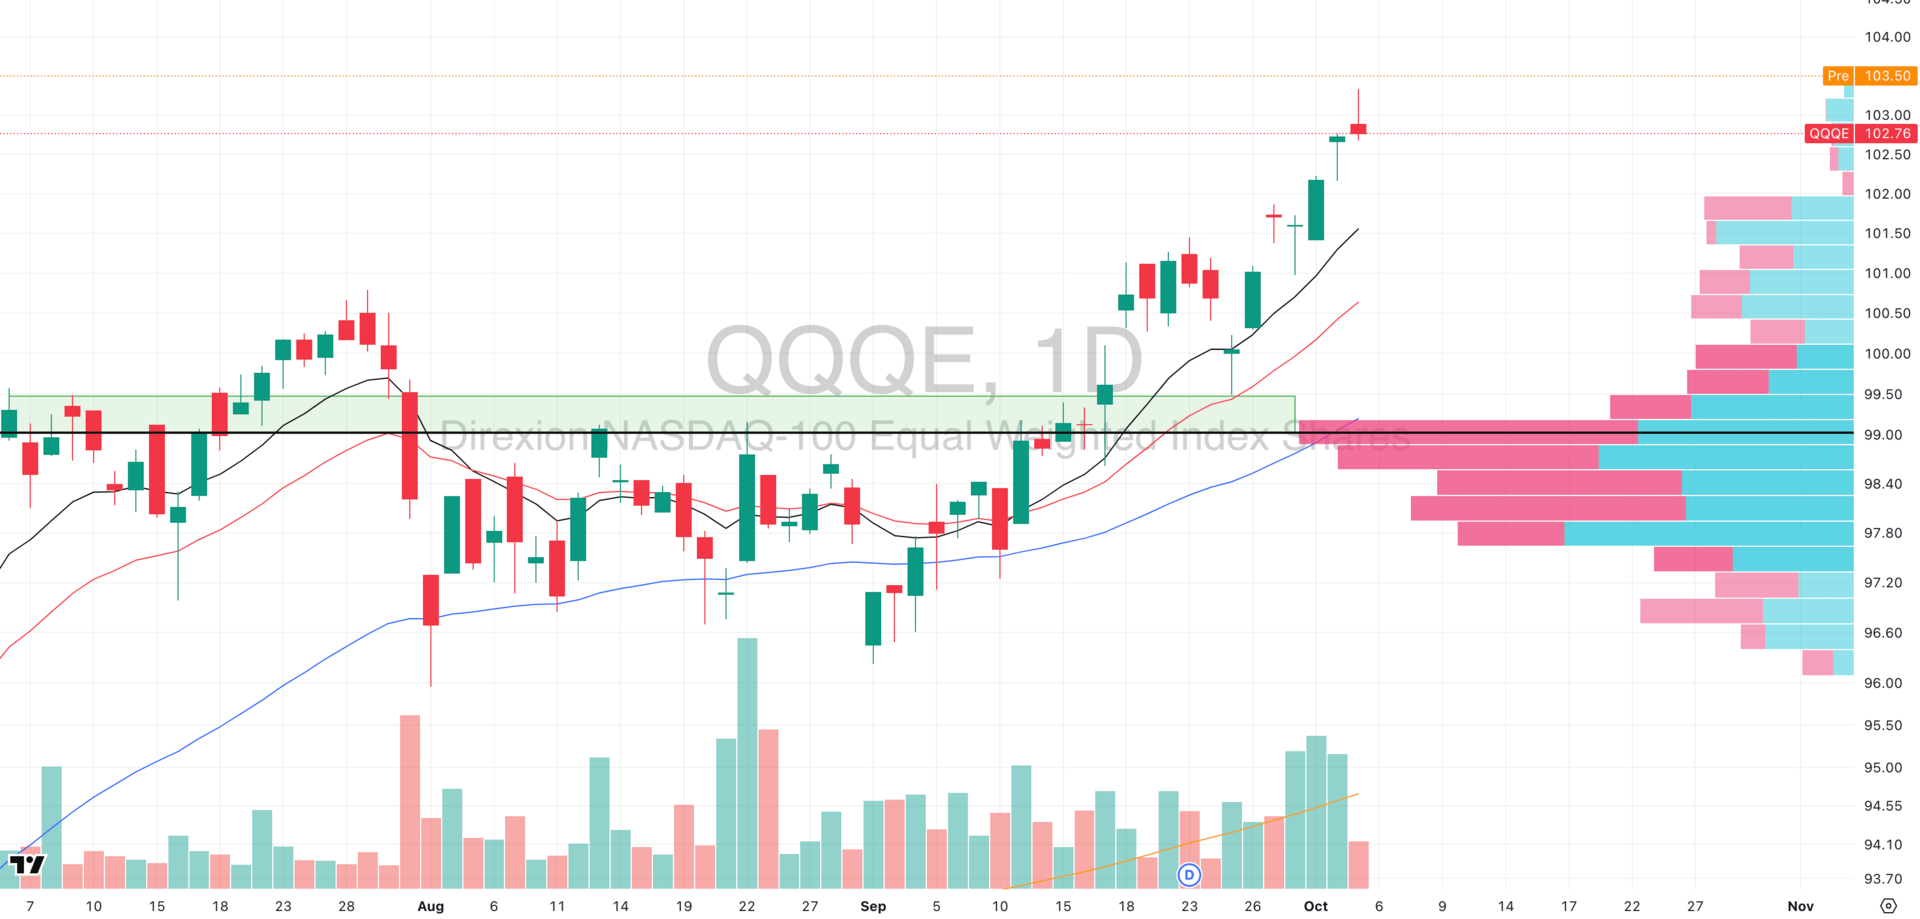
QQQE VRVP Daily Chart
The QQQE has gone near-parabolic, confirming that breadth expansion has been exceptional, but also hinting at short-term exhaustion risk.
Friday’s candle, a high-volume exhaustion bar, reflected the first sign of momentum saturation after an unusually sharp three-week run.
Unlike the much more liquid QQQ, QQQE should be treated solely as a breadth indicator- a measure of how deeply the average Nasdaq component is participating in the advance, rather than a tradable volume-profile setup.
The takeaway is nuanced: strong breadth is bullish, but parabolic equal-weight behavior is rarely sustainable and so we would expect some consolidation here.
S&P 400 Midcap
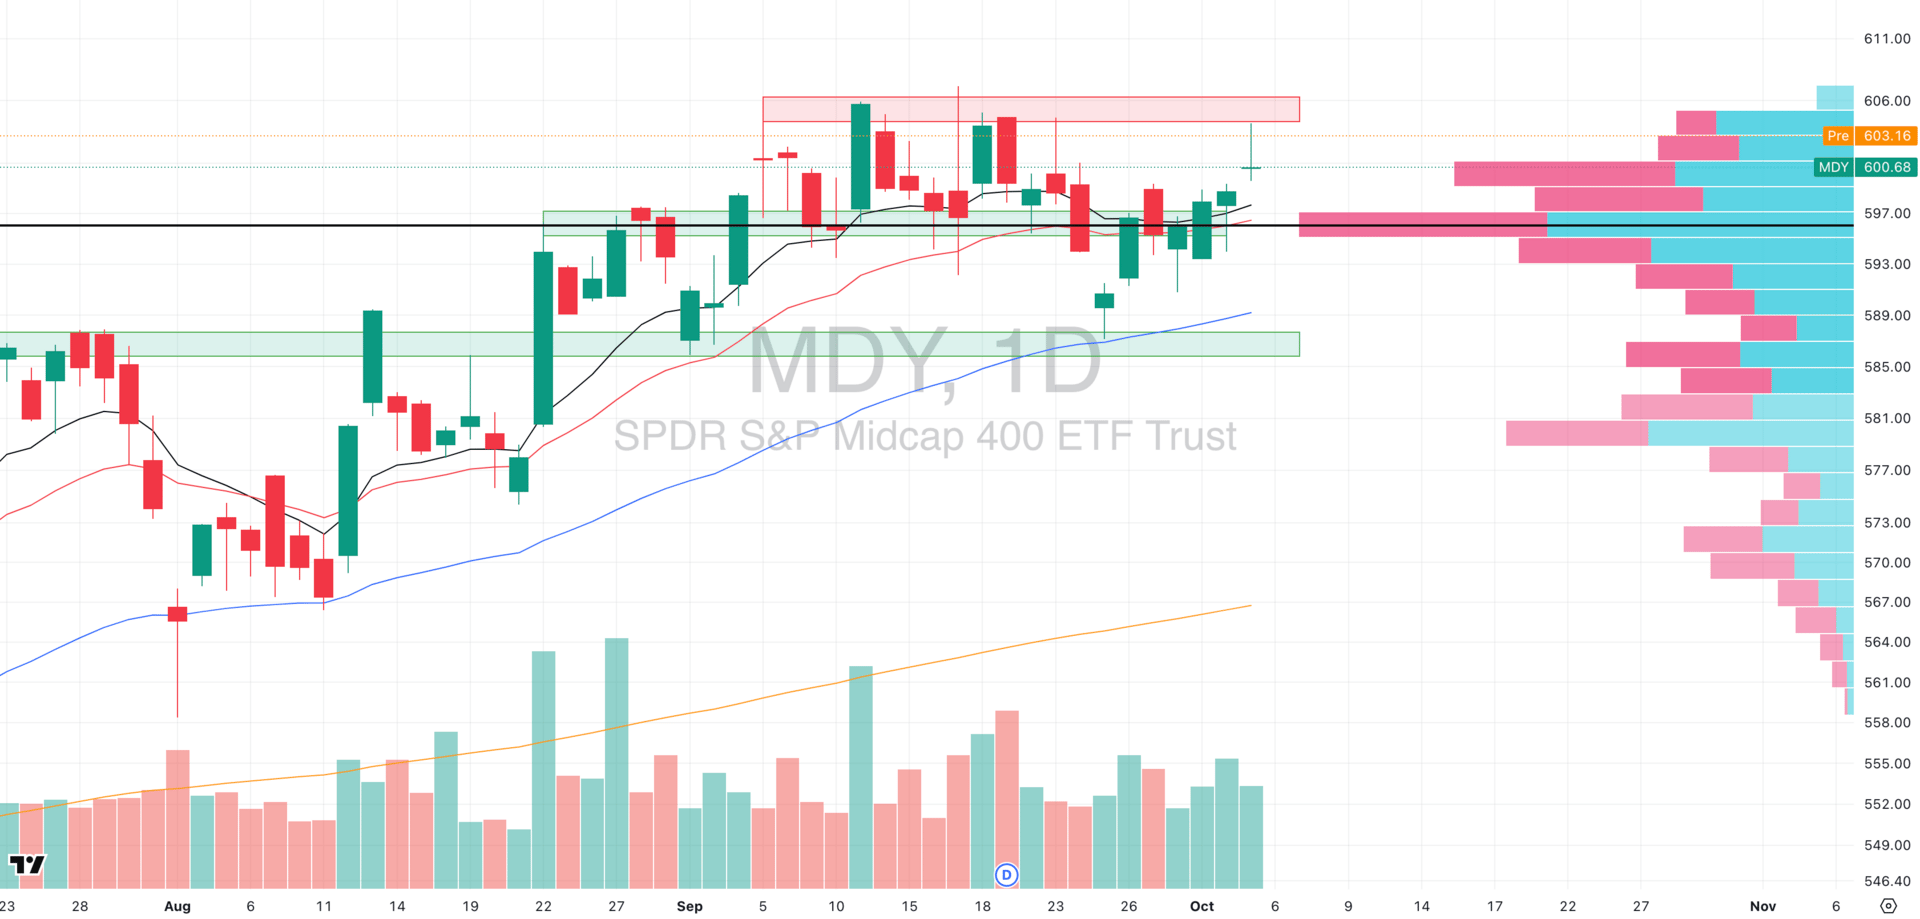
MDY VRVP Daily Chart
% over 20 EMA: 46.63% | % over 50 EMA: 53.86% | % over 200 EMA: 61.84%
The MDY continues to stall beneath the $603–607 band on a level that has quietly become a liquidity trap.
The Visible Range Volume Profile (VRVP) shows predominantly green volume bars in that zone, meaning most transactions there occurred during rising sessions buyers lifting offers, not sellers hitting bids. That tells you demand was active, but no follow-through emerged.
When demand fails to drive price higher, those buyers become latent supply. They’re now waiting to exit breakeven on any rally, creating a feedback loop of selling pressure each time price reenters that band.
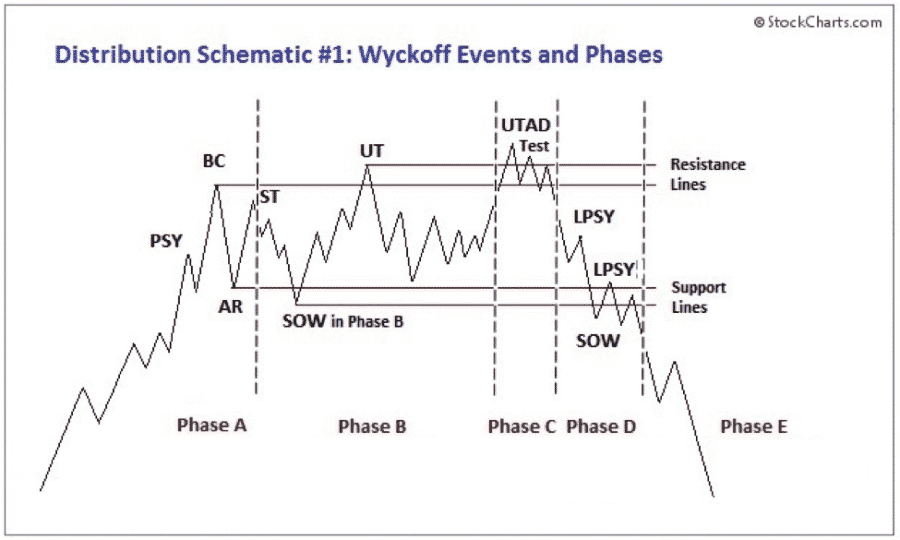
Structurally, this is starting to mirror Wyckoff’s Phase C–D behavior — repeated failed tests of resistance with shortening thrusts and diminishing volume.
If we can’t absorb that overhead supply soon, Phase E (markdown) becomes the next logical stage.
Russell 2000
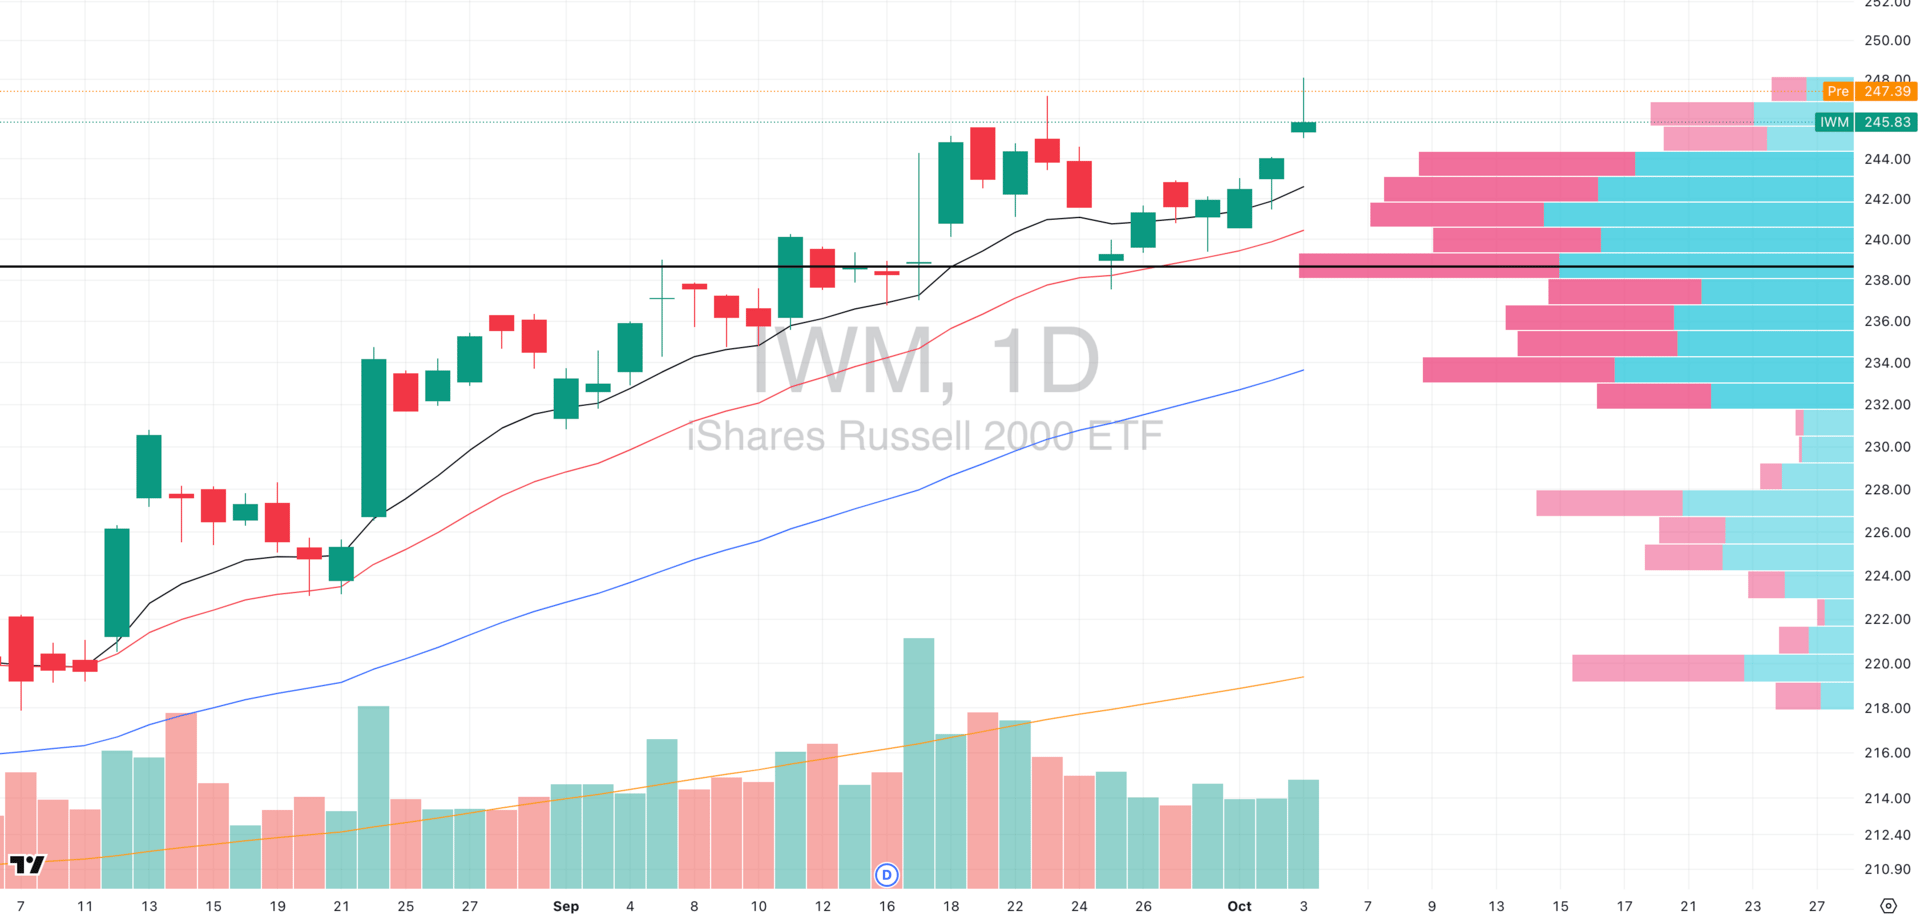
IWM VRVP Daily Chart
% over 20 EMA: 46.74% | % over 50 EMA: 56.66% | % over 200 EMA: 60.52%
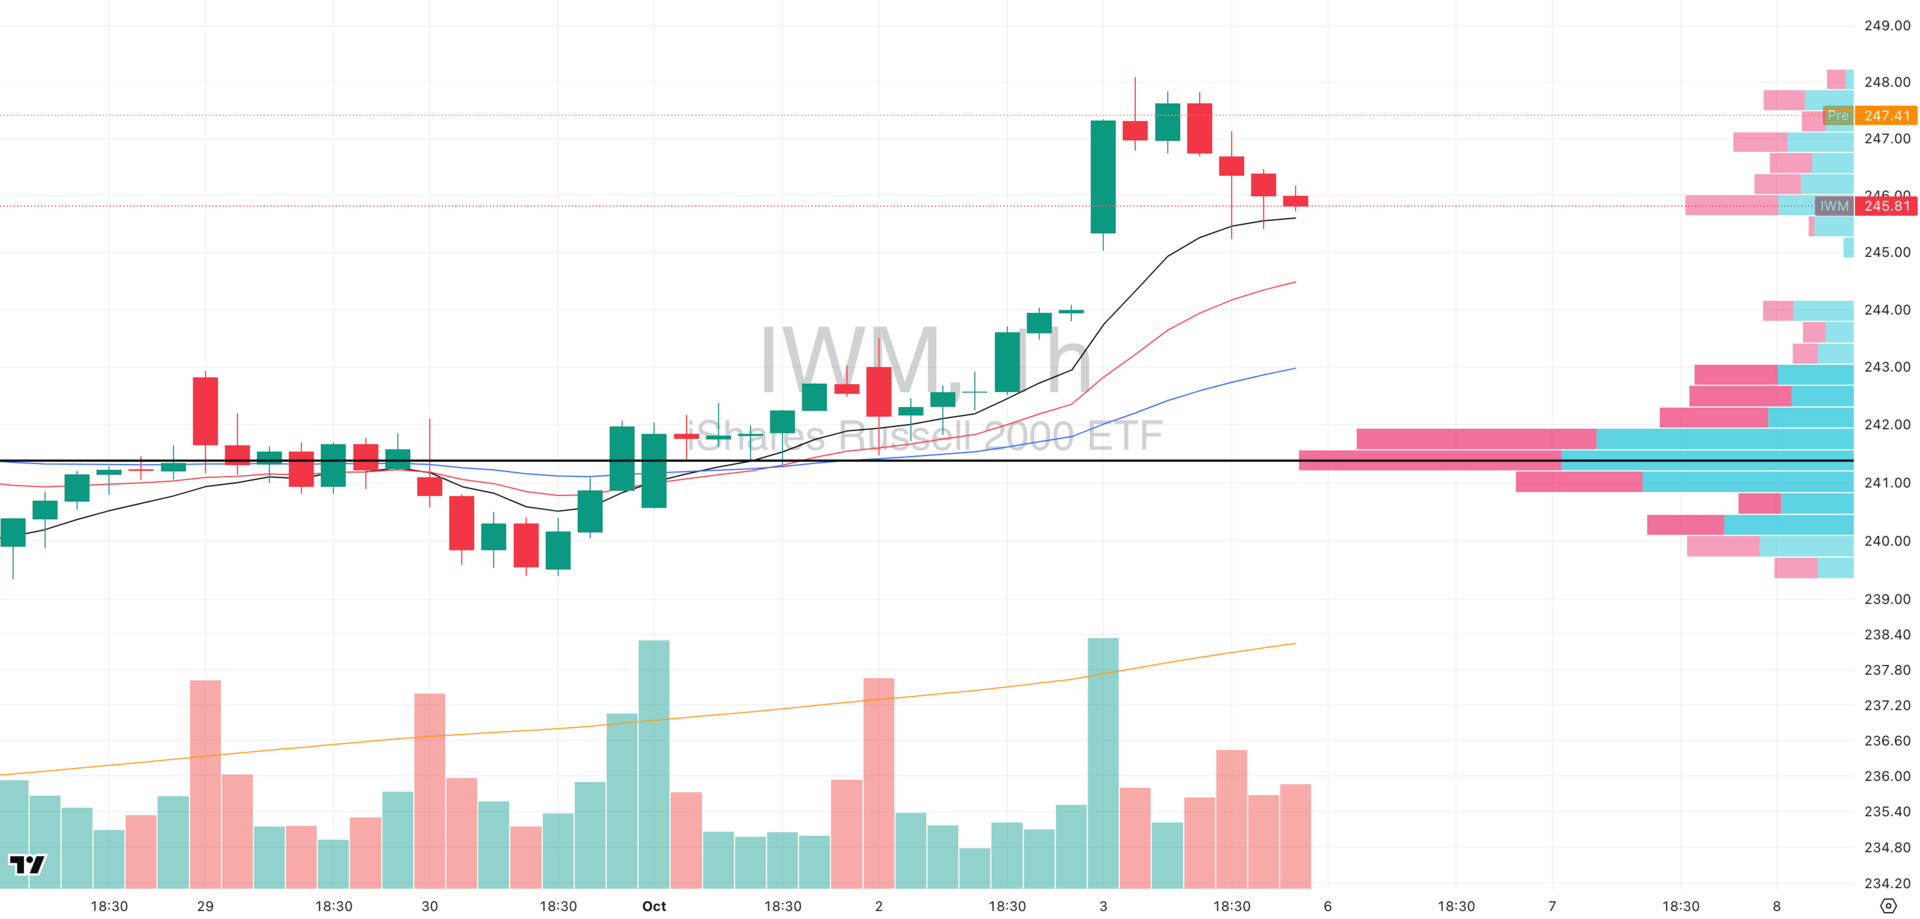
IWM VRVP Hourly Chart
Friday’s session flashed the first exhaustion signal within the small-cap complex with a gap-up open that faded intraday before finding support right at the rising hourly 10-EMA. That rebound is encouraging, but it highlights how momentum isn’t really as strong as it may seem.
Structurally, the visible range volume profile (VRVP) still shows a low-volume pocket between $245–$247, meaning there’s limited supply overhead- price can move quickly if follow-through buying re-engages. The key inflection zone remains $248–$249, where a breakout would reclaim initiative for bulls and likely force fresh highs.
However, there’s a gap left behind near $244, and failure to hold today’s open would increase the odds of a retest there, a healthy shakeout, but one that would confirm momentum fatigue near resistance.
From a relative strength lens, the small-cap rally continues to lag. The large-cap growth complex, led by the Nasdaq and SPY vs. RSP ratio, remains the dominant engine of market leadership..
Make Your Ascent With Confidence

For those looking to climb to the top, only the best will do. Peak Bank’s high-yield savings account delivers exactly what savvy savers need, helping you go higher than ever before. Earn up to 4.35% APY* today when you join Peak Bank.
Member FDIC
FOCUSED STOCK
GEV: The Top Clean Energy Play
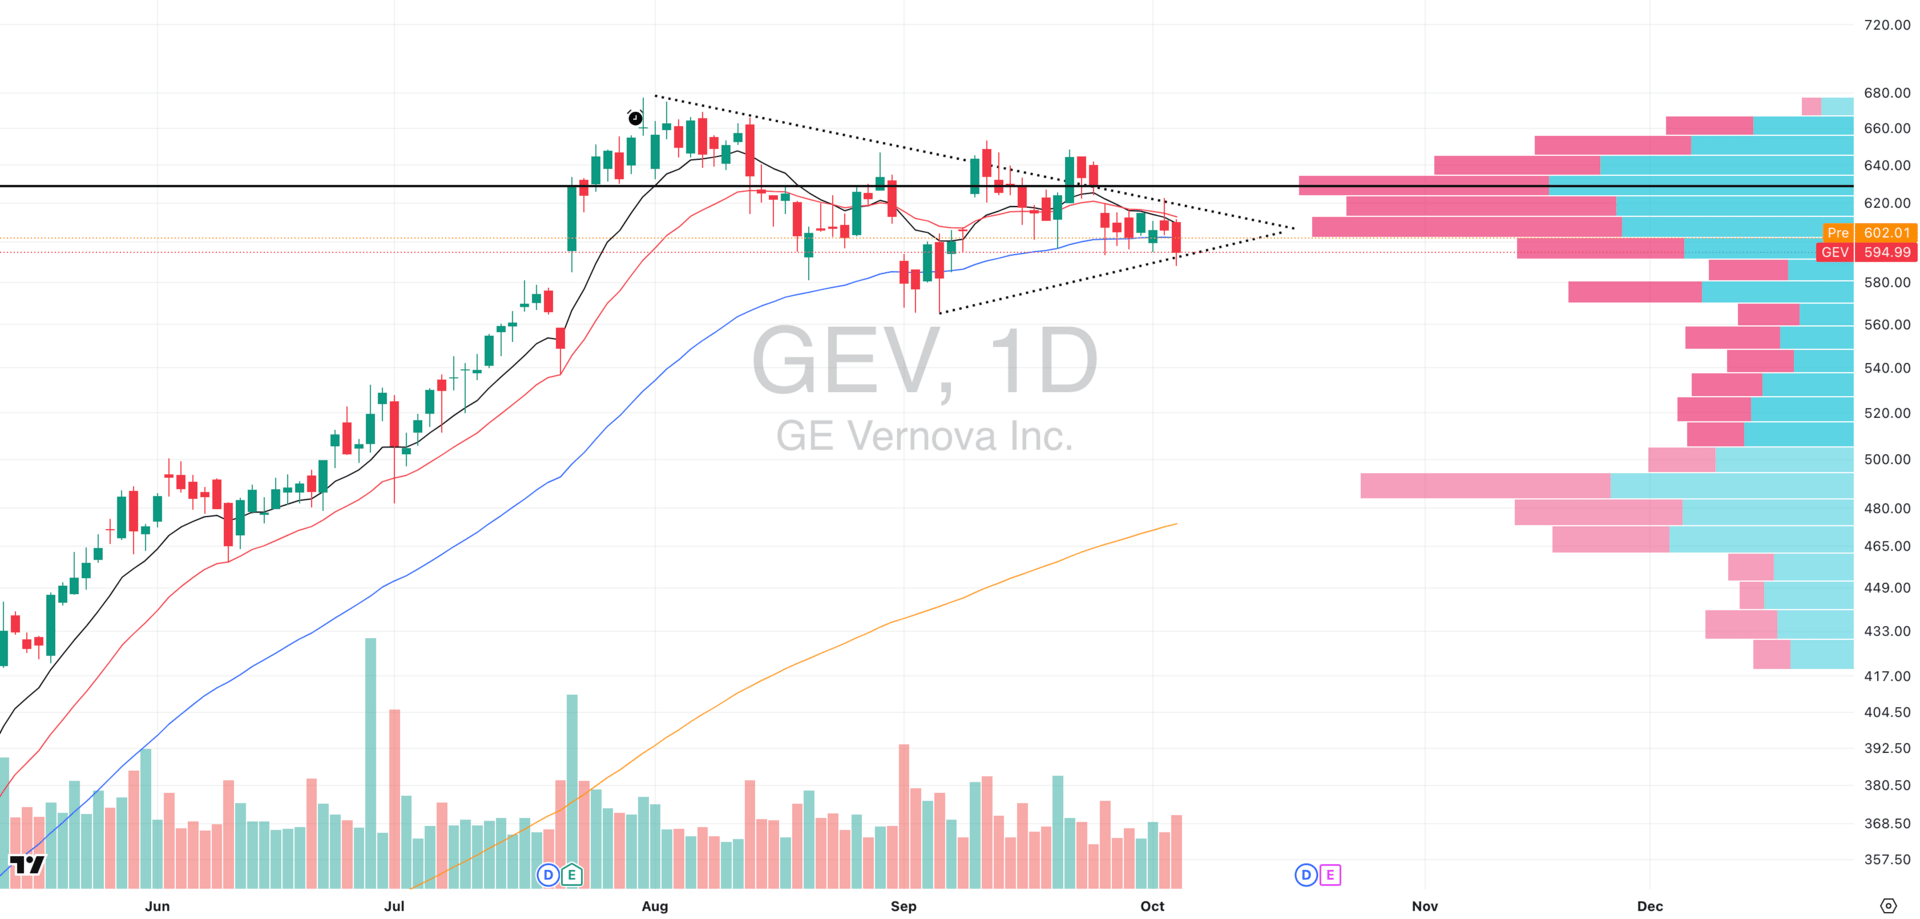
GEV VRVP Daily Chart
ADR%: 3.45% | Off 52-week high: -12.2% | Above 52-week low: +136%
Structure: Over the past several months, GEV has built a well-defined base, with each dip being bought at progressively higher levels. That staircase of higher lows signals controlled demand stepping in consistently rather than reactive buying.
Volume dynamics: We’re now seeing volume drying up, exactly what you want at this stage of a base. It tells us that the sellers who were willing to sell at these levels have largely been cleared out. When that happens, even modest demand can trigger meaningful upside expansion once a breakout attempt comes.
Sector context: Importantly, GEV sits within the clean energy sector (ICLN), which has quietly emerged as one of the leading relative strength groups in recent weeks.
Short-term caution: The recent dip toward $5.95 looks like a healthy back-test of prior demand. We would expect buyers to step in here again. However, traders should avoid trying to preempt a bounce; the cleaner play is waiting for confirmation through strength, not anticipation.
Leadership concern: That said, some peer names within clean energy have shown sharper relative momentum and are already outperforming both the SPY and the ICLN ETF itself. This raises a valid concern that GEV may be lagging within its own leadership group, and it will need to prove itself by resolving higher from this base before it earns capital priority.
FOCUSED GROUP
XLI: The Next Leadership Group
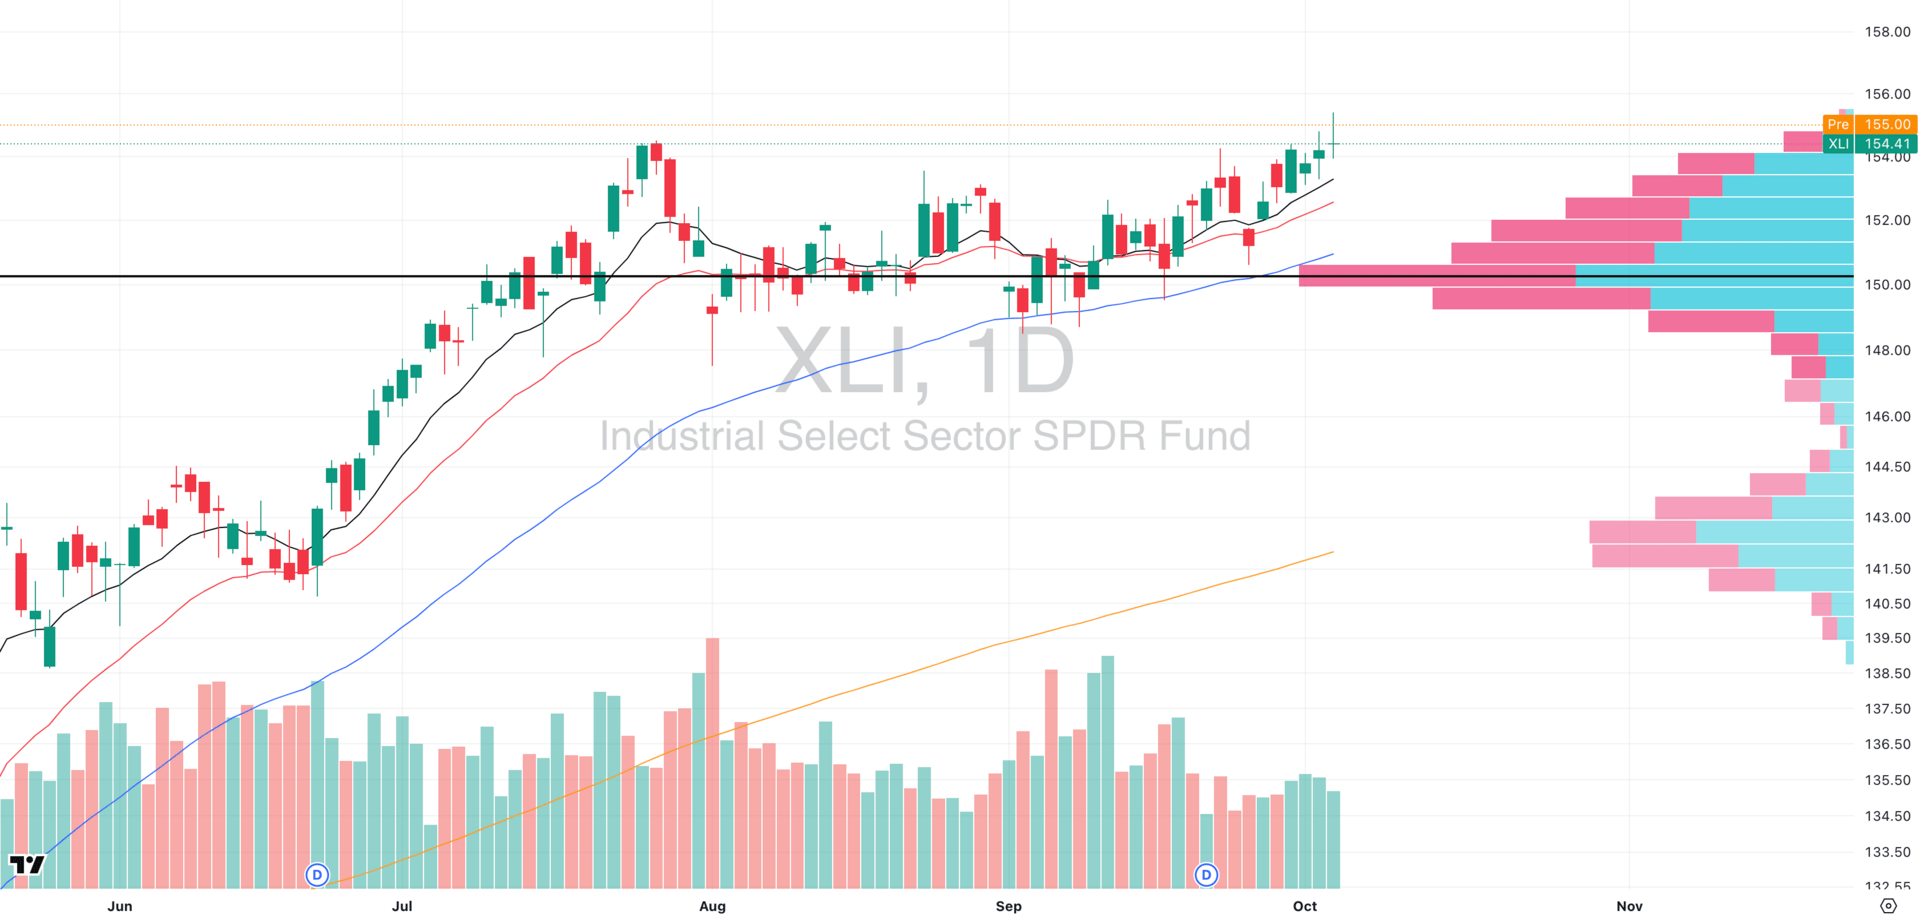
XLI VRVP Daily Chart
Base structure: After weeks of tight consolidation, XLI has finally pushed through the upper boundary of its base. The ETF spent over a month absorbing supply at its Point of Control (POC), with declining volume and narrowing daily ranges.
Leadership rotation: The aerospace and defense sub-group (XAR) has been the clear leader within the complex. Stocks like KTOS and RKLB have been showing powerful trend continuation, breaking out on expanding relative volume and holding above rising short-term EMAs. That’s where institutional money has been flowing, and it’s largely responsible for pulling the broader XLI higher.
Breadth confirmation: Outside of defense, there’s growing strength in transportation and logistics; think rails, trucking, and parcel delivery names. These groups tend to act as economic bellwethers, and when they start joining the advance, it usually signals a deeper rotation into cyclical risk.

Did you find value in today's publication?This helps us better design our content for our readers |
Reply