- Swingly
- Posts
- Strength: We Got The Close We Needed
Strength: We Got The Close We Needed
In partnership with

MARKET ANALYSIS
Here’s What You Need To Know

U.S. futures are modestly lower this morning following a stronger-than-expected Q3 GDP print, which showed the economy growing at a 4.3% annualized pace, well ahead of expectations. The data reinforces the idea that the U.S. economy remains resilient, particularly on the consumer side, even late in the cycle.
The immediate market reaction has been restrained. Rather than triggering any risk-off response, the GDP surprise has simply led to some trimming of near-term rate-cut expectations, with markets now leaning more heavily toward a Fed pause in January. Importantly, this has been a repricing at the margins, not a disorderly shift in expectations.
Equities are coming off several strong sessions, with the S&P 500 sitting just below record highs after last week’s combination of softer inflation data and a cooling labor picture. Against that backdrop, a mild pullback in futures looks more like digestion than deterioration.
One theme that continues to quietly assert itself is the divergence beneath the surface of the economy. The GDP data once again highlighted a K-shaped dynamic, where higher-income consumers remain resilient while pressure builds at the lower end. For markets, this reinforces the importance of stock selection over index-level calls.
Precious metals continue to reflect longer-term macro undercurrents rather than short-term risk sentiment. Gold and silver are extending what is shaping up to be their strongest year in decades, a move that speaks more to currency, fiscal, and confidence dynamics than immediate equity stress.
With the market moving into a holiday-shortened week, liquidity will thin quickly. Early closes and limited participation increase the likelihood of choppier price action and false moves, particularly around well-known technical levels.
That being said, pullbacks in the growth names continues to be rewarded and we believe today is a good opportunity to gauge whether yesterday’s strength can be followed through with a dip into lows happening as we speak.
Nasdaq
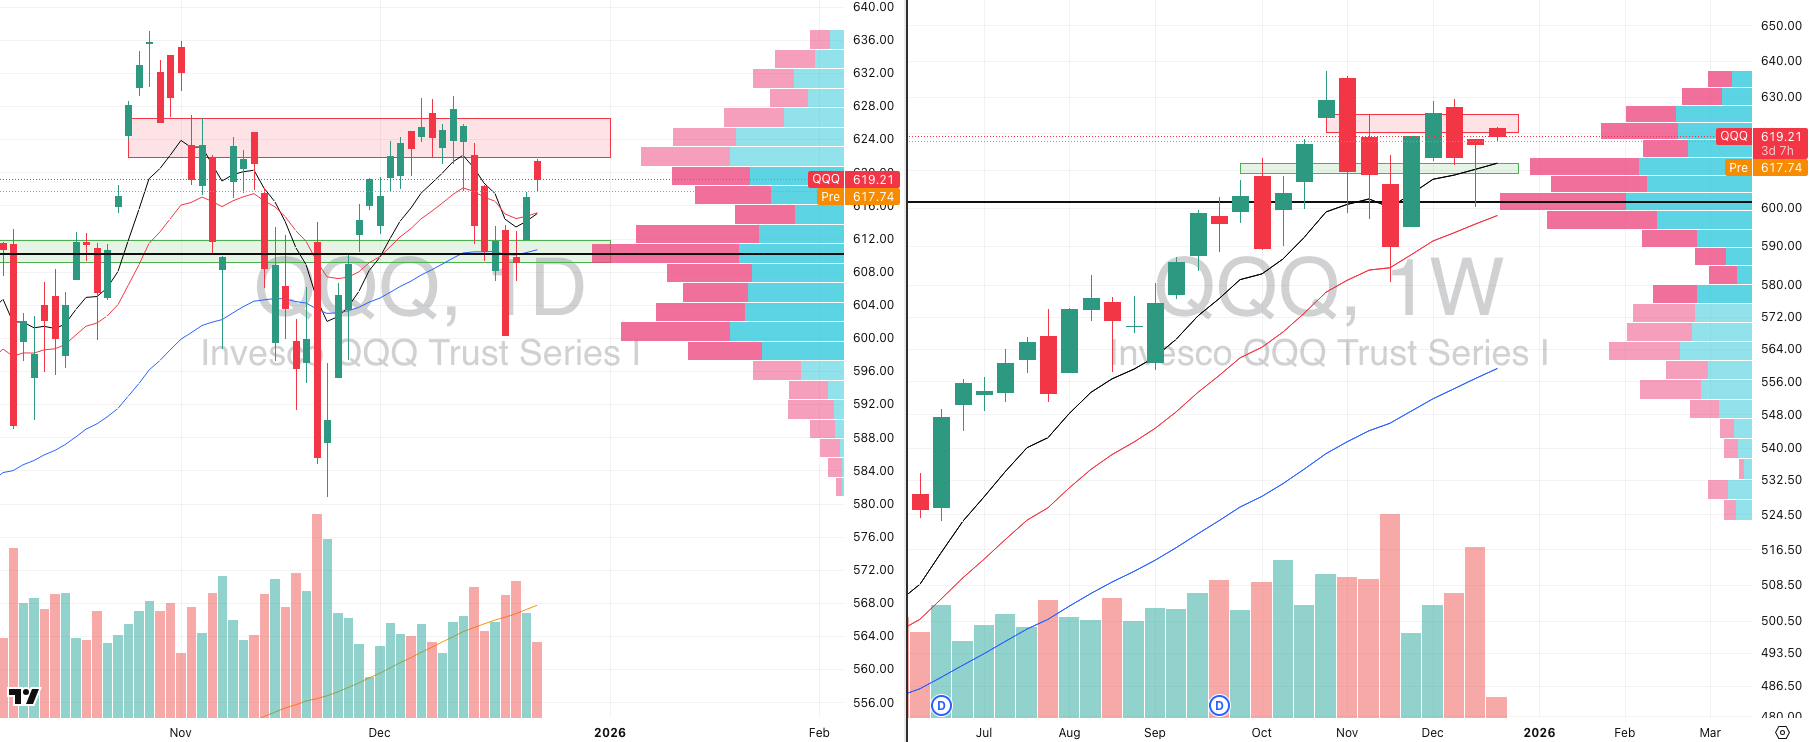
QQQ VRVP Daily & Weekly Chart
53.46%: over 20 EMA | 44.55%: over 50 EMA | 51.48%: over 200 EMA
QQQ pushed higher yesterday but ran directly into overhead supply at ~622, the same zone we marked as resistance last week.
That rejection matters, but it doesn’t invalidate the broader rebound — this market has consistently rewarded pullbacks, not breakout chasing.
This morning’s dip looks like a retest of yesterday’s highs near 616, not a structural failure.
A pullback into prior highs is acceptable as long as we hold and close above 616.
Failure to reclaim and hold that level would likely extend the correction and open a move back toward 612, the mapped demand zone and EMA cluster.
There is a low-volume pocket between ~617 and 613, which explains why moves through this zone can be fast and emotionally noisy.
Bigger picture: structure remains constructive.
Higher lows remain intact.
Weekly trend is still supported.
This continues to look like digestion, not distribution.
Key takeaway: ignore the open, focus on the close — that’s where the signal will be.
S&P 400 Midcap
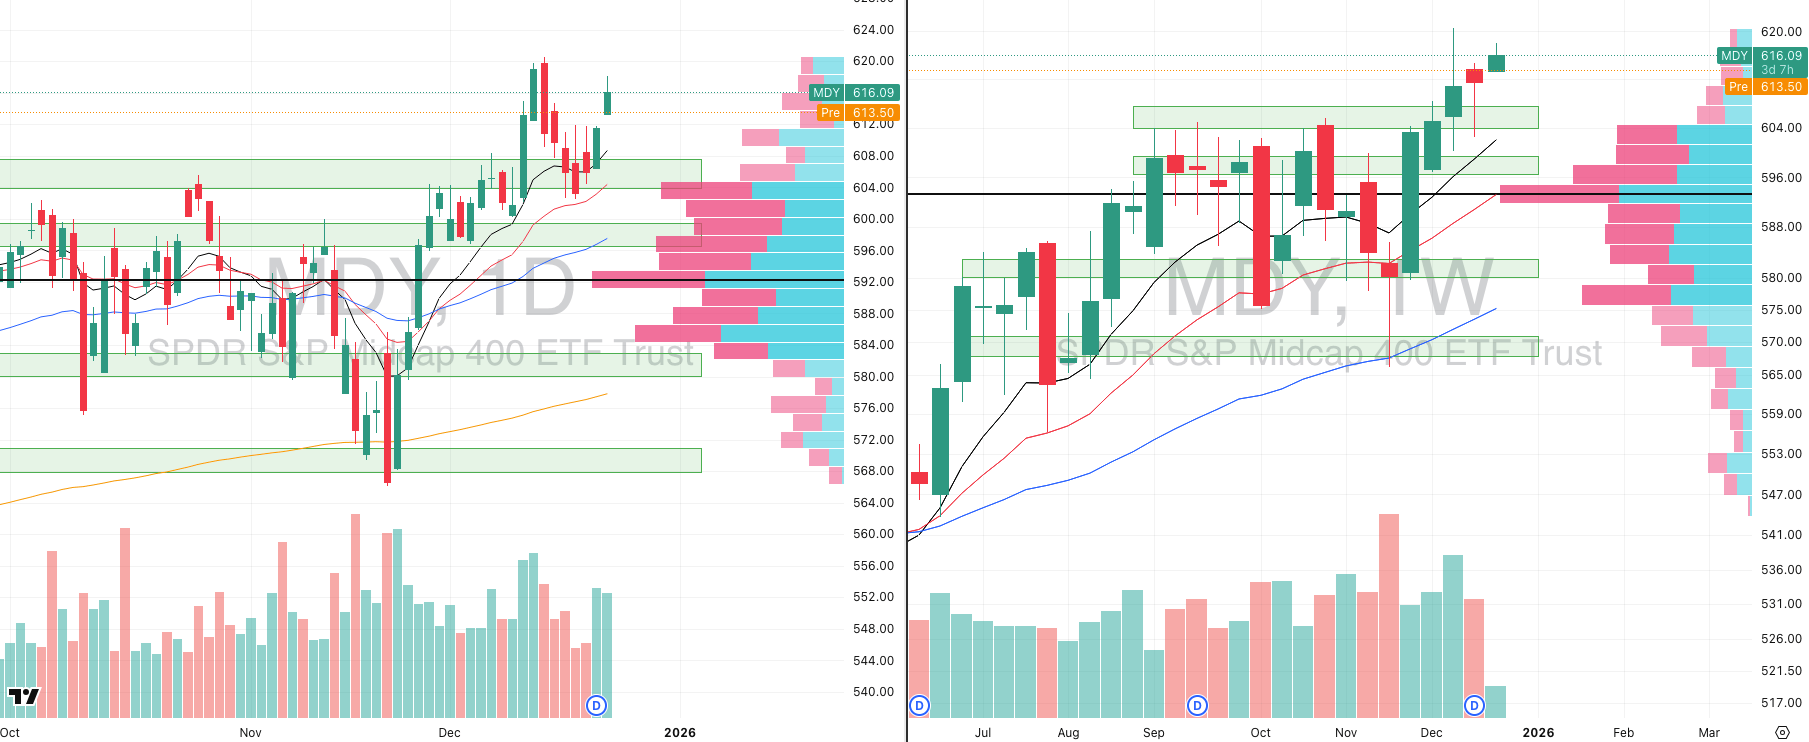
MDY VRVP Daily & Weekly Chart
74.50%: over 20 EMA | 54.00%: over 50 EMA | 57.00%: over 200 EMA
MDY also had a strong push yesterday (113% relative volume), but once again failed at range highs.
This continues to reinforce the same playbook we’ve seen for weeks:
Breakout highs get sold.
Pullbacks into moving averages get bought.
The 608 area is now clearly demand:
Prior resistance.
Daily point of control.
Successfully held after a multi-day consolidation.
There is heavy trapped long exposure above ~618, visible on the volume profile:
Large green volume overhead.
Sellers are using rallies to exit.
Today’s pullback is not a red flag unless we lose 608 on a closing basis.
As long as MDY holds above demand, the character remains bullish.
Again: entry quality matters more than direction in this environment.
Russell 2000
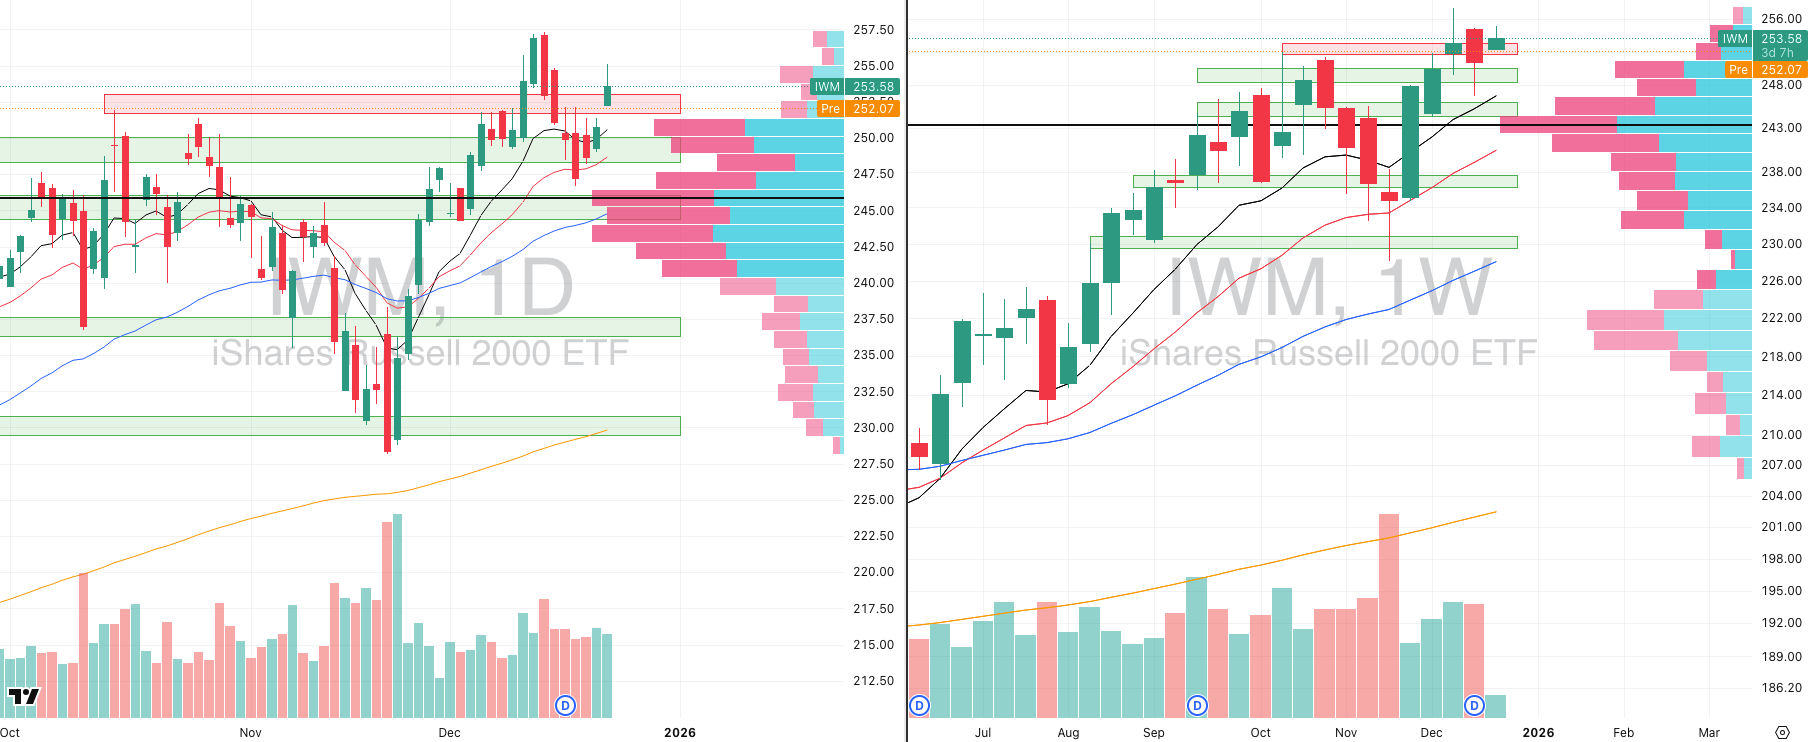
IWM VRVP Daily & Weekly Chart
69.05%: over 20 EMA | 54.11%: over 50 EMA | 58.54%: over 200 EMA
IWM continues to lag relative to QQQ and MDY.
Price once again failed to clear ~253, keeping that zone firmly classified as supply.
Yesterday’s move faded more than 50%, suggesting buyers are still hesitant at highs.
A gap fill toward ~250 would be normal within this structure.
Weekly context remains constructive:
Demand stepped in aggressively last week.
High-volume reversal near the rising 10-week MA.
Importantly, strength inside small caps is stock-specific, not index-wide.
The index itself is noisy — leadership needs to be identified beneath the surface.
Expect continued rotation rather than broad small-cap momentum.
Amazon Prime members: See what you could get, no strings attached

If you spend a good amount on Amazon, this card could easily be worth $100s in cash back every year. And — even better — you could get approved extremely fast. If approved, you’ll receive an insanely valuable welcome bonus deposited straight into your Amazon account, ready to use immediately.
You also don’t have to jump through any hoops to get this bonus. No extra work or special spending requirements. Get approved, and it’s yours.
This might be one of the most powerful cash back cards available, especially considering how much most people spend on Amazon each month. It gives you the chance to earn cash back on the purchases you’re already making, turning your routine shopping into something that actually pays you back.
If you shop at Amazon or Whole Foods, this card could help you earn meaningful cash back on every purchase you make. But this offer won’t last forever — and if you’re an Amazon Prime member, this card is as close to a no-brainer as it gets.
Amazon Prime members: See what you could get, no strings attached
FOCUSED STOCK
RGTI: Quantum Is Coiling
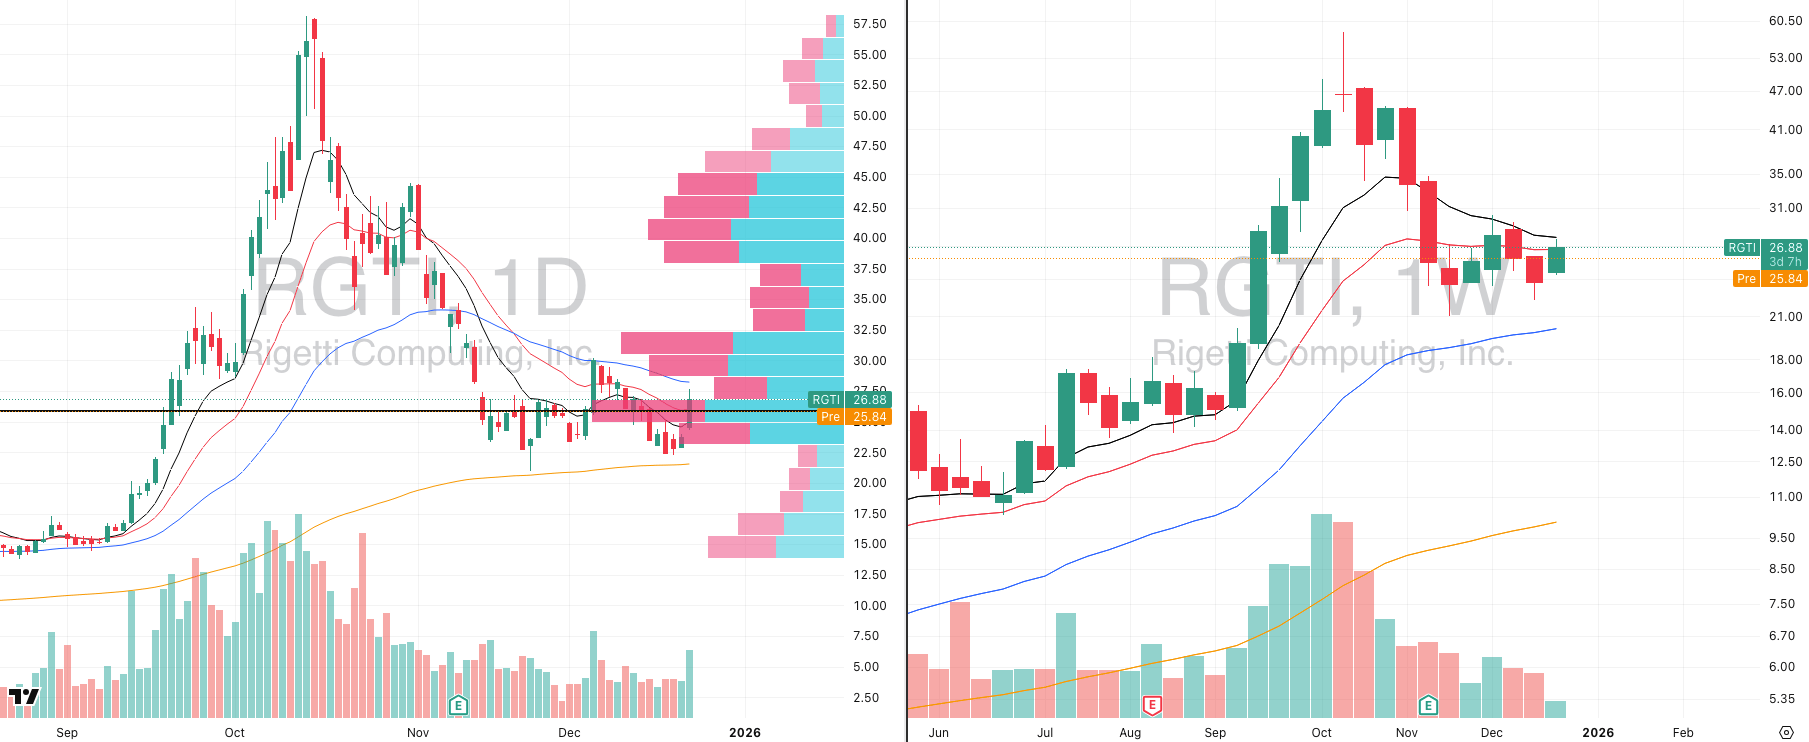
RGTI VRVP Daily & Weekly Chart
ADR%: 8.15% | Off 52-week high: -55.4% | Above 52-week low: +334.5%
The quantum computing complex continues to stand out as the highest-beta leadership pocket in the market right now.
Yesterday’s move was broad-based, not isolated:
Most names in the group posted strong gains.
Relative volume expanded meaningfully across the board.
RGTI remains one of the clear leaders:
Relative strength vs. S&P 500 sits at 98, placing it among the strongest stocks in the market.
Price is holding a double-bottom structure off the rising 200-day MA (~21.80).
This strength is showing up exactly where you’d expect in a risk-on tape:
Highly speculative.
High volatility.
Long-duration growth themes.
Structurally, RGTI is still in an intermediate contraction phase.
Yesterday’s rejection near the 10-week MA (~27.87) reinforces a familiar lesson:
Breakout highs are low-quality entries.
Pullbacks into major moving averages are where asymmetry shows up.
The highest-quality entry already occurred:
Pullbacks into the long-term MA cluster around 22, directly off the 200-day.
This isn’t just an RGTI story.
Other names worth tracking closely:
QBTS (group leader)
QUBT
IONQ
More broadly, we’re seeing leadership concentrate in front-end risk themes:
Quantum computing.
Adjacent speculative growth areas, including modular nuclear / next-gen energy.
Did you find value in today's publication?This helps us better design our content for our readers |
Reply