- Swingly
- Posts
- Stocks Will Sell Off Further
Stocks Will Sell Off Further


MARKET ANALYSIS
Here’s All You Need To Know

Yesterday’s relief tone has reversed sharply because the market was once again forced to reprice geopolitical expectations overnight.
What changed is that the White House moved from suggesting near-term withdrawal to openly signalling further escalation. That immediately removed the optimism that had driven yesterday’s rebound and pushed markets straight back into risk reduction mode.
Donald Trump did not offer a clear path to resolution in last night’s address, instead the message was that military pressure would intensify before any exit.
The clearest reaction is in oil. West Texas Intermediate is back above $109 and Brent Crude has also surged back through $109.
This is oil returning aggressively higher after briefly trying to stabilise, which tells you the energy market still believes disruption risk is very real.
In practical terms, oil is now behaving as the most honest macro signal again. Equities can bounce on headlines, but crude keeps snapping back whenever the rhetoric hardens.
That is why futures are under pressure across the board, with the Nasdaq taking the heaviest hit once again.
The broader concern now is that this is no longer being treated purely as an oil shock. More desks are starting to frame it as an energy shock, because fertilisers, gas flows, shipping routes and industrial inputs are all being repriced alongside crude.
An energy shock spreads further into the economy than oil alone as it slows growth while simultaneously keeping inflation elevated which means the market is increasingly facing a mild stagflation setup: weaker growth, tighter margins, and less room for central bank flexibility.
That is also why yields are not collapsing despite the equity weakness. The bond market is not fully pricing recession yet because inflation risk remains alive.
Under the surface, sector behaviour remains very narrow. Energy-linked equities are bid again, while anything exposed to fuel costs or discretionary demand is immediately under pressure.
Airlines, cruise operators and higher-beta growth names are all reacting exactly as you would expect when oil moves this quickly.
One positive headline can create a rebound, but as long as crude remains above $100, the burden of proof stays firmly on any equity rally.
S&P 500
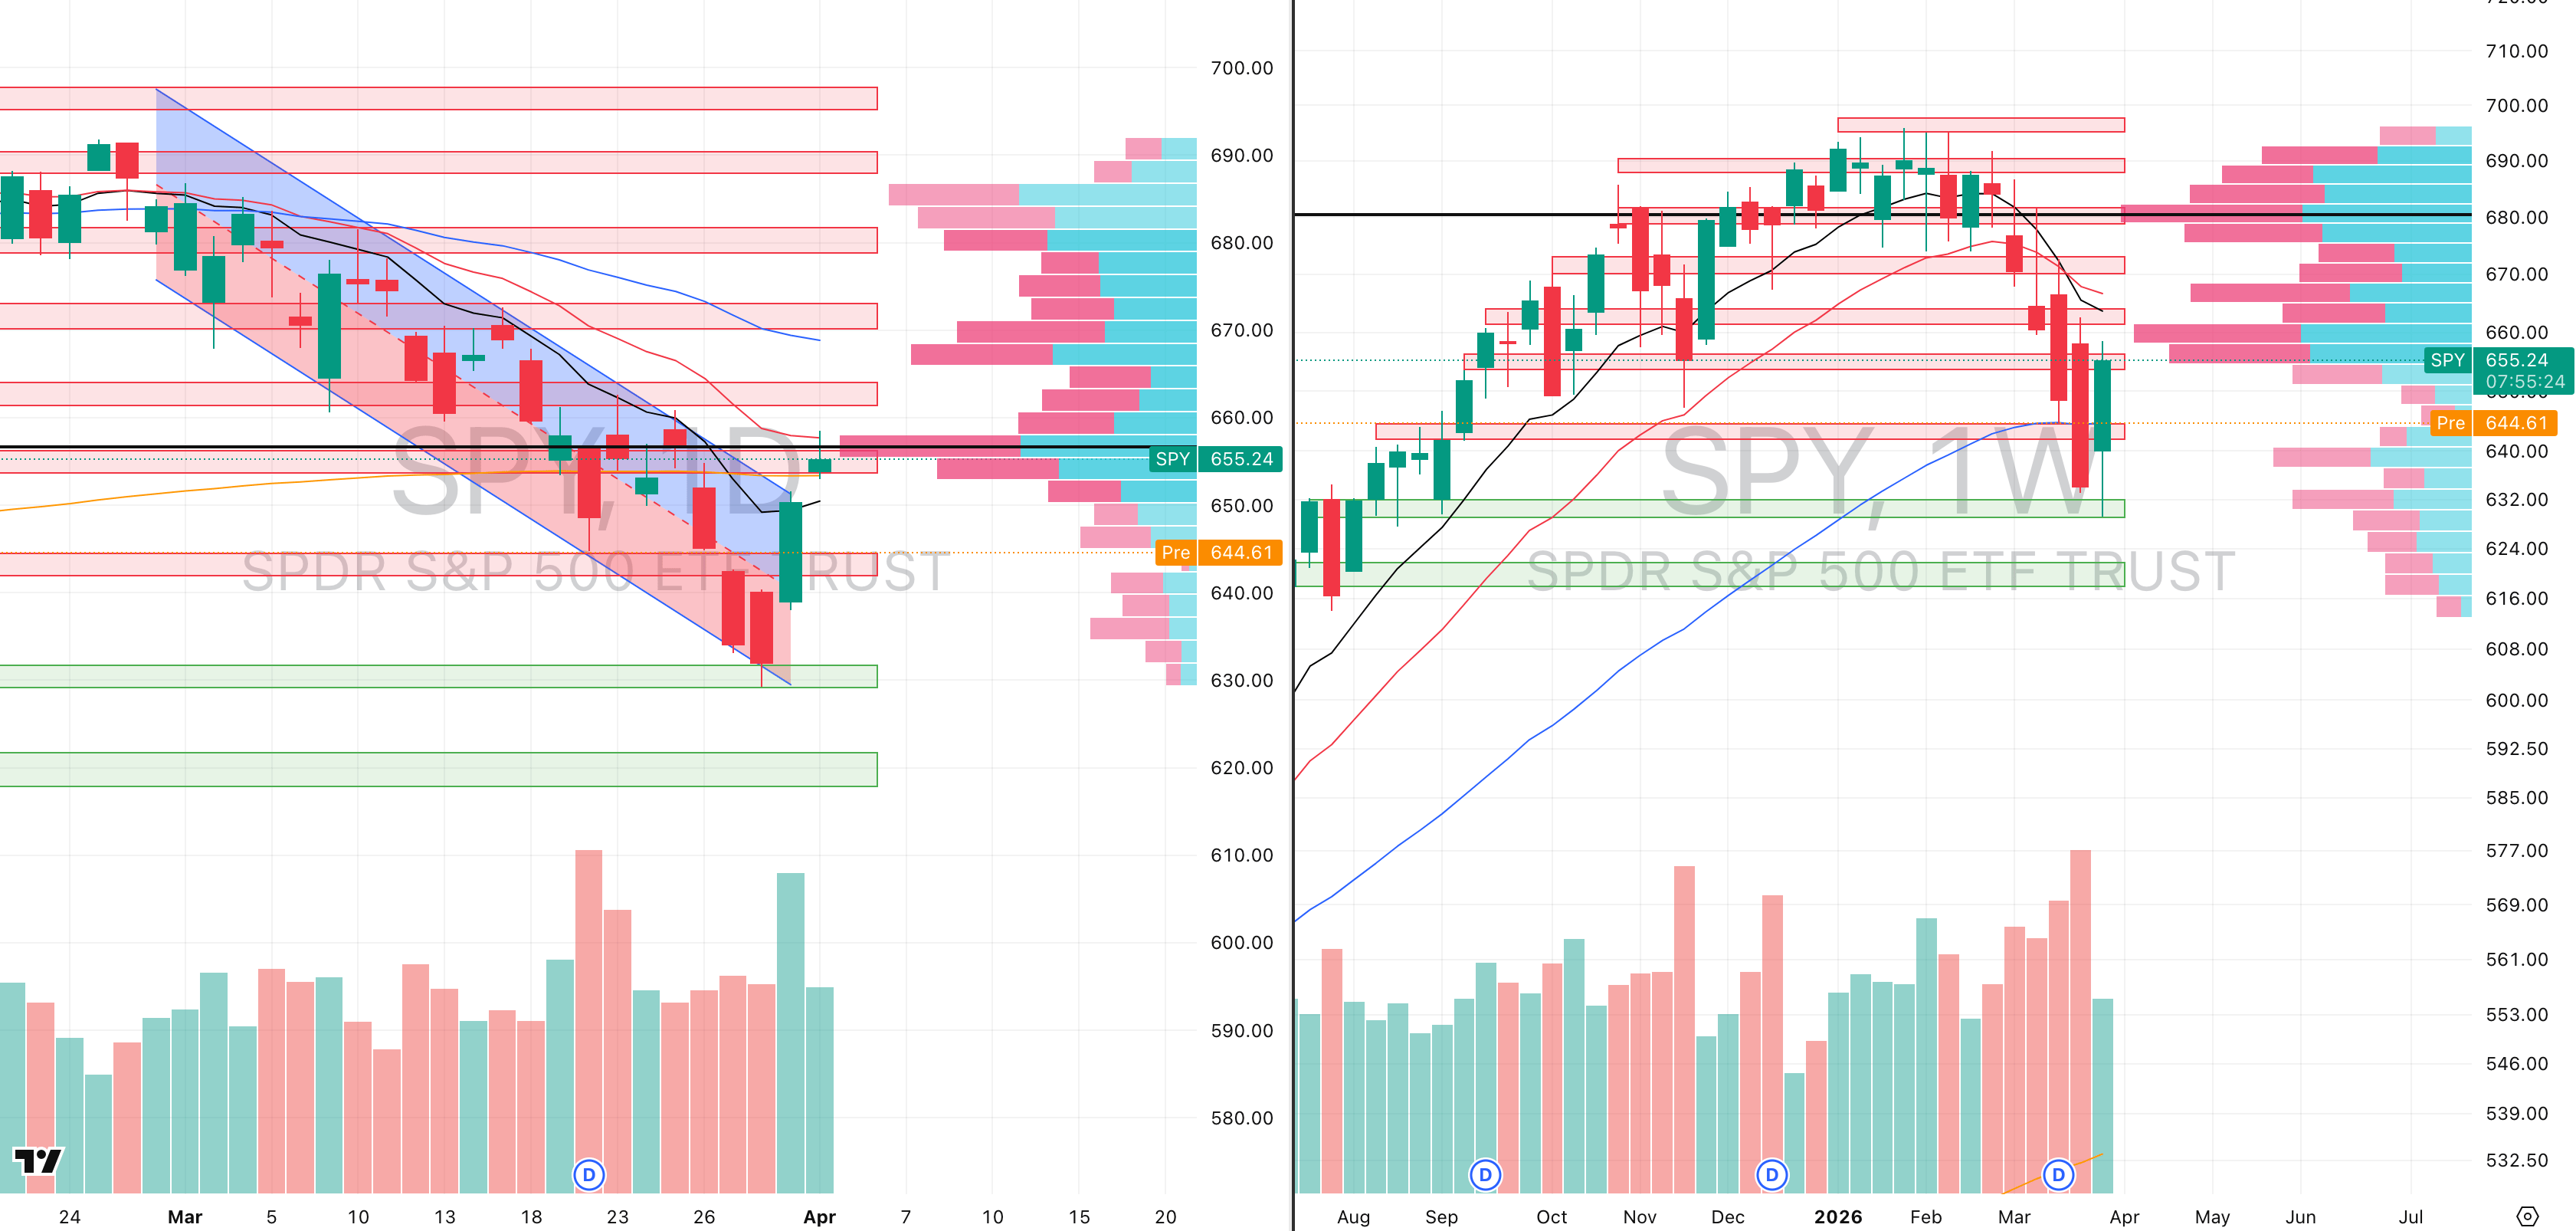
SPY VRVP Daily & Weekly Chart
45.12%: over 20 EMA | 26.24%: over 50 EMA | 47.71%: over 200 EMA
The S&P 500 is selling off almost exactly as expected after yesterday’s failed attempt to reclaim overhead supply. Price pushed into $660, which was the declining 20-day EMA, but that level rejected cleanly on 106% relative volume, reinforcing that supply remains active every time price reaches short-term moving average resistance.
What looked constructive at yesterday’s open has now reversed into a full gap-down this morning, with SPY trading around $645.36 premarket, roughly -1.53% below yesterday’s close.
That takes price directly back into the rising 50-week EMA, which remains the most important near-term support level on the weekly structure.
From our perspective, that level is likely to act as an intraday reaction point, at least initially, and could allow part of the opening gap to fill higher during the session.
The problem is volatility. With the CBOE Volatility Index up more than 13%, the backdrop does not favour strong closing strength.
Even if support appears intraday, the probability of sustained upside into the close remains limited.
Structurally, SPY still looks likely to revisit the lower edge of the regression channel, which keeps $630 as the next meaningful demand level if this weakness continues.
Nasdaq
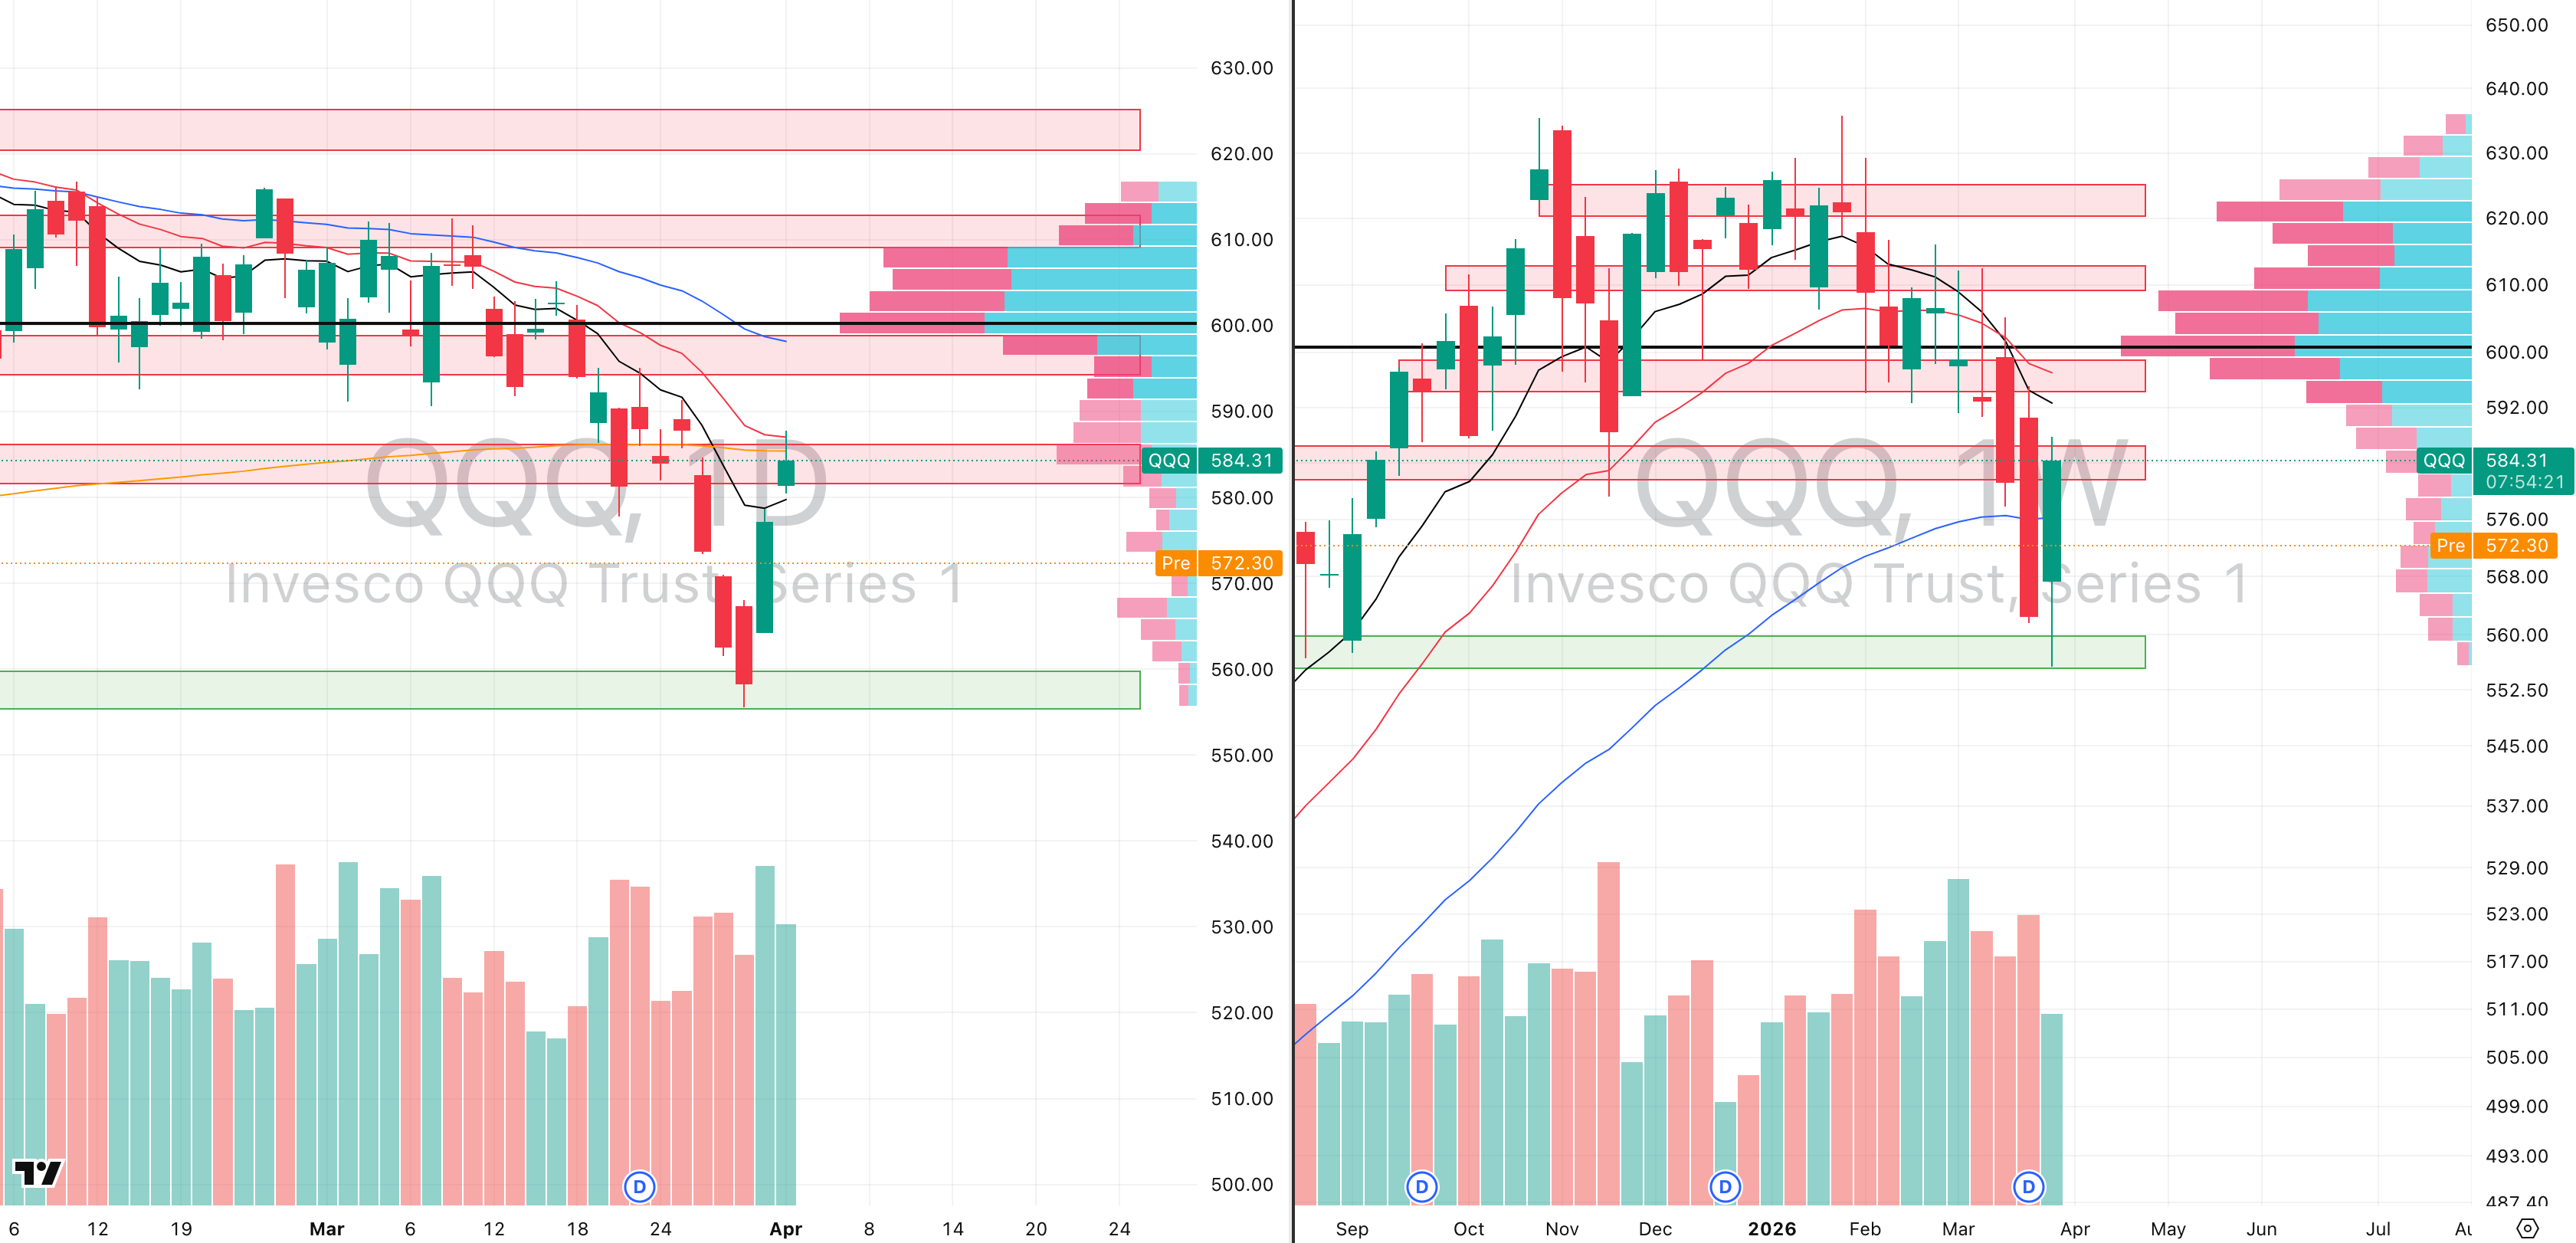
QQQ VRVP Daily & Weekly Chart
41.58%: over 20 EMA | 24.75%: over 50 EMA | 43.56%: over 200 EMA
The Nasdaq followed the same pattern, rejecting directly into the $588 zone, where the declining 20-day EMA capped yesterday’s rebound.
That rejection now leaves QQQ gapping back below the 50-week EMA, while also losing the daily 10-day EMA near $579 in premarket trade.
That is important because yesterday’s attempt at short-term stabilisation has already failed before the cash session even begins.
The next level we are watching is $560, which is the same demand zone that produced Monday’s bounce.
From yesterday’s close, that implies roughly -4.9% downside, and given how quickly technology continues to react to macro headlines, that move is entirely realistic if weakness accelerates after the open.
S&P 400 Midcap
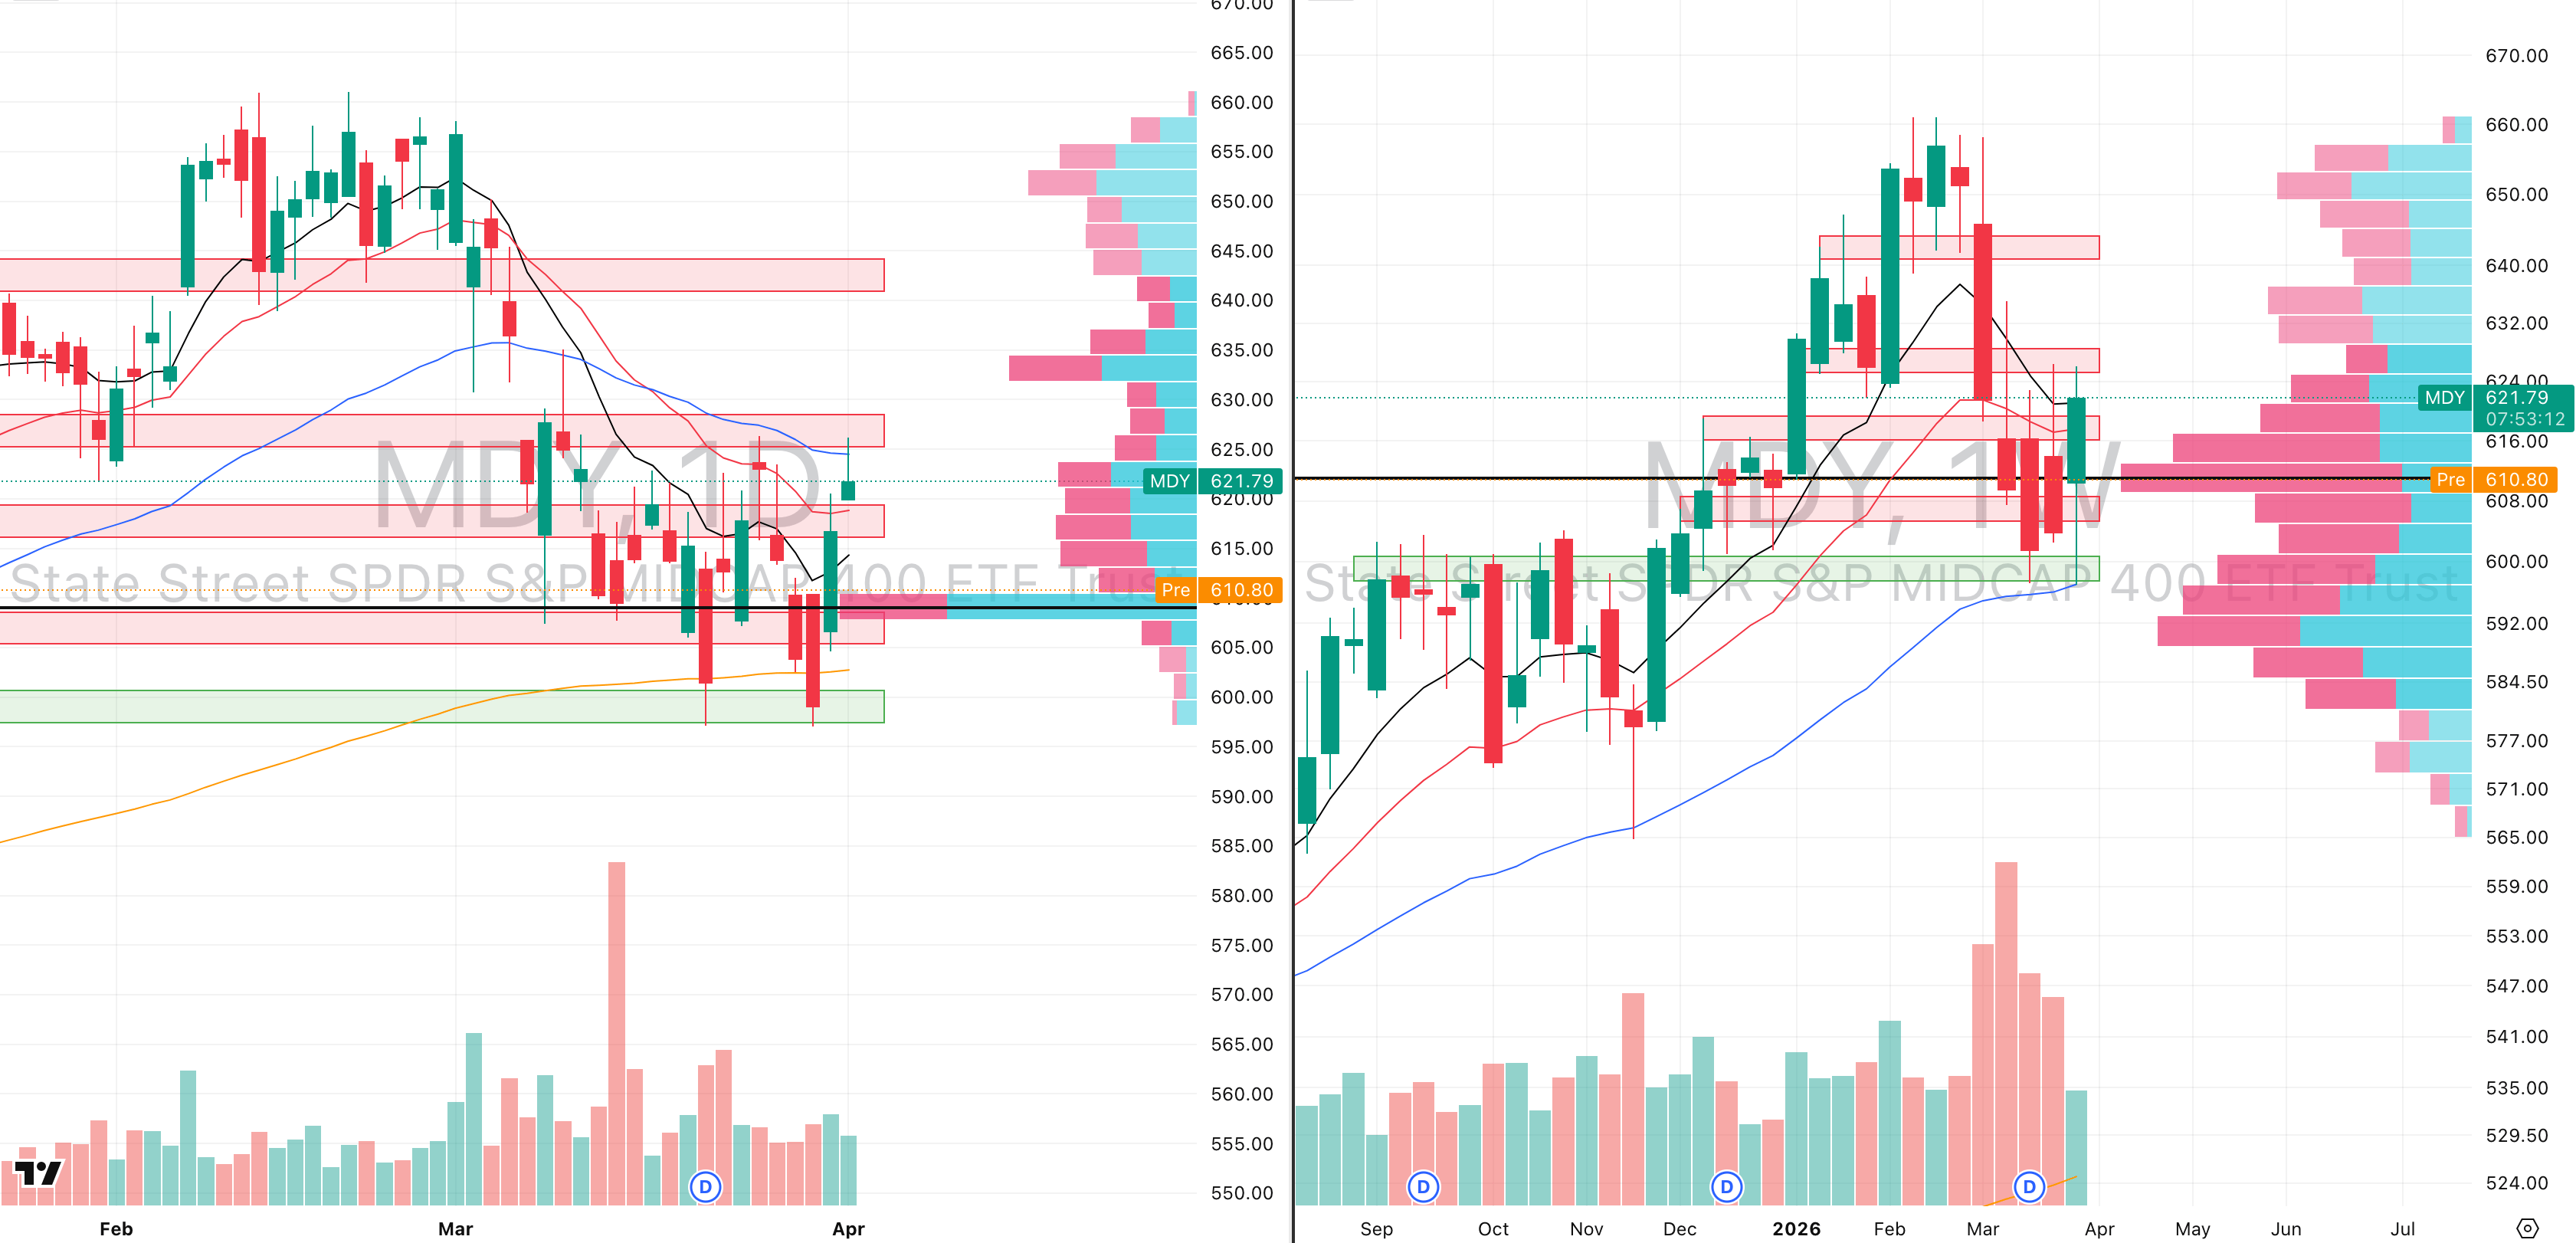
MDY VRVP Daily & Weekly Chart
53.25%: over 20 EMA | 28.25%: over 50 EMA | 48.50%: over 200 EMA
Mid-caps also rejected precisely where supply should have appeared, at the confluence of the 10-week EMA, 50-day EMA, and the $627 prior support zone.
That level mattered because it was the exact area where prior support had already flipped into supply, and again it held as resistance.
The broader weekly structure continues to support the head and shoulders top we discussed last week, with current price action still behaving like a developing right shoulder.
Yesterday’s rejection came on only 84% relative volume, but that low participation is not bullish, if anything, it reflects how little conviction exists behind the rebound.
In other words, this was simply a lack of broad participation and price is now sitting around the $609 point of control, which is the most important immediate reference level.
It will be important to watch whether that holds, but at this stage the probability still favours a deeper move back toward $597, where we have already seen two strong prior reactions — first on 20 March, then again on 30 March.
Russell 2000
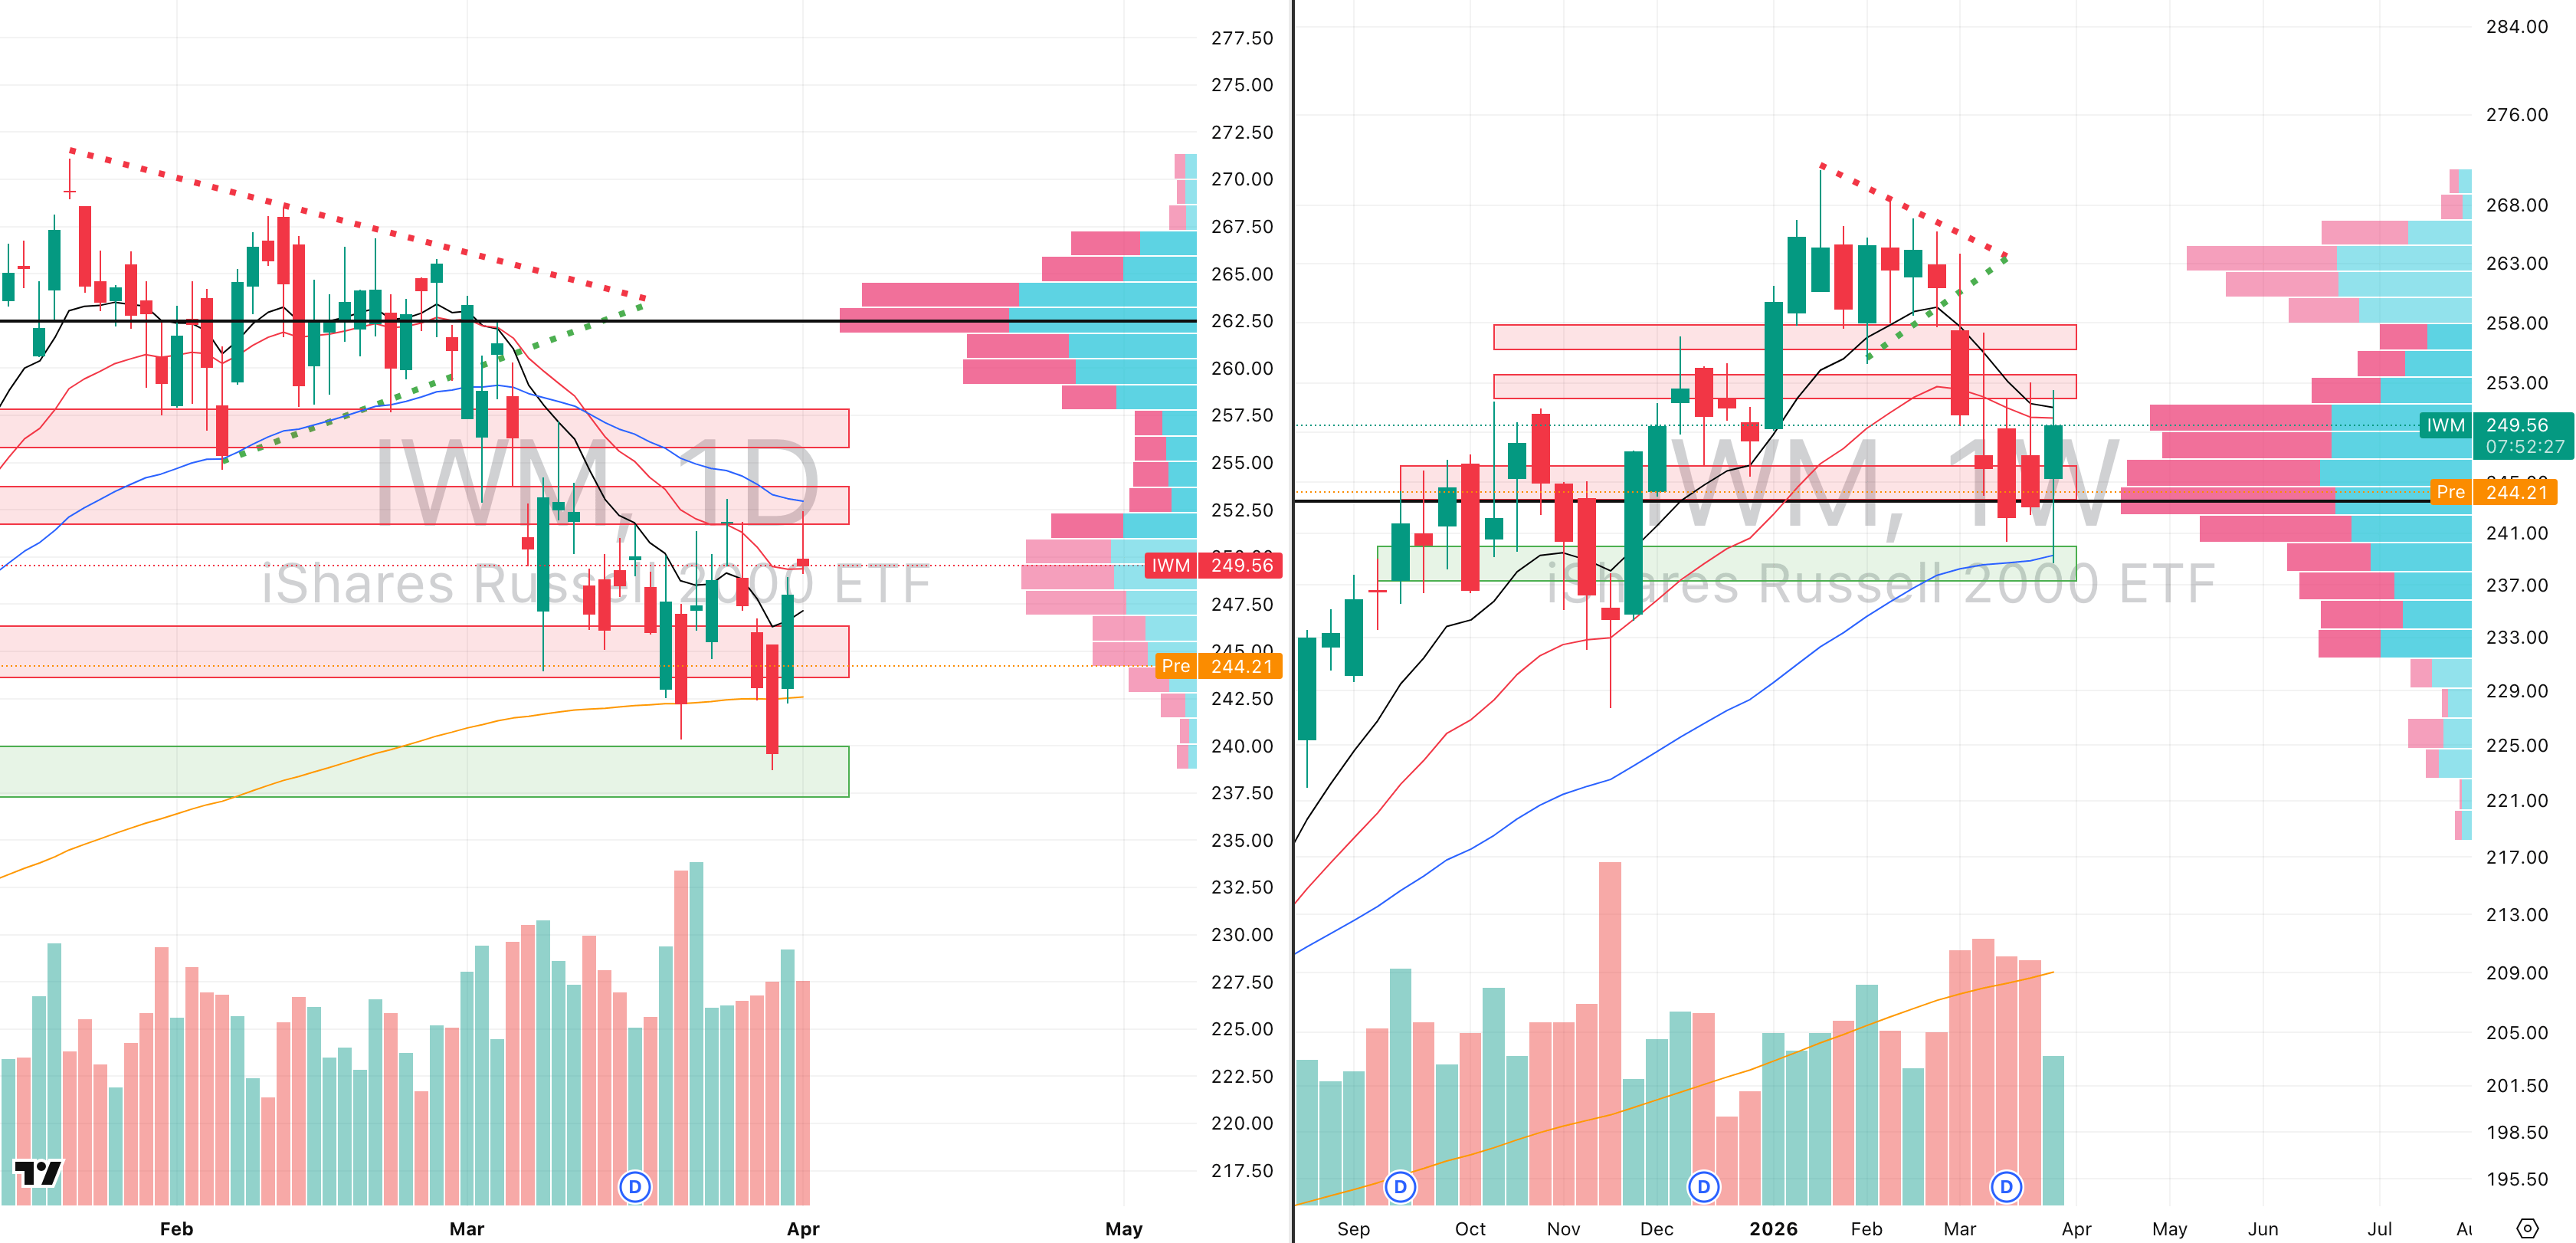
IWM VRVP Daily & Weekly Chart
54.93%: over 20 EMA | 33.57%: over 50 EMA | 49.13%: over 200 EMA
Small caps were the weakest of the four major indices yesterday, printing a full inverse red hammer and doing so on 109% relative volume, which is notable because it continues the recent trend of selling pressure reappearing faster in small caps than elsewhere.
Premarket already shows IWM testing the rising 200-day EMA near $243, and this level is critical.
The reason it matters so much is because the entire right side of the developing weekly head and shoulders structure is now sitting directly on this support.
Beneath that, the real line is the 50-week EMA at $238, which held on Monday.
If that level breaks decisively, the structure changes materially and at that point, small caps would no longer be in a volatile correction as they would begin transitioning into a much deeper primary downtrend, with the risk of a far broader bear market phase becoming much harder to dismiss.

Did you find value in today's publication?This helps us better design our content for our readers |
Reply