- Swingly
- Posts
- Stocks Rally: This is Where To Focus
Stocks Rally: This is Where To Focus

MARKET ANALYSIS
Here’s What You Need To Know
The market pushed again yesterday and, at this point, the response has clearly been more constructive than most expected. Growth led the move once again, with strong upside across software, semiconductors, and large-cap tech, while the S&P 500 finished less than 1% from its January record high and the Nasdaq posted its 10th straight gain.
The main driver is still diplomacy. Markets are choosing to believe there is a credible path back to talks, with President Trump saying the war is “very close to over” and suggesting discussions with Iran could resume within days, even though no formal schedule has been confirmed.
Oil is the reason equities have been allowed to keep squeezing higher. Crude is no longer trading the panic scenario from earlier in the week, with Brent back in the mid-$90s and below $100, which has eased the immediate inflation shock and allowed risk appetite to broaden again.
Beneath the surface, the move is still being led by the old bull-market winners. Broadcom is higher again on its expanded AI chip deal with Meta, semiconductors continue to hold firm, and Reuters notes that ASML beat earnings and raised its 2026 forecast, reinforcing that AI infrastructure demand remains a real support under the tape.
The tone is undeniably bullish, but there is still a real risk that markets are getting ahead of themselves. Kenneth Rogoff warned today that investors are being “naive” if they think this is mission accomplished, arguing that the war is still a stagflationary shock and that the medium-term pressure on rates is higher, not lower.
That caution is important here because the blockade is still fully in place and Iran is now threatening disruption beyond Hormuz if pressure continues. So while equities are behaving as if the endgame is negotiation, the underlying geopolitical structure is still fragile.
For now, though, the market is trading the tape in front of it: lower oil than panic highs, improving growth leadership, and earnings that are coming in solid enough to support the move. T
hat is why we are seeing such strong upside across the growth complex, even if the macro backdrop is not nearly as clean as price action makes it look.
S&P 500
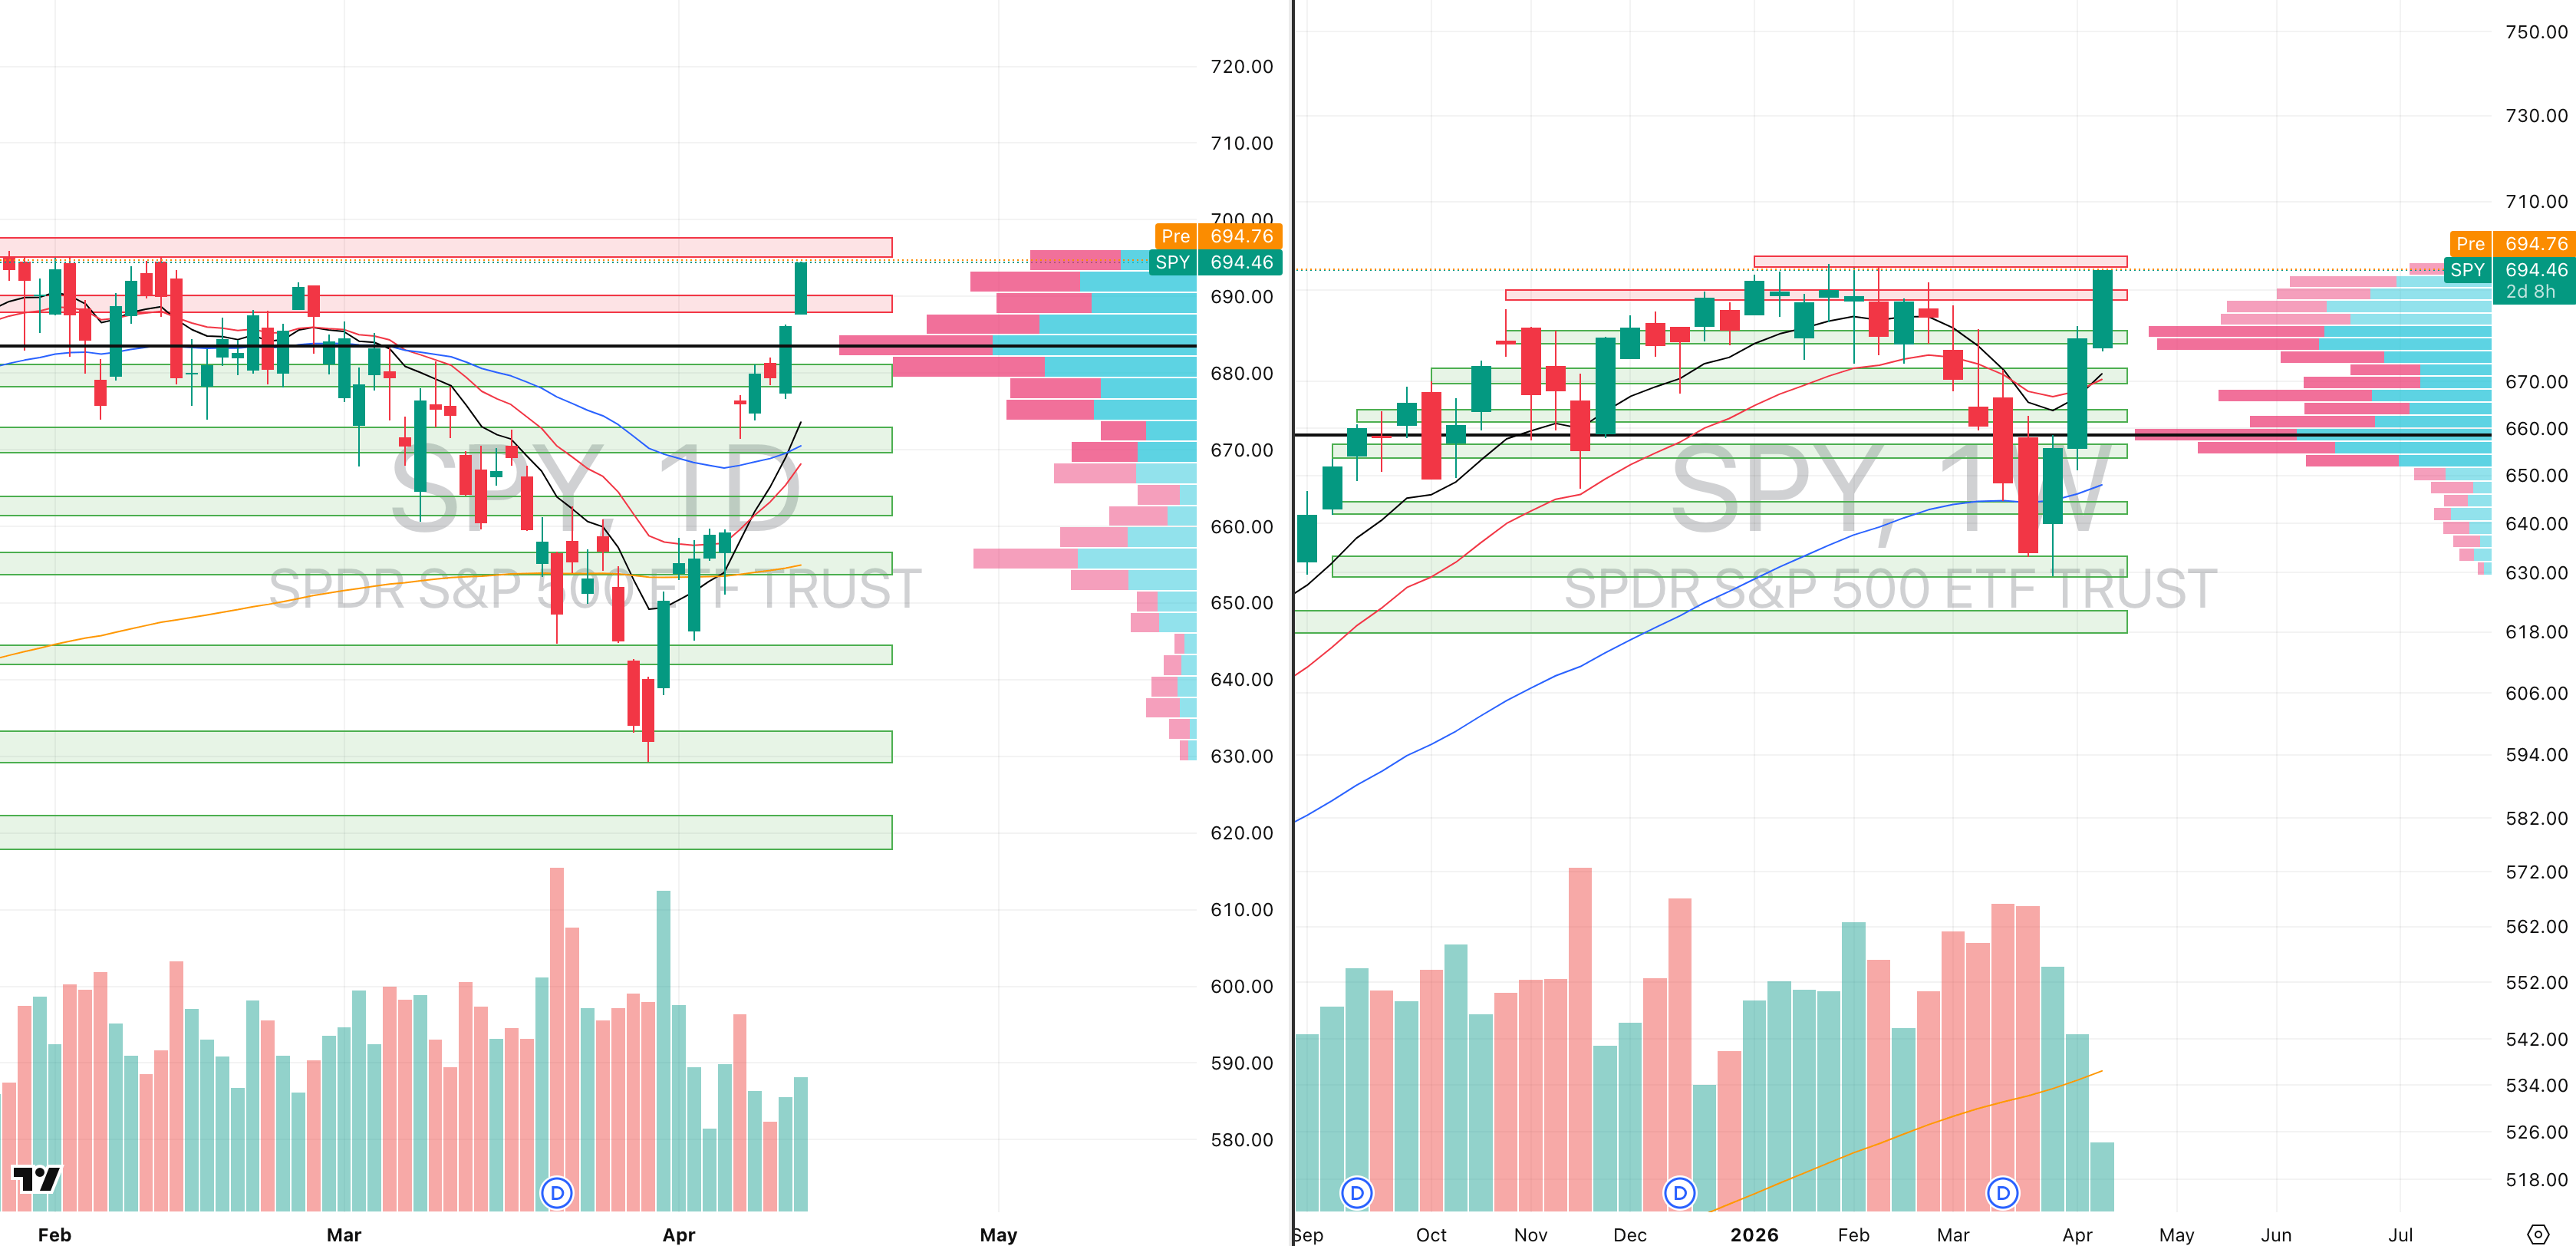
SPY VRVP Daily & Weekly Chart
72.96%: over 20 EMA | 52.08%: over 50 EMA | 56.66%: over 200 EMA
The SPY had a very impressive session yesterday, moving almost exactly 1 ADR, with a 1.22% intraday move against a normal 1.26% ADR.
More importantly, this was the first genuine uptick in relative volume we have seen since the bounce off $630 began on 30 March.
That said, participation is still objectively light. Daily relative volume was only 72% of the 20-day average, and this week we have traded only around 30% of normal 20-week volume so far.
That still leaves the move vulnerable to a sharp pullback, especially if oil stabilises and turns back up or if the administration’s current damage-control tone around the Middle East starts to fade.
From a pure price perspective, however, the tape continues to impress.
The SPY is now cutting through prior supply zones one after another, and those same levels are beginning to flip into support every few sessions.
We have already seen price hold above the gap-up zone, reclaim $687, and then push directly through a prior supply level that had 112 days of rejection history.
That is not weak price action at all but the volume still needs to improve, at this stage the short thesis is clearly becoming harder to defend while price keeps accepting higher levels.
Nasdaq
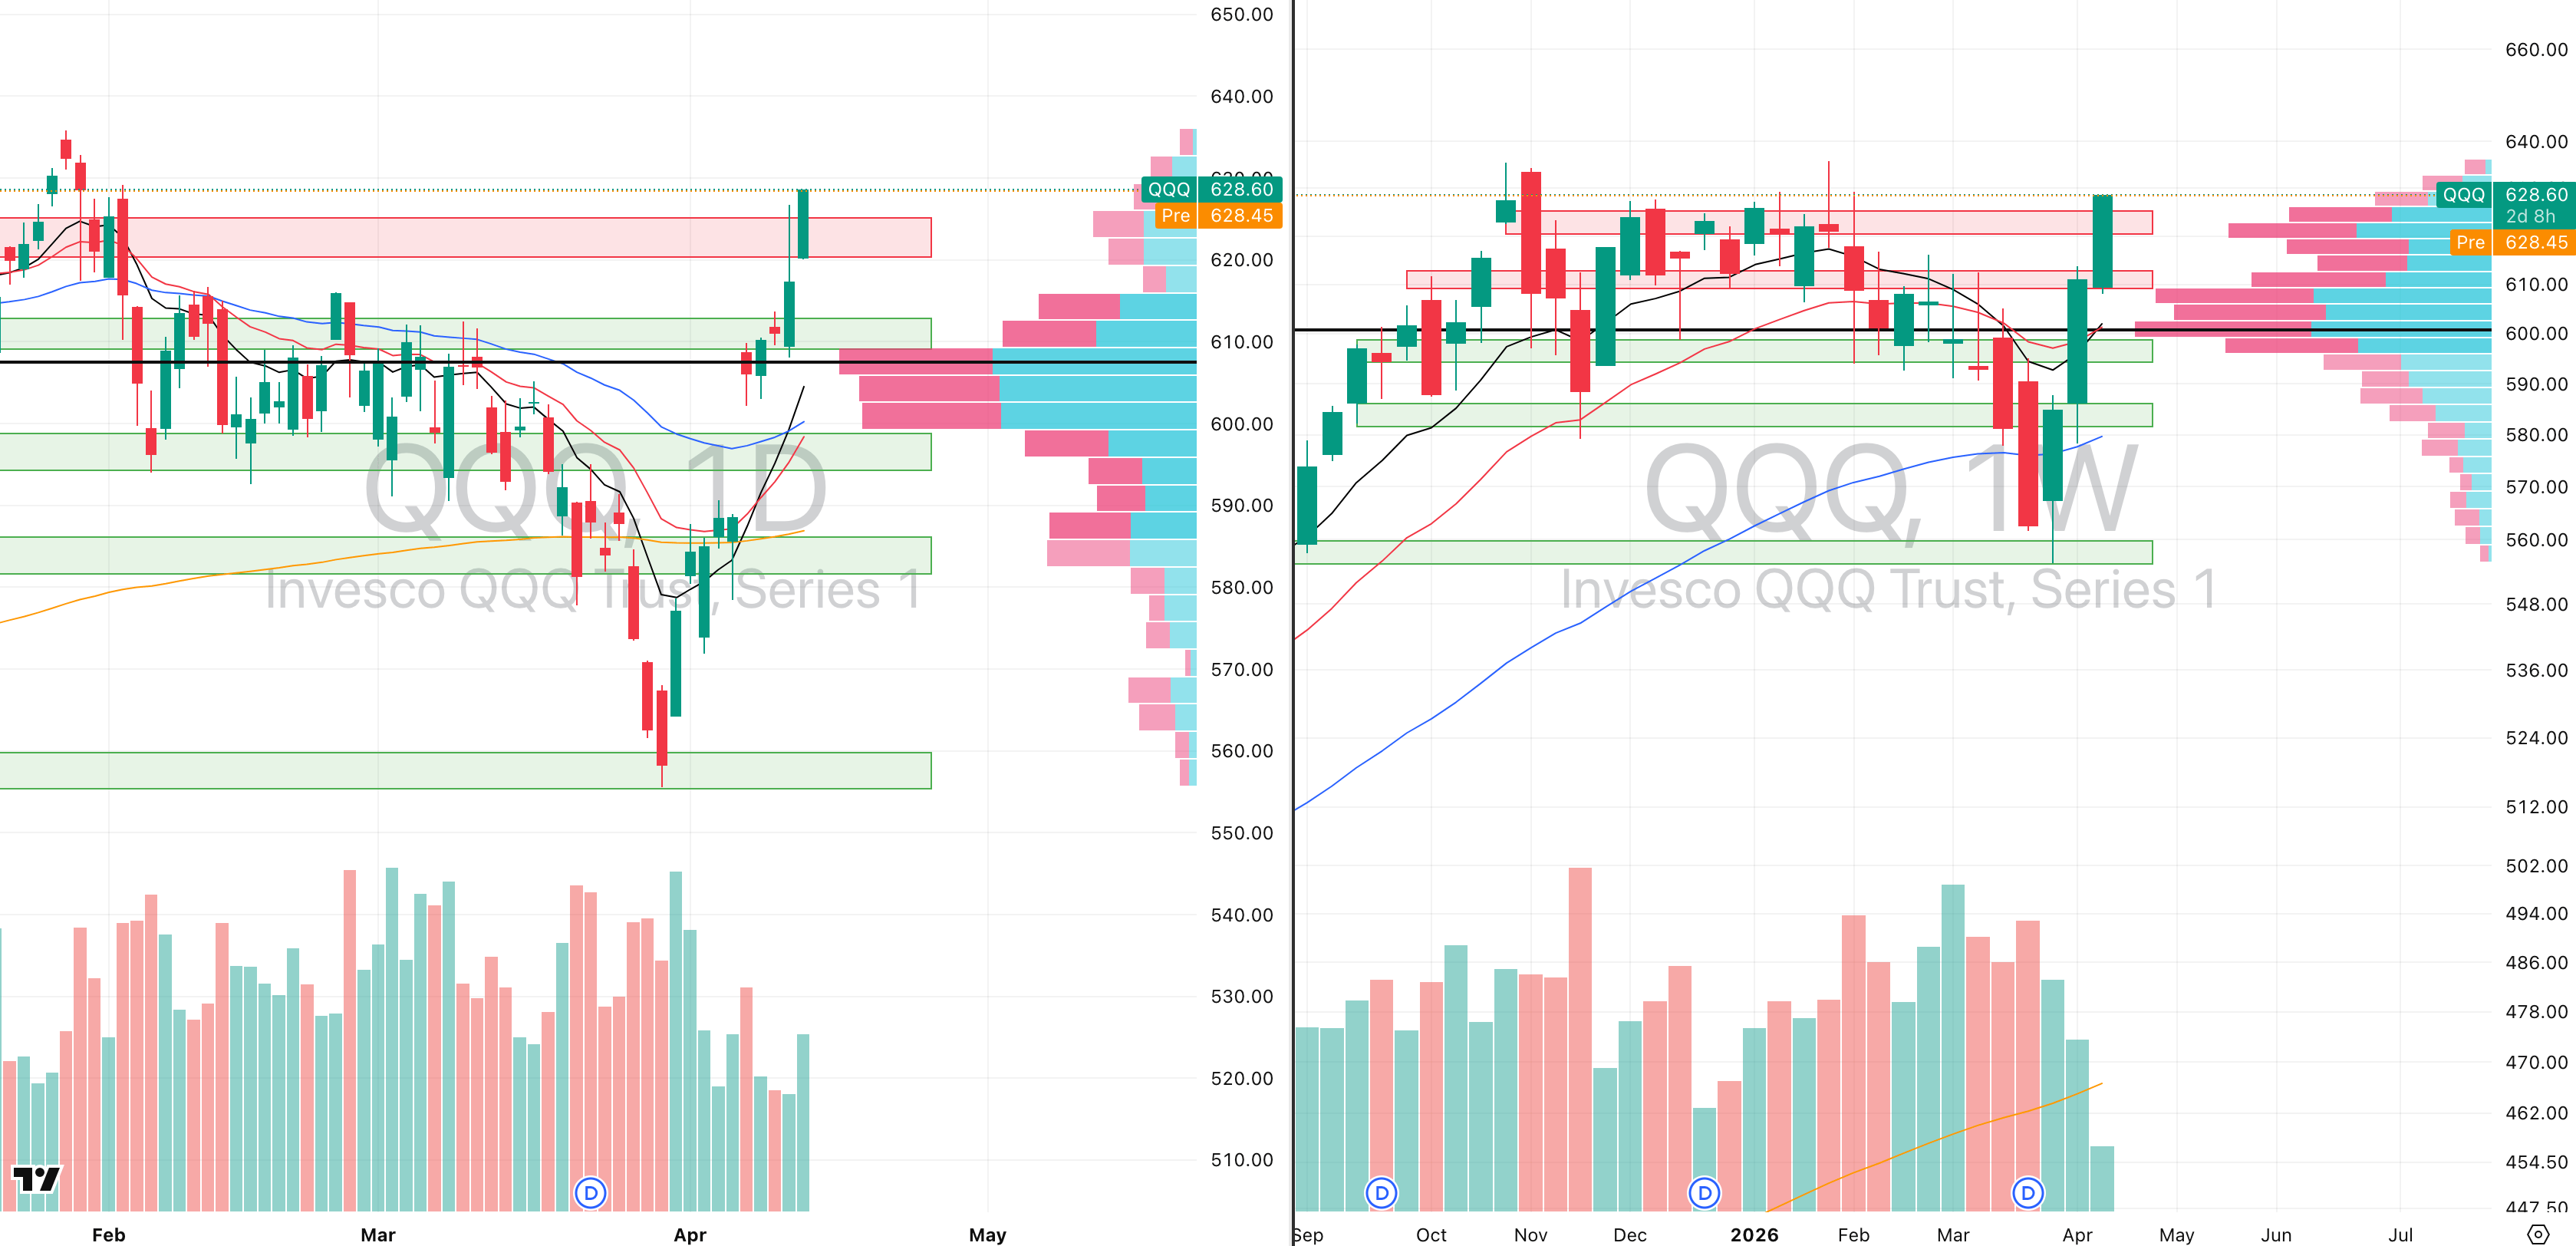
QQQ VRVP Daily & Weekly Chart
70.29%: over 20 EMA | 50.49%: over 50 EMA | 48.51%: over 200 EMA
The Nasdaq saw a stronger increase in participation yesterday, with relative volume running roughly 30% above the previous three sessions, although it still only reached 74% of the 20-day average.
So participation remains light in absolute terms, but relative to the rest of this bounce it was a clear step up.
This is very obviously where the strength in the market is coming from and the QQQ is being driven by the same underlying leadership we are seeing in the MAGS complex and other large-cap tech names, and that in turn is what continues to drag the SPY higher.
From a momentum perspective, the QQQ is now sitting around 2.6 ATR multiples above its 50 EMA, versus the SPY at roughly 2.1 ATR multiples, which shows the clear short-term outperformance.
It is also now only about -1.1% from all-time highs, which reinforces just how strong the rebound has been.
The best long entries were obviously earlier — first off the inverse head-and-shoulders break around $590, and even better off the deeper support reclaim.
At this stage, the QQQ is less interesting as a fresh breakout vehicle and more important as a proxy for large-cap growth, which in our view is very much back onside for long exposure.
S&P 400 Midcap
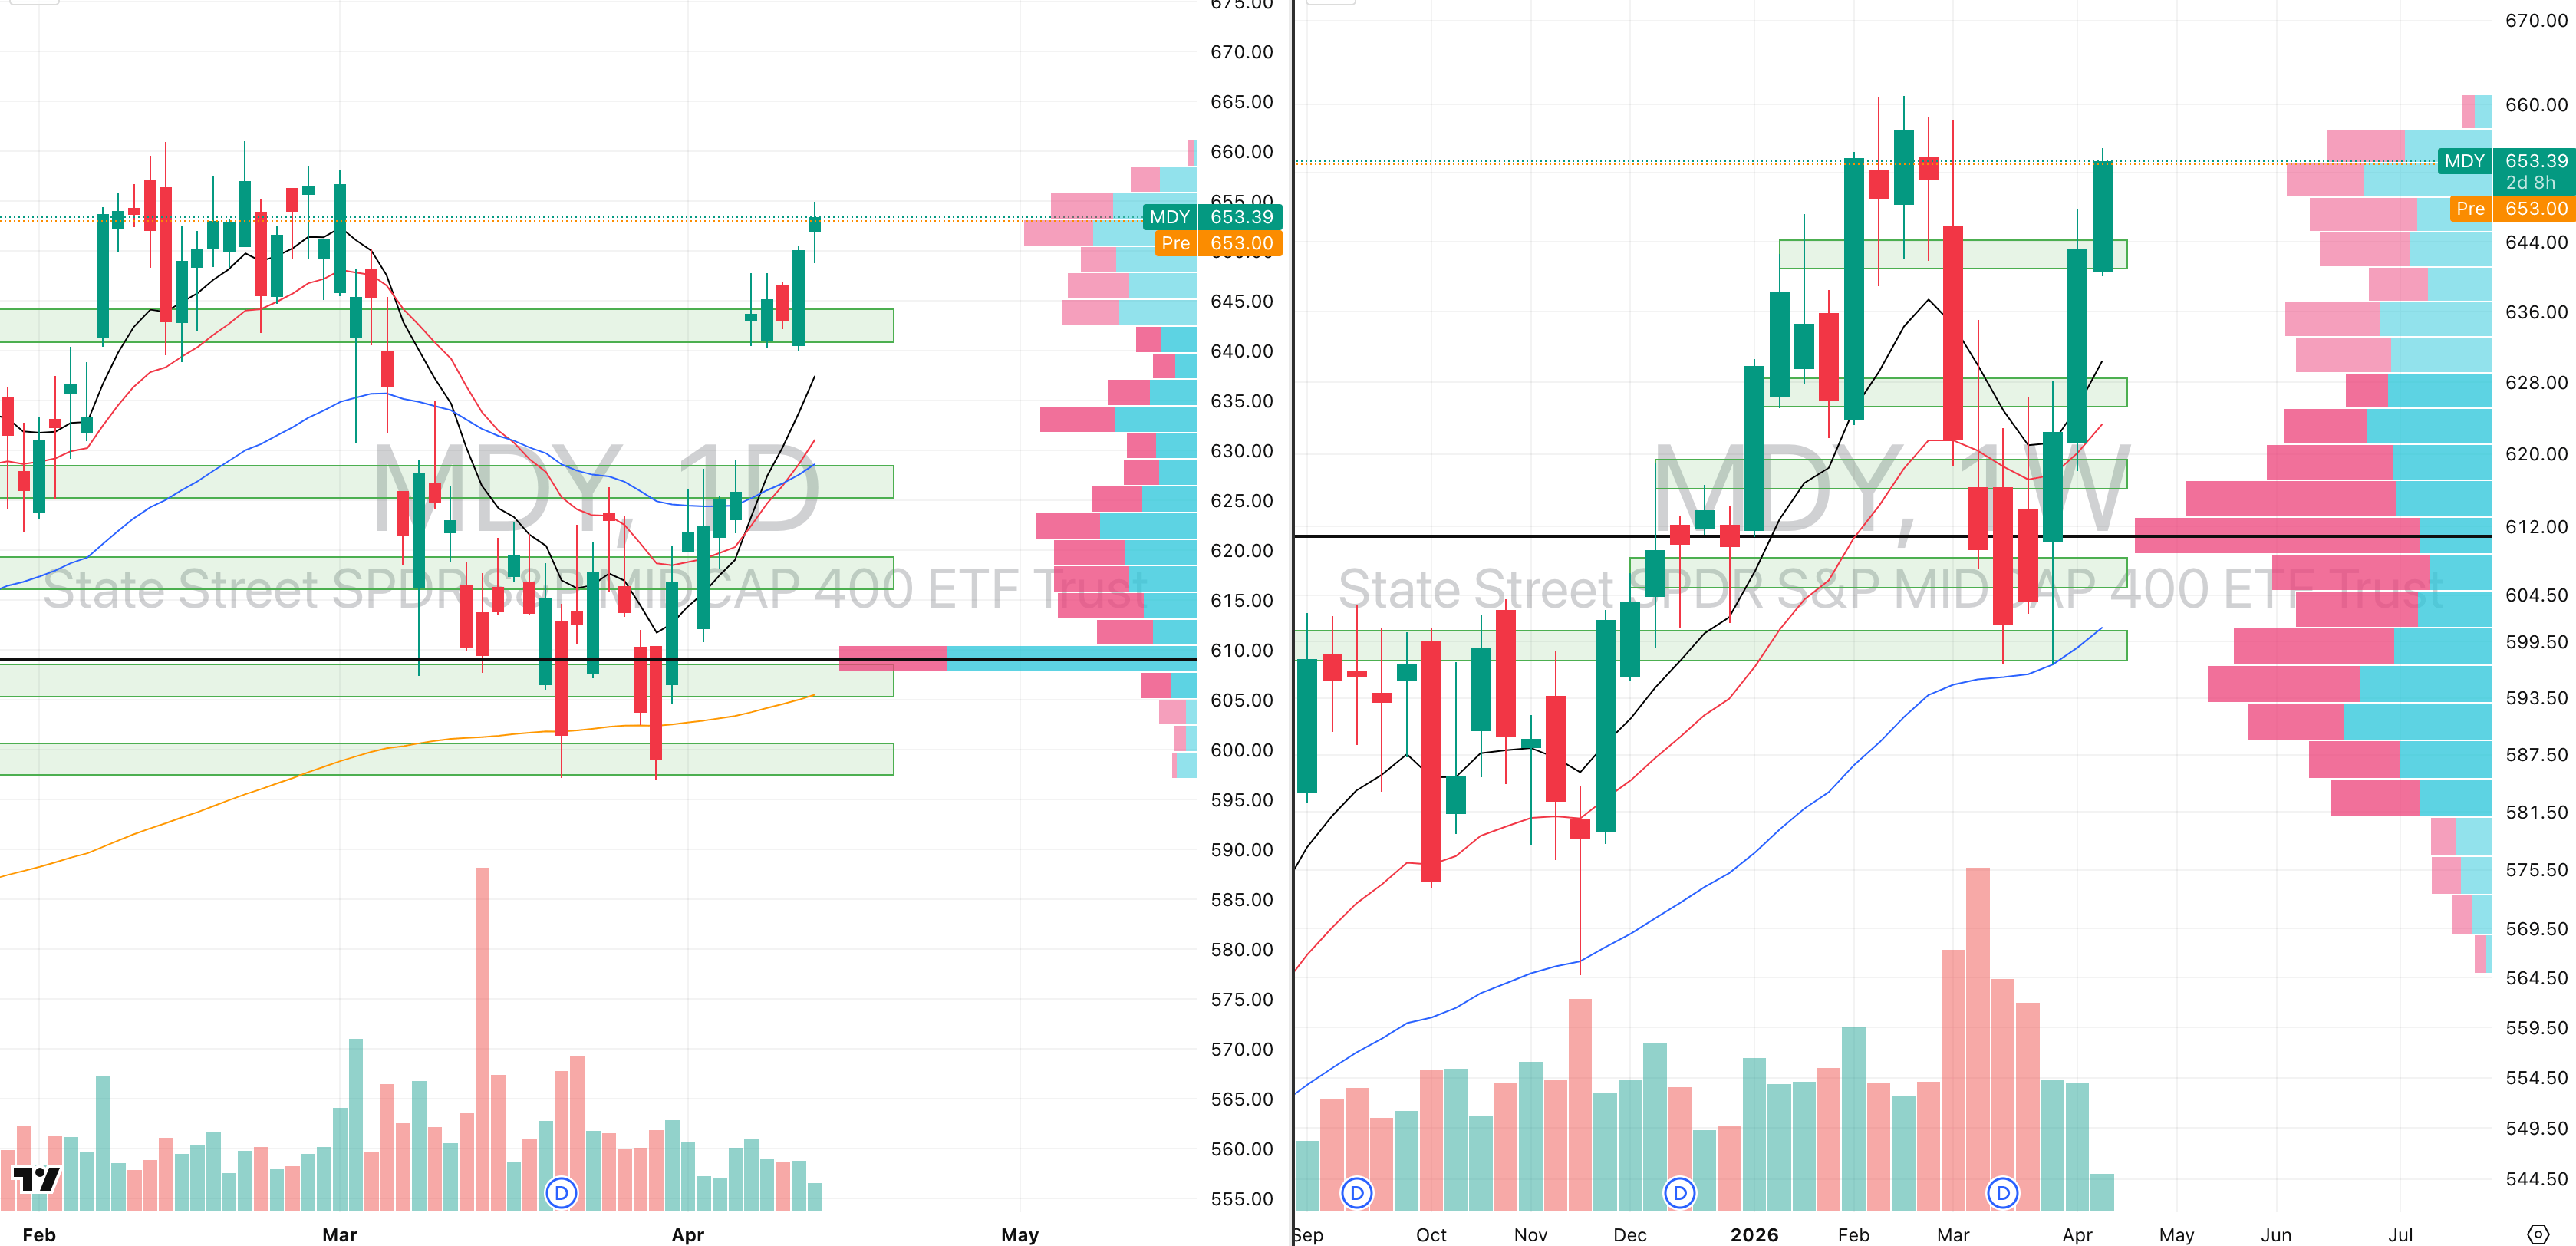
MDY VRVP Daily & Weekly Chart
81.25%: over 20 EMA | 59.00%: over 50 EMA | 60.50%: over 200 EMA
Mid-caps showed the first real hesitation yesterday, with a brief pullback and rejection from the $655 supply level.
That area matters because there are some trapped buyers building there, with roughly 700,000 shares traded green versus only 388,000 red, which is beginning to create an obvious supply pocket.
We are also still seeing a very sharp decline in relative volume over the last month even as price has continued to push.
That matters more here than in the QQQ because MDY is now trading only around -1.2% from all-time highs, which means it is running directly into obvious overhead supply with weaker participation.
Russell 2000
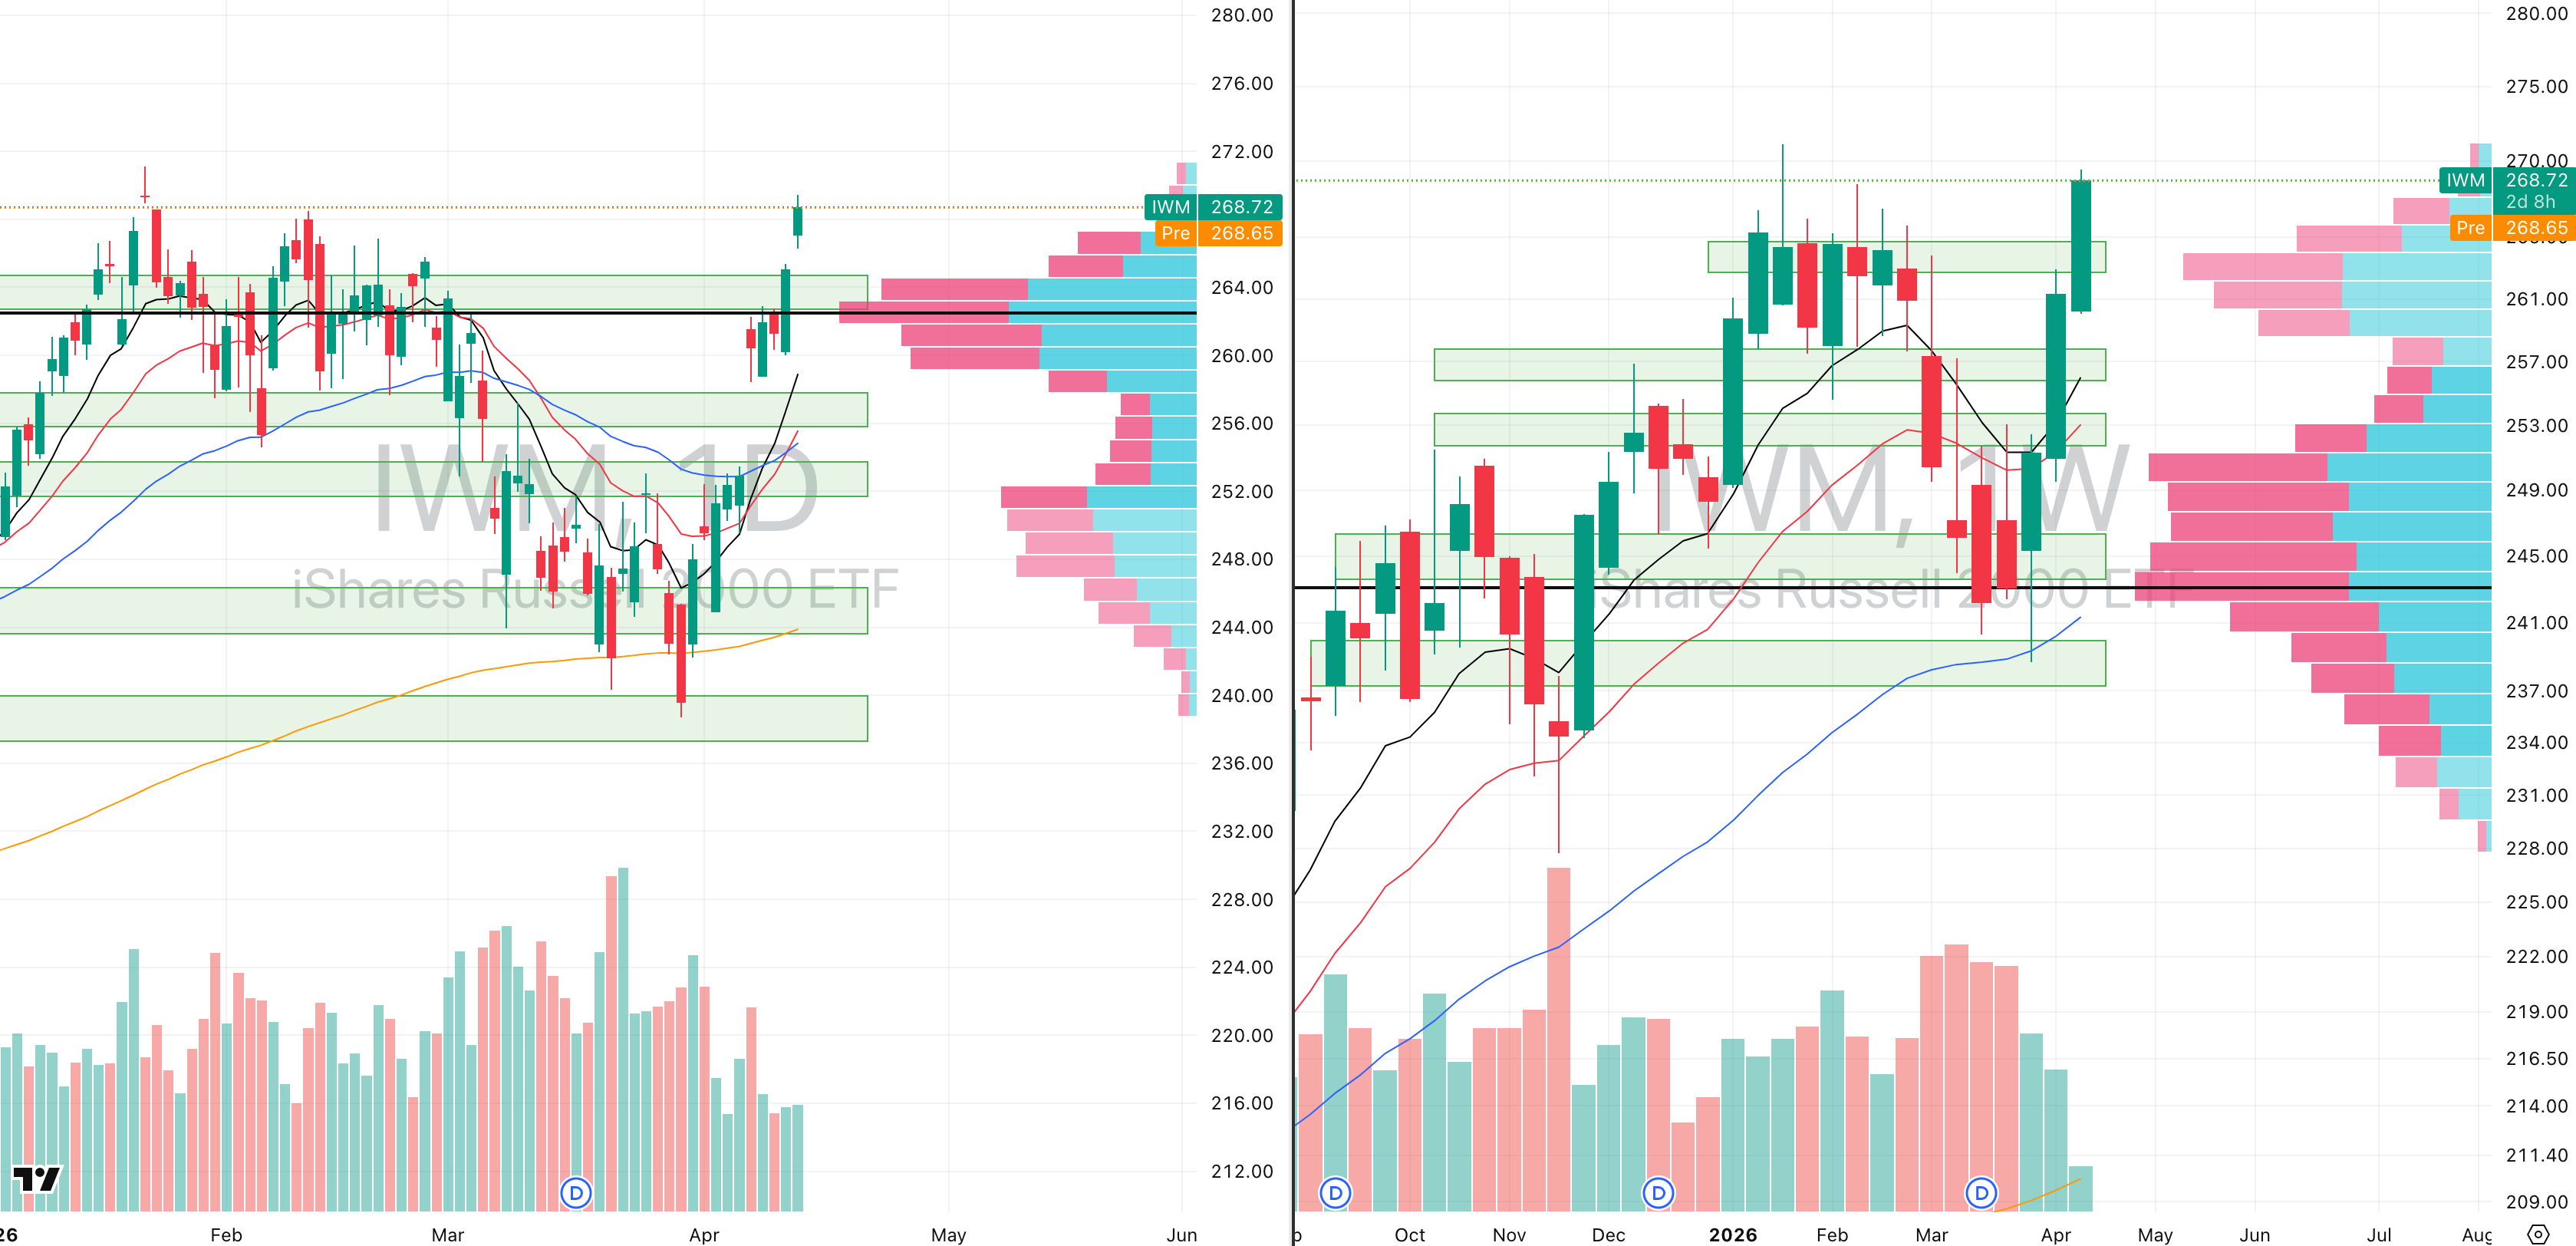
IWM VRVP Daily & Weekly Chart
83.35%: over 20 EMA | 63.70%: over 50 EMA | 58.76%: over 200 EMA
Small caps are still the strongest area of the market right now and the IWM is now only around -0.9% from all-time highs, which makes it the strongest of the major indices from a relative-performance standpoint.
We are also seeing the biggest candle ranges relative to each index’s own ADR, including yesterday’s large gap-up and continuation move.
Relative volume remains the one caveat, because participation is still declining rather than expanding.
But price leadership matters, and right now the IWM is very clearly the momentum-leading index.
That is important because small-cap growth is the bread and butter for a huge number of swing trading and momentum systems.
When small caps begin to lead like this, it usually acts as one of the cleaner risk-on proxies in the whole market.
So even with the volume caveat, this is currently the index showing the clearest momentum leadership.
FOCUSED STOCK
AEVA: A 294 Day Semiconductor Base
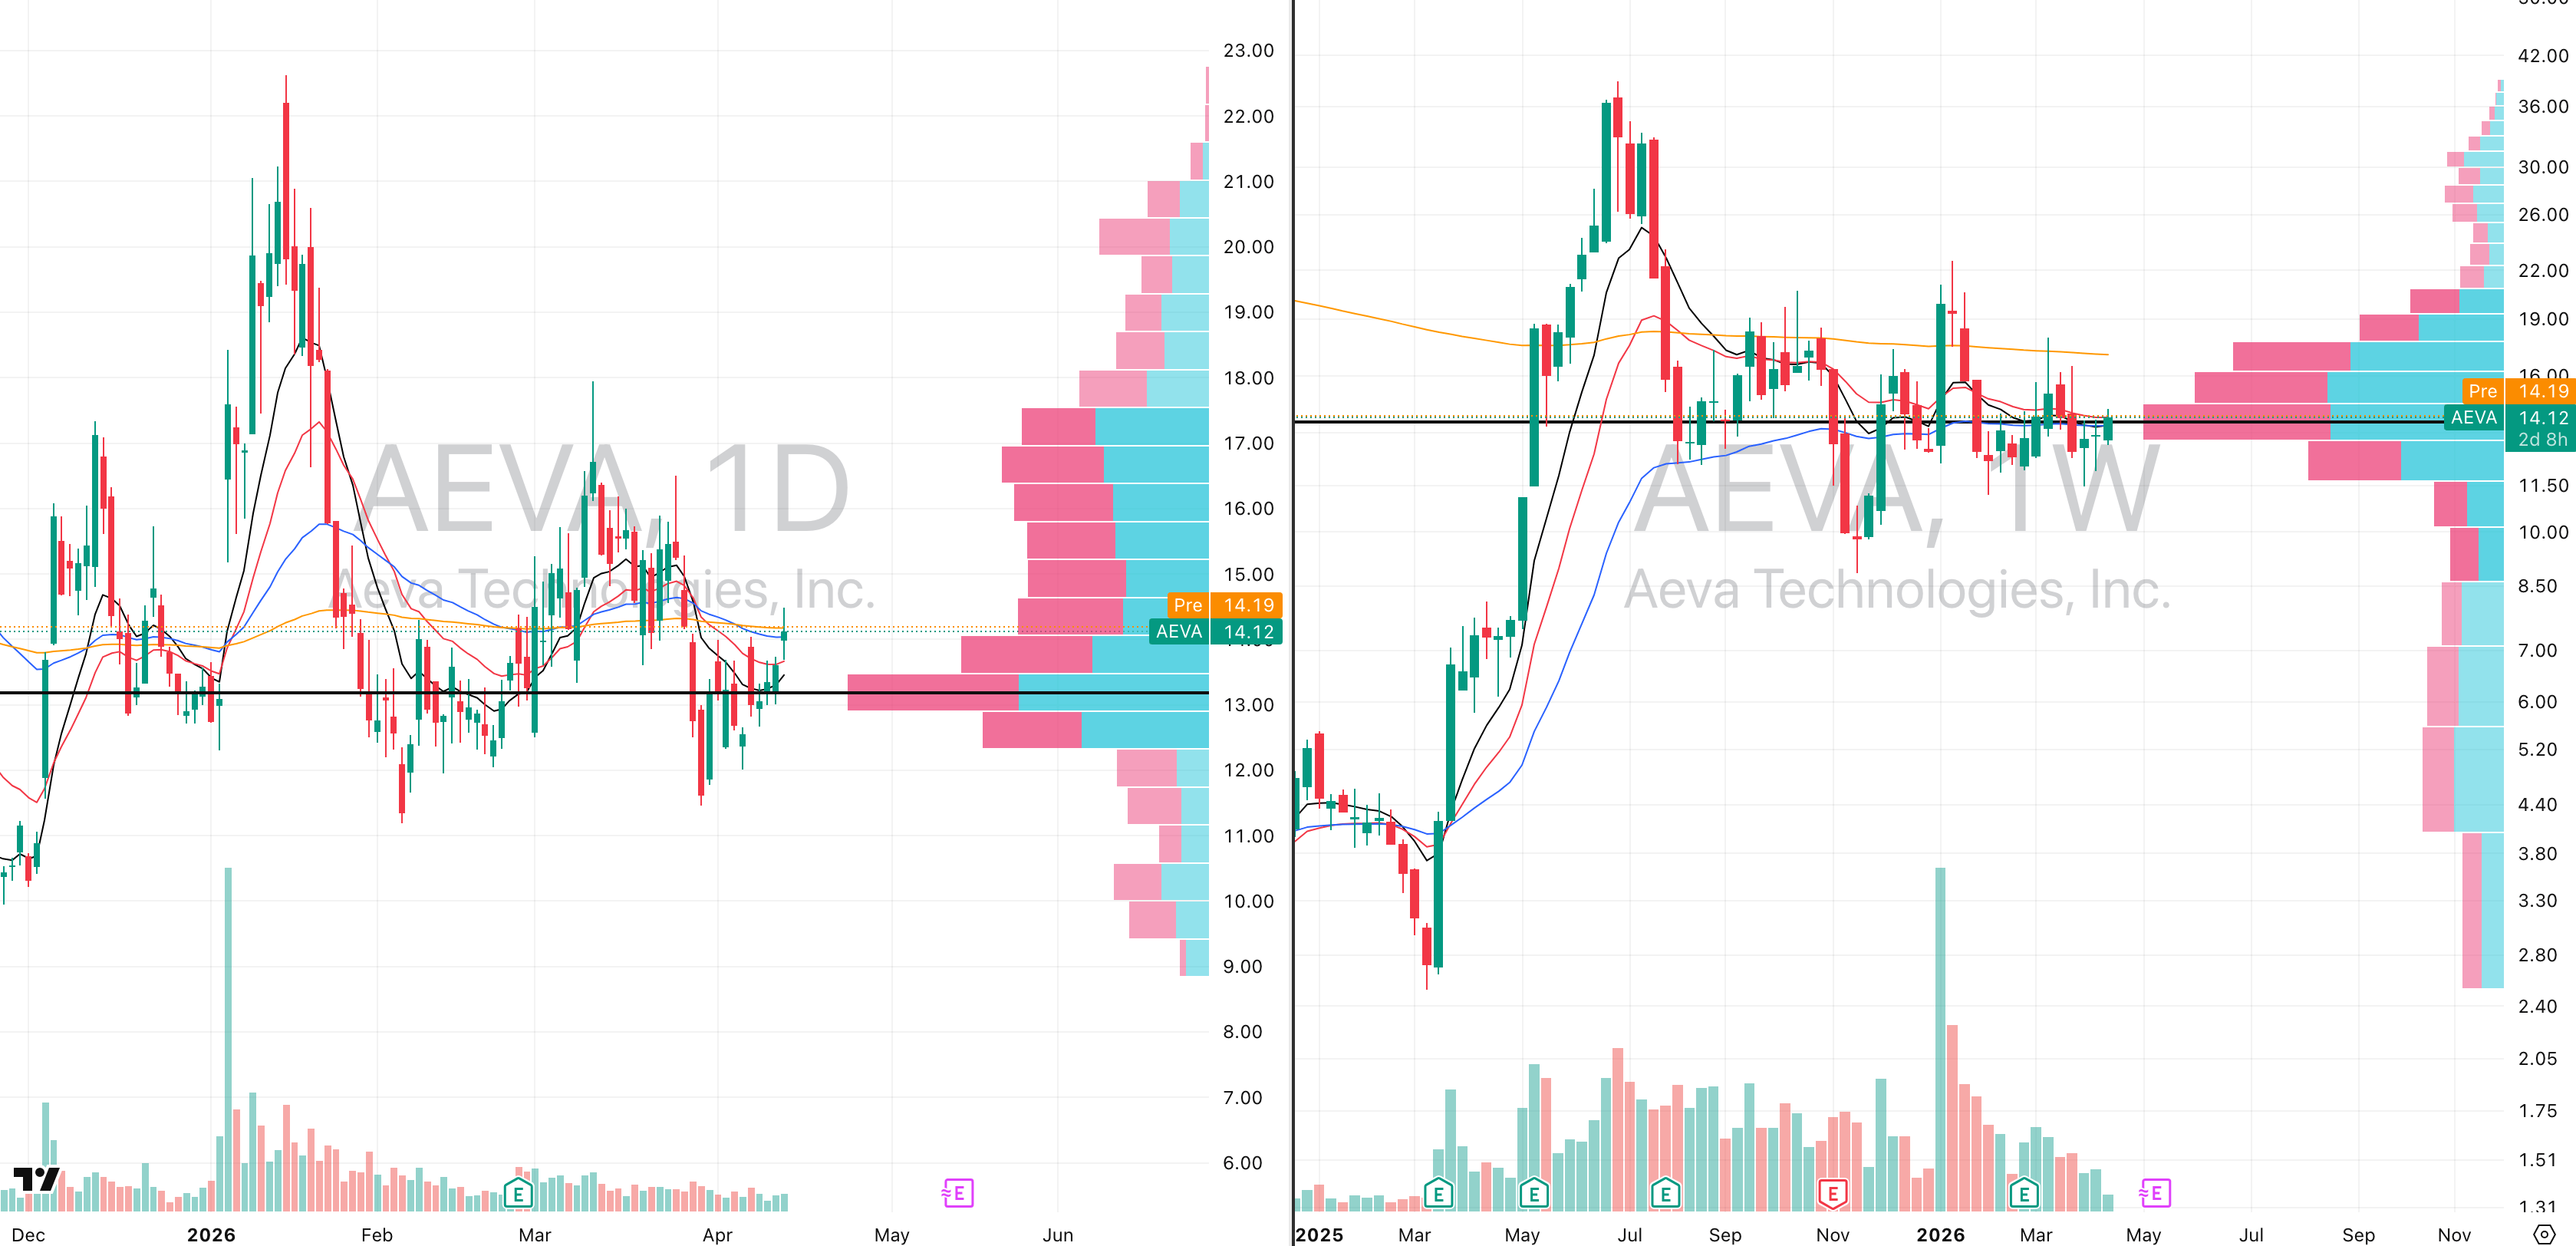
AEVA VRVP Daily & Weekly Chart
ADR%: 8.86% | Off 52-week high: -63.6% | Above 52-week low: +131.5%
AEVA is one of the more interesting setups developing inside the semiconductor space, which remains one of the strongest industry groups in the market right now.
Structurally, the stock has been forming rising higher lows since November 2025, while at the same time printing lower highs, which is classic volatility contraction behaviour.
In other words, price is compressing exactly as you would expect inside a developing VCP (Volatility Contraction Pattern).
That matters because the best VCPs usually appear when leadership groups are already strengthening underneath the surface, which is exactly what we are seeing across semiconductors.
Relative volume has also been declining consistently through 2026 as price tightens, which is another feature of constructive contraction rather than aggressive distribution.
The broader base is now 294 days old, meaning AEVA has spent almost a full year building this structure.
We are also now seeing a clear double bottom around the $11–12 area, which reinforces that real demand has repeatedly stepped in at the same zone.
The immediate technical trigger is the 200-day EMA near $14.15, which price is now attempting to reclaim.
If that level clears cleanly, the next focus becomes whether price can begin accepting above the breakout highs.
From an execution perspective, the highest-quality entries usually come on the first candle that takes out the opening range high, assuming the breakout is holding.
If being aggressive, a 5-minute opening range trigger can be used, with risk placed under the daily low.
If being more selective, a 30-minute opening range trigger generally improves efficacy by reducing the probability of immediate stop-out.
In either case, the cleaner approach is to keep stops under the breakout candle low, not the full daily low, so the stop distance remains tight.
Ideally, the stock should not already be extended more than 0.5 ADR% before entry, because once that threshold is exceeded the asymmetry usually deteriorates quickly.

Did you find value in today's publication?This helps us better design our content for our readers |
Reply