- Swingly
- Posts
- Stocks Look Strong, Not Weak
Stocks Look Strong, Not Weak
In partnership with
OVERVIEW
Rotation Into Small & Midcaps Is Real
📉 Mega-Cap Tech Weakens
The QQQ posted the weakest session across all major indices, with big tech showing clear signs of exhaustion ahead of earnings. Volume patterns suggest elevated profit-taking, not panic.
📈 Small & Midcaps Lead Breakout Attempts
Meanwhile, MDY and IWM both showed relative strength, bouncing off demand zones on healthy structure. Rotation down the market cap curve is gaining steam.
📊 Breadth & Internals Still Constructive
Net New Highs (NH/NL) and VSI remain supportive. The bull case broadens if small caps confirm through $226 and MDY clears its range.
⚠️ Watch the Divergence
This isn’t risk-off- it’s risk-rotating. Leaders are changing. If you’re concentrated in mega-cap tech, tread carefully. If you’re positioned in growth mid/small caps, stay alert for breakout triggers.

MARKET ANALYSIS
Rotation, Risk, and Relief

Markets whipsawed yesterday, not just in price, but in narrative. For the first time this rally, we saw real rotation out of mega cap tech. It caught many traders off guard.
But beneath the surface, it was a classic bear trap: sharp morning selling reversed into a strong end-of-day bounce, confirming that dip-buyers remain firmly in control.
📰 Geopolitical Relief
The U.S. finalized a major trade agreement with Japan, dialing back tariff threats. Instead of a 25% duty, imports from Japan will now face a 15% tariff. In exchange, Japan pledged $550B in U.S. investment which is a notable show of cooperation.
Why it matters:
Markets are forward-looking. Lower tariffs ease pressure on margins and global supply chains. With EU and India negotiations still lagging, this deal adds welcome stability to the macro backdrop.
🔎 Bottom Line:
Tariff risk just declined → a positive tailwind for equities.
Rotation ≠ risk-off → this often precedes broadening market strength.
Macro tone = cautiously bullish into a packed earnings slate.
This comes as the S&P 500 notched its 11th record close of 2025, underscoring continued resilience. The Nasdaq slipped as chip names pulled back, but focus now shifts to Alphabet and Tesla earnings which are set to shape the tone for both QQQ and SPY with early results showing 86% of S&P 500 stocks beating expectations.
Nasdaq
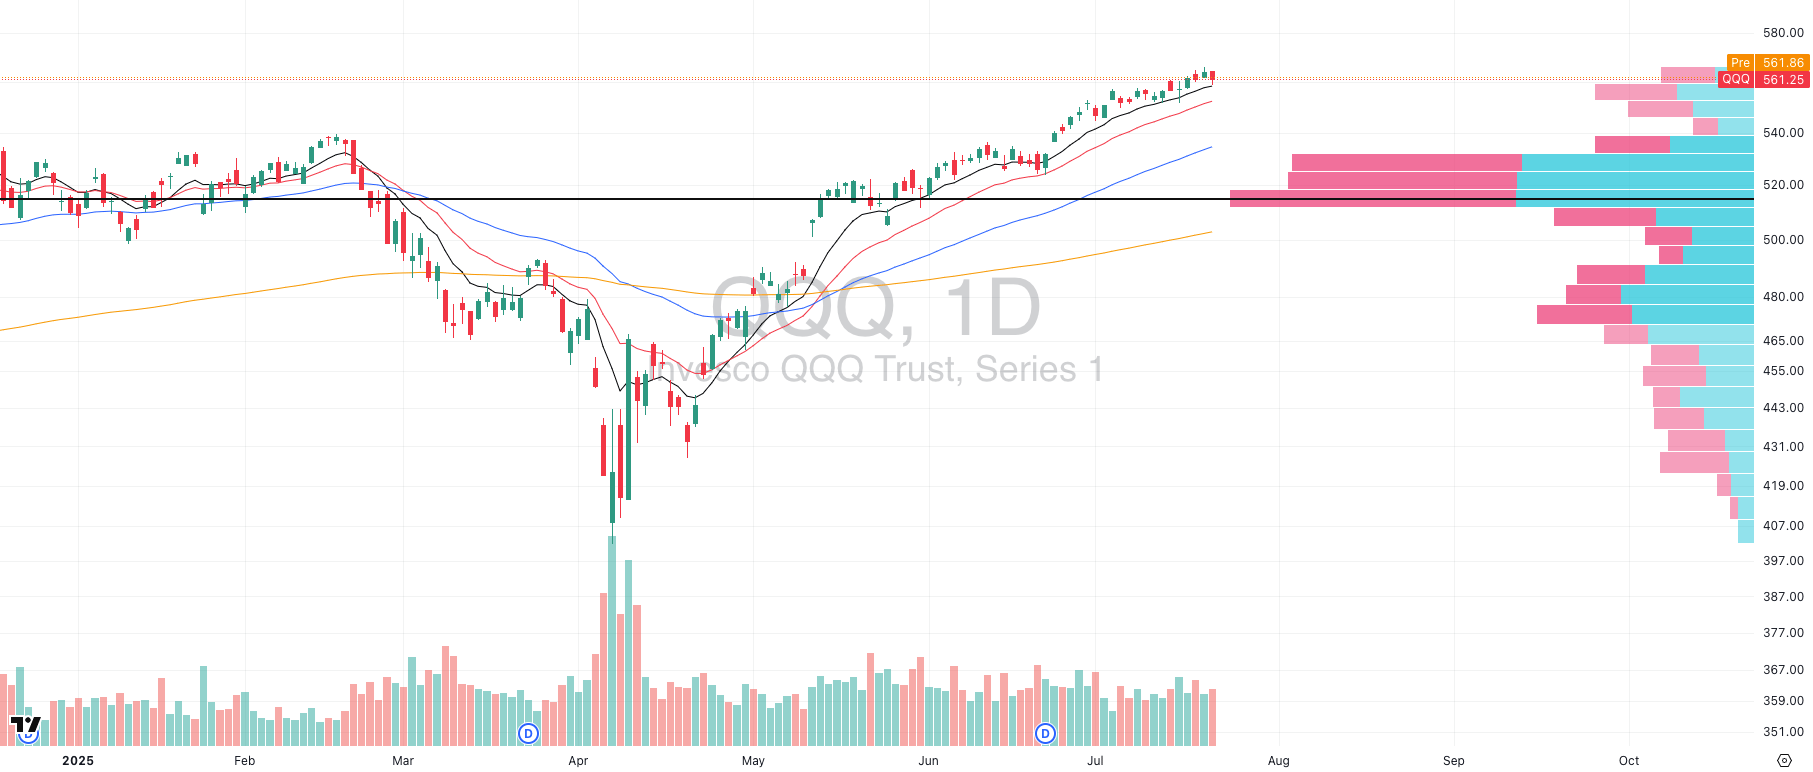
QQQ VRVP Daily Chart
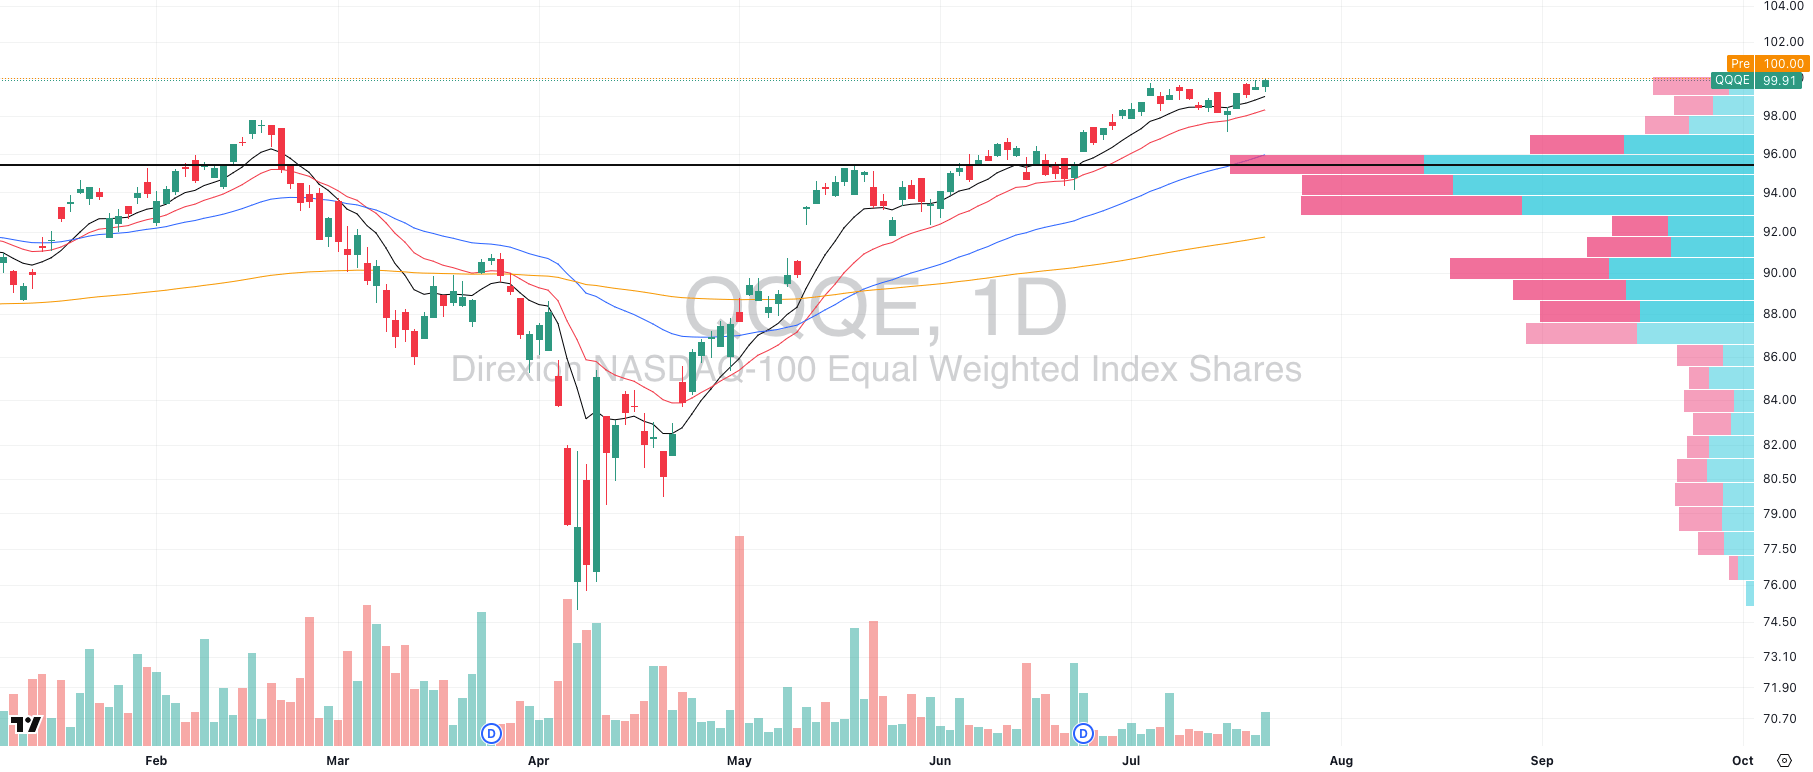
QQQE VRVP Daily Chart
The QQQ continues to show signs of internal fragility, with broad-based selling pressure dominating recent sessions. The Visible Range Volume Profile (VRVP) confirms that recent distribution has occurred at current price levels, with disproportionately higher red (selling) volume vs green (buying) over the last 5 sessions.
📊 Relative Underperformance Confirmed
On Monday, QQQ was the worst-performing major cap-weighted index, underperforming SPY, IWM, MDY, and even the equal-weight QQQE.
The QQQE (equal-weight Nasdaq) actually held up and pushed higher, suggesting the weakness is highly concentrated in the mega-cap names- likely due to pre-earnings risk-off positioning.
🧠 What This Tells Us
Institutional players are de-risking ahead of Big Tech earnings, not abandoning tech entirely.
This doesn’t invalidate the broader AI or semis themes, but it does mean this week is more about rotation and managing risk exposure than chasing new tech longs.
Until we see leadership reassert via a clean high-volume reclaim above resistance, the smart play is to wait. Don’t confuse a crowded, pre-earnings fade with structural breakdown- but don’t fight it either.
S&P 400 Midcap
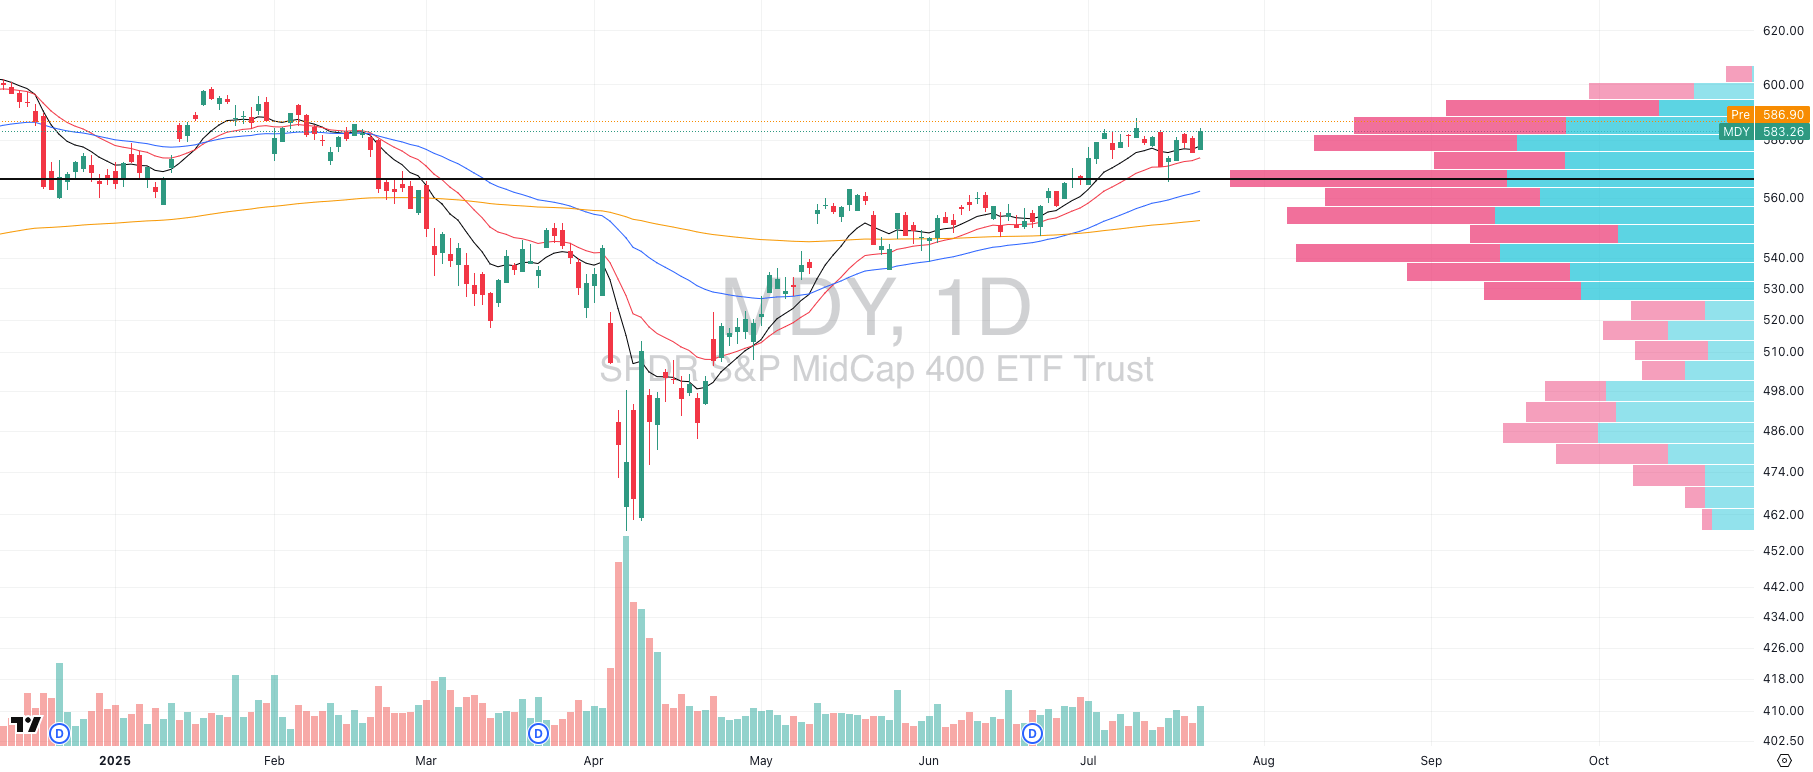
MDY VRVP Daily Chart
Midcaps are quietly asserting themselves. Monday’s session saw a strong high relative volume bounce in MDY right off the rising daily 10-EMA- a level that has consistently attracted demand over the past few weeks.
📈 Technical Structure:
MDY is now pressing against the top of a tight 2–3 week consolidation range, building energy for what could be a decisive breakout. The Volume Profile shows a thinning supply zone above current levels, suggesting limited resistance until new highs.
🔄 Rotation Confirmed:
What’s more notable is the context: while mega cap tech came under pressure, capital rotated down the risk curve into midcaps, this is typically a classic early signal of broadening participation.
This kind of shift isn’t bearish; it’s transitional. If you’re still overweight big tech, you risk missing where the market is quietly moving next.
Russell 2000
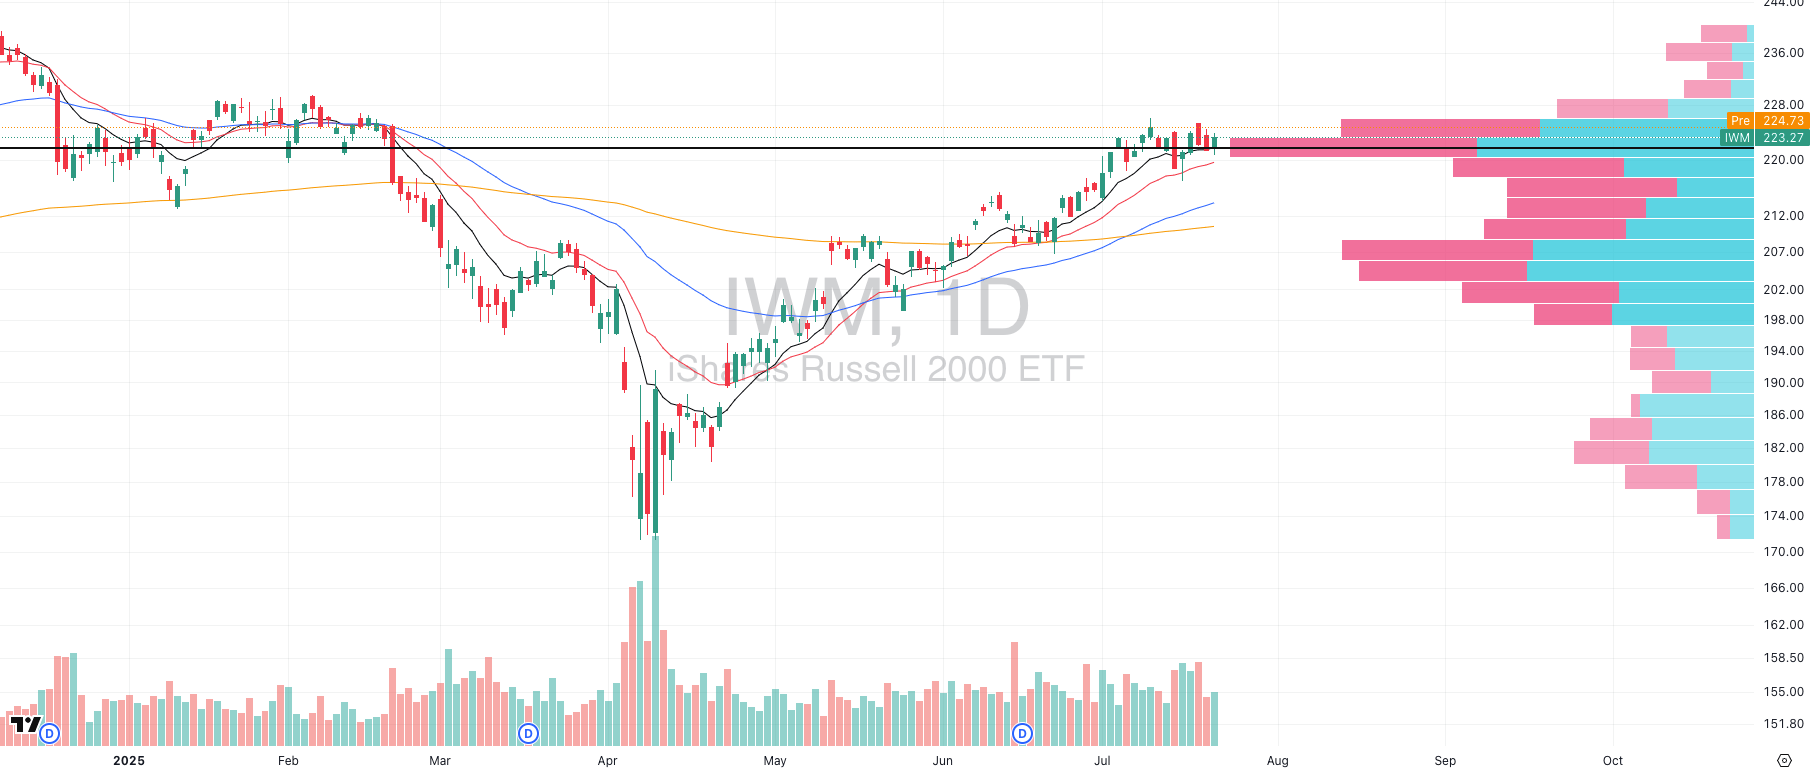
IWM VRVP Daily Chart
If the midcaps are flashing strength, the small caps are quietly echoing the same bullish undercurrent.
Despite yesterday’s broad shakeout, IWM held its Point of Control (POC), a critical level where the most volume has traded over the past 6 months, and bounced off it with a tight-range, low relative volume candle, signaling a lack of aggressive selling pressure.
📊 Volume Profile Insight:
Above the $226 level, the Visible Range Volume Profile (VRVP) shows a clear drop-off in volume density. This suggests a thin zone of overhead supply, which could allow for an accelerated move higher if buyers push IWM through that $226 breakout line.
🧠 Why It Matters:
Think about the logic: if yesterday truly marked the start of a deeper correction after a 15-week rally, the Russell- the most fragile and rate-sensitive index- would’ve broken first. Instead, it showed relative strength versus both the SPY and QQQ.
🟢 Bottom Line:
IWM is quietly building a flag continuation pattern, mirroring midcaps, and sitting just below breakout. Demand continues to show up where you’d expect weakness.
If this breakout confirms, it would be a strong sign of broadening leadership, and an early signal that small caps are back in play.
This Startup Is Making Plastic Obsolete

Timeplast created a plastic that dissolves in water, leaving no waste. Their tech could revolutionize the $1.3T plastic industry. That’s why 7,000+ people have already invested, and you have only a few days left to join them. Invest in Timeplast by July 31 at midnight.
This is a paid advertisement for Timeplast’s Regulation CF Offering. Please read the offering circular at invest.timeplast.com.
FOCUSED STOCK
PONY: The Triple Threat (AI + China + EV)
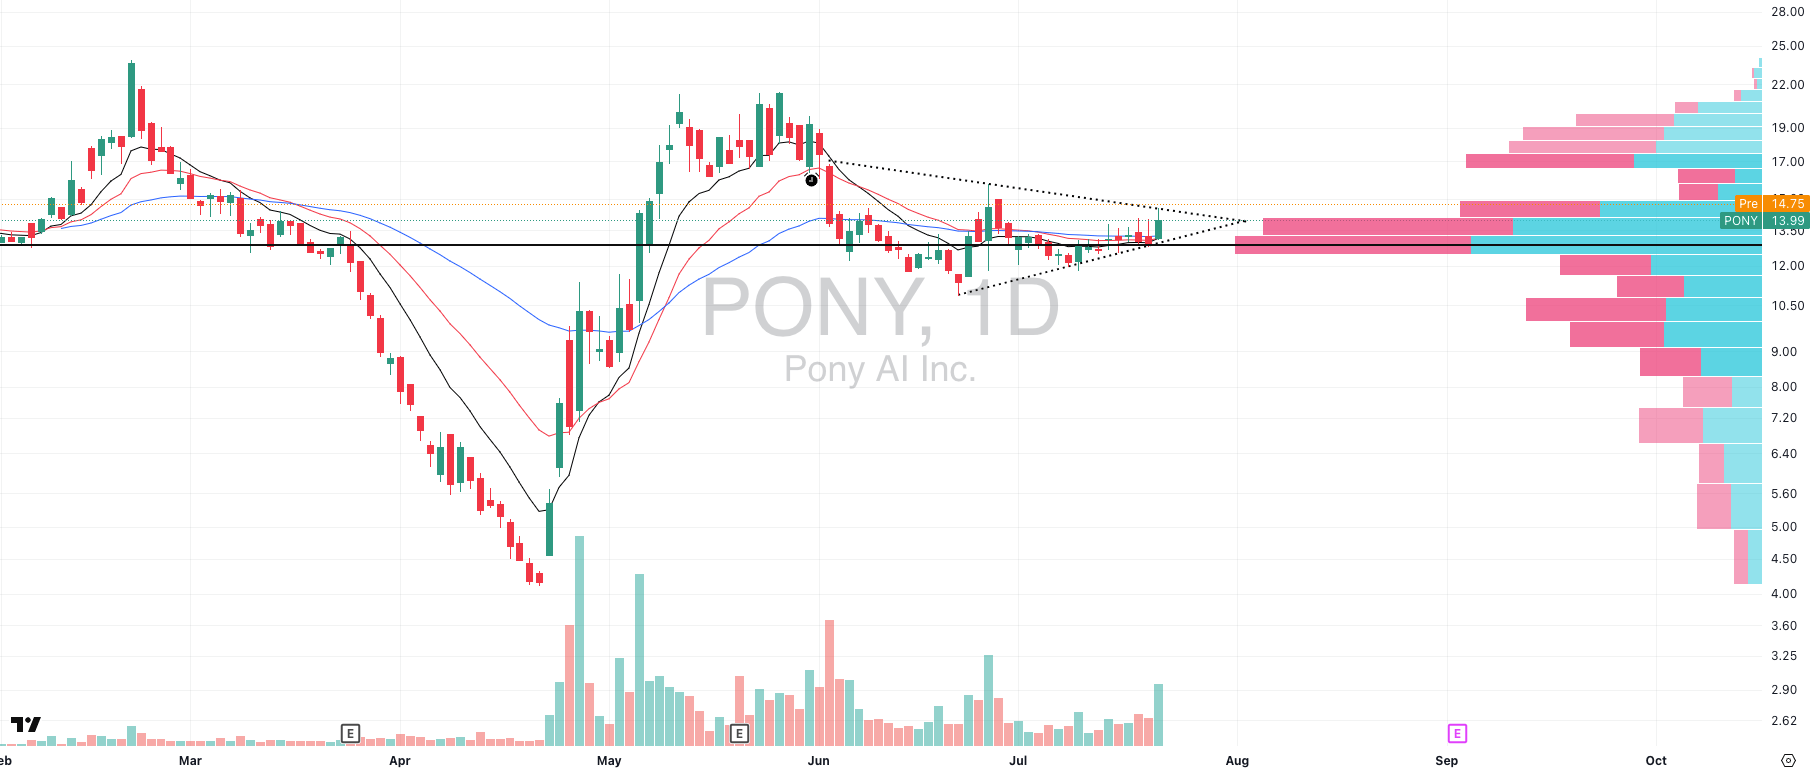
PONY VRVP Daily Chart
PONY is at the intersection of three of the market’s strongest thematic trades, Artificial Intelligence, Chinese equities, and Electric Vehicles, and the technical setup now matches the fundamental tailwinds.
📈 Technical Context:
PONY is a recent IPO (December 2024), and as many experienced traders know, IPO bases often lead to some of the most explosive breakouts when supply dries up and accumulation tightens. Price is now emerging from a well-defined volatility contraction just beneath the $17 mark- the top of its post-IPO range.
📊 Volume Profile Advantage:
The Visible Range Volume Profile (VRVP) shows little overhead supply above $17, meaning any breakout is likely to face minimal resistance, increasing the probability of fast price discovery.
🌏 Why It Matters:
AI Exposure → The hottest macro trade of the year.
China Rebound → GXC and KWEB have shown major strength.
EV Momentum → The DRIV ETF (global EV exposure) confirms strong underlying bid in the space.
📌 Trader’s Playbook:
When you find a stock that checks all three boxes, theme, timing, and technicals, it belongs on your high-priority focus list. With clean structure and macro tailwinds, PONY could be one of the most asymmetric setups on the tape today.
FOCUSED SECTOR
XLRE: Real Estate Breaks Higher
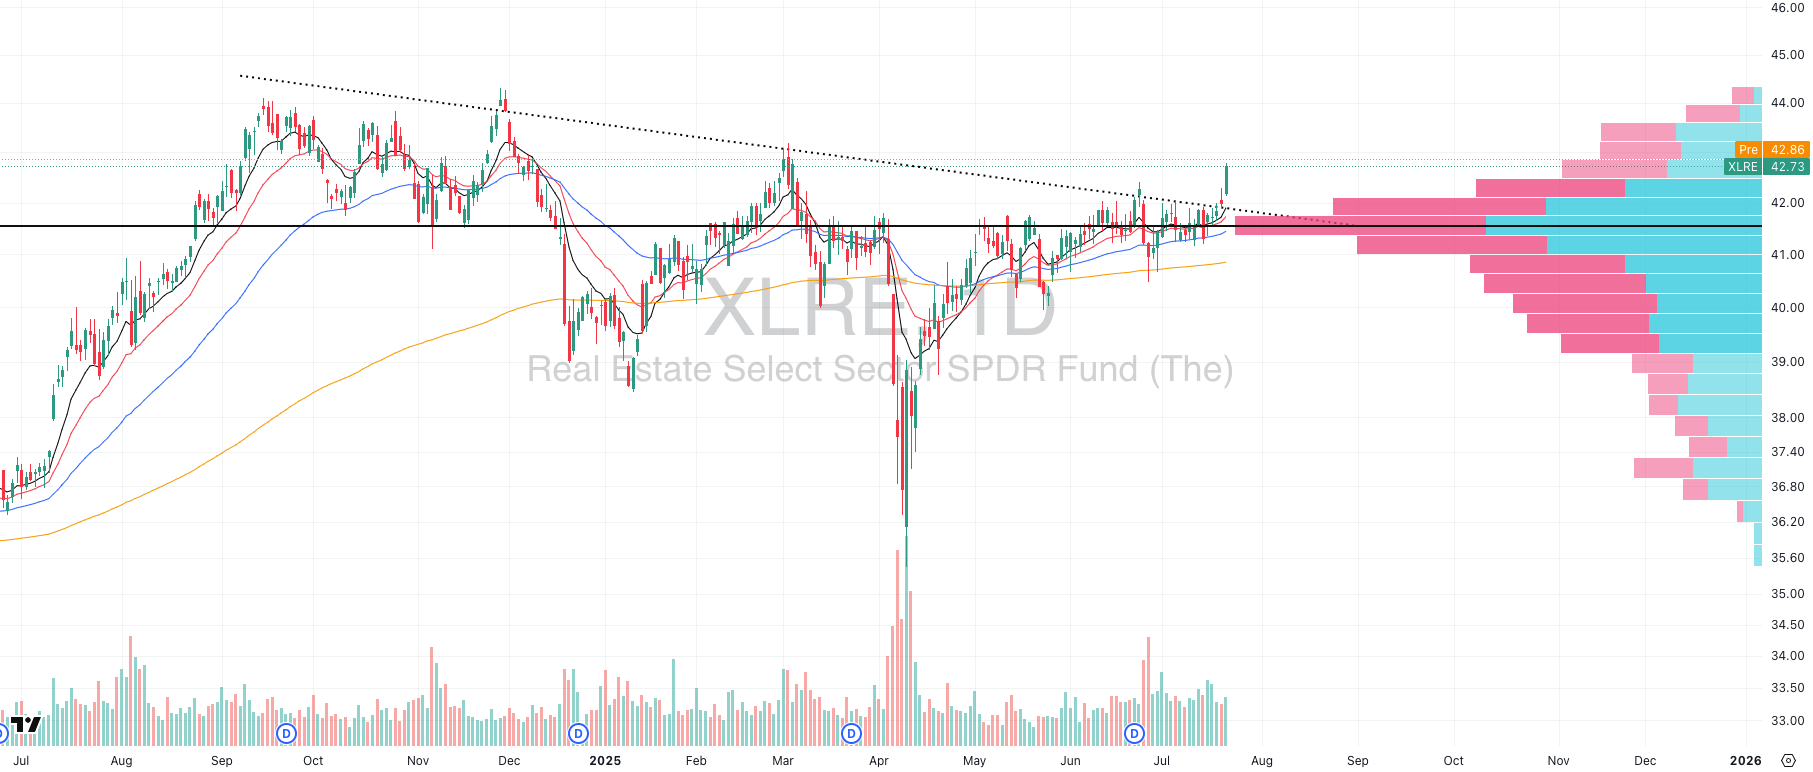
XLRE VRVP Daily Chart
While most eyes were glued to tech stocks unraveling intraday, Real Estate (XLRE) quietly staged a high-volume breakout- the kind that often signals a change in leadership under the surface.
📊 Technical Setup:
XLRE has been building a long, subtle Stage 1 base ever since topping in September 2024. After months of quiet accumulation, Tuesday saw the first real expansion candle, clearing the top of the range with authority and strong volume confirmation.
💡 Macro Tailwind:
Traders are increasingly betting that interest rate cuts may come sooner than expected, especially with growing pressure from President Trump on the Fed to ease. Lower rates = tailwind for real estate and homebuilders.
🏠 Homebuilders Following:
The breakout in XLRE was mirrored by strength in XHB (Homebuilders ETF), suggesting a broader move across rate-sensitive assets.
🔍 Trader’s Takeaway:
When sectors start to move, your job is to follow the money. Don’t focus on what’s already broken down, focus on what’s emerging.
XLRE is now a must-watch group, and the top-performing names within it are likely to offer some of the cleanest risk-reward trades in the coming days.

Did you find value in today's publication?This helps us better design our content for our readers |
Reply