- Swingly
- Posts
- Stocks Flash a Bullish Signal Not Seen in Months
Stocks Flash a Bullish Signal Not Seen in Months
In partnership with
OVERVIEW
Pullbacks Absorbed, Breakouts Reactivated
🟢 Risk-On: US Equities printed textbook bullish reversal patterns (Morning Stars) on high relative volume across QQQ, MDY, IWM, and even RSP. Trend re-continuation is now the higher-probability scenario.
📊 Broad Market Structure:
We saw price knife into volume shelves, trigger liquidity, and get bought aggressively with classic shakeout behavior.
🧠 This Is Where Conviction Matters
Tight pullbacks. No breakdowns. Strength in leaders. When setups tighten post-shakeout, the edge improves, and not worsens. The risk now isn’t being too exposed, or even worse under-exposed.

MARKET ANALYSIS
Macro Is Mostly Noise- No Material Shifts
There was no meaningful macro development that changes our outlook, or we believe is significant.
Jobless claims dipped and retail sales beat, but neither moved the needle. The data confirms what we already know: the U.S. consumer remains healthy, and tariffs haven’t dented spending behavior in any material way.
The Trump–Powell drama continues to fade. Despite headlines, there’s no evidence of imminent action against Powell. Markets clearly shrugged it off, with futures holding steady and volatility compressing.
Earnings season is where the real signal lies. Netflix’s post-earnings reaction was tepid (despite a profit beat), but this looks more like valuation digestion than a macro readthrough.
🧠 Why This Matters
This is a "no new damage" tape. The Fed remains intact, the consumer is strong, and earnings aren’t imploding. That sets a clean backdrop for price to lead.
Nasdaq
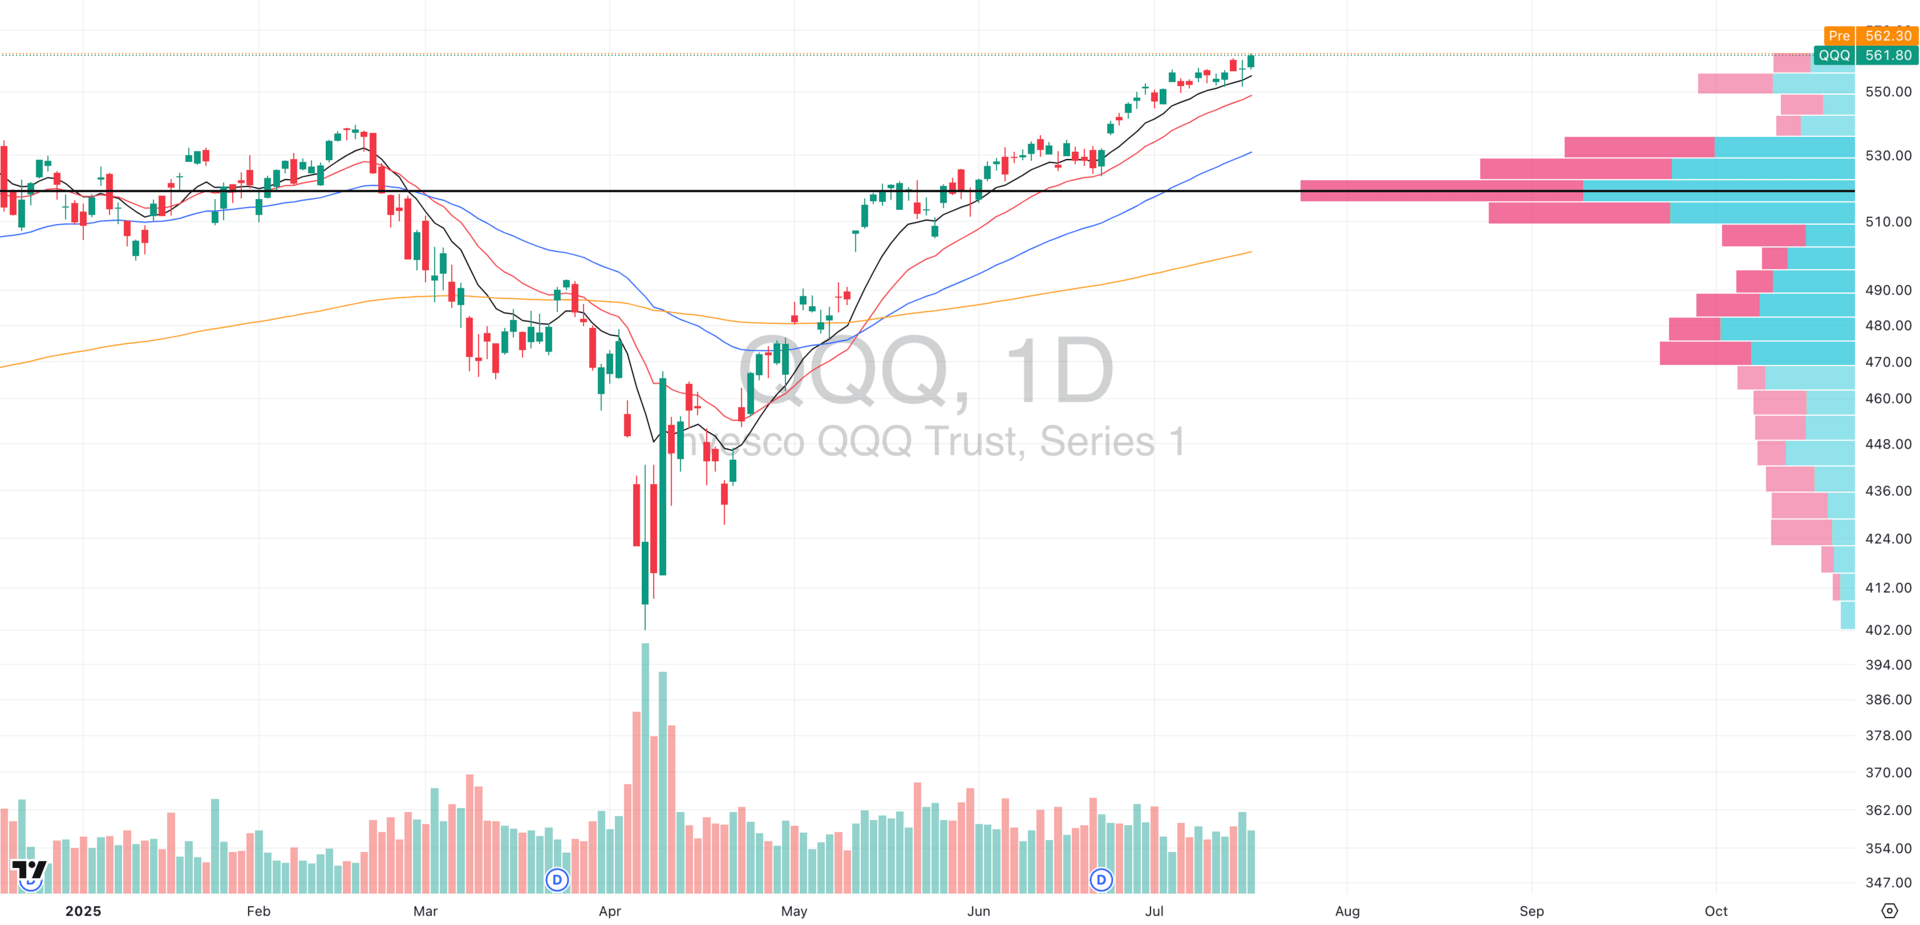
QQQ VRVP Daily Chart
The QQQ printed a textbook Morning Star candlestick reversal, one of the most statistically reliable bullish reversal formations. Even more powerful: this same pattern showed up across all major index groups- SPY, RSP, QQQE, IWM, and MDY.
🟢 What’s a Morning Star?
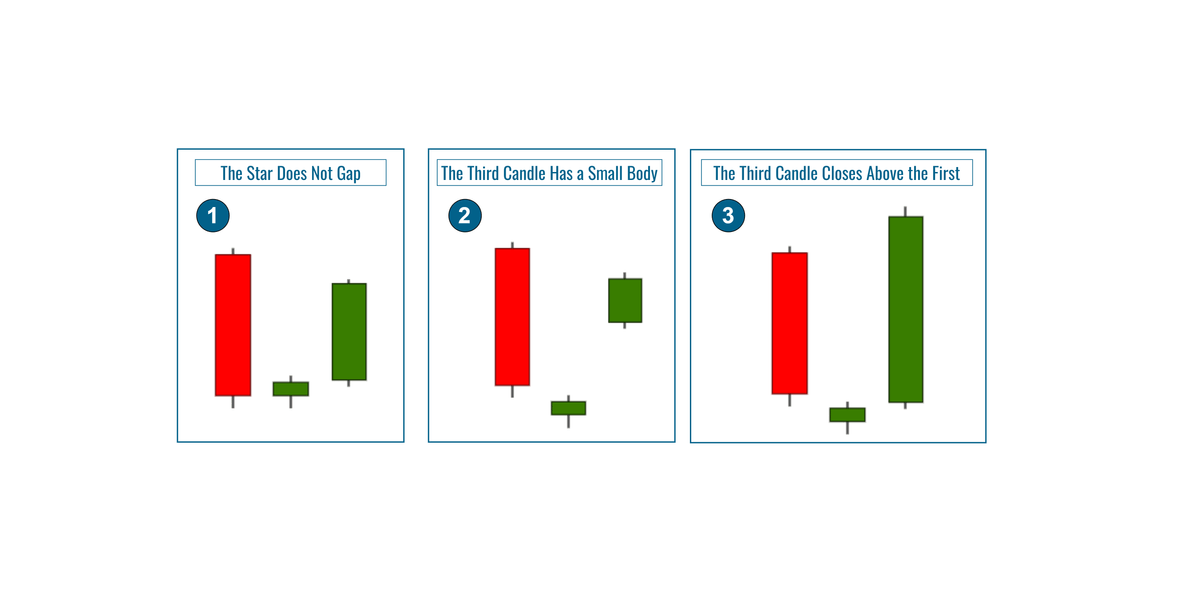
A 3-candle pattern:
A large red down day (sell-off)
A pause or reversal candle (small-bodied or doji)
A large green up candle that reclaims the red day’s body
This signals a momentum shift from sellers back to buyers — and when confirmed (as we saw yesterday), it historically precedes strong trend continuation.
📈 Quantified Edge (Thomas Bulkowski’s Study, 2001–2012):
Morning Stars during uptrends lead to upside follow-through ~78% of the time
Average return post-pattern: +6.2% in 10 days
Even less aggressive setups (50%+ retrace of red candle) show ~68% success when breadth is strong
🧠 Why It Matters Now:
Yesterday’s green candle fully confirmed the reversal
Leading stocks pushed higher alongside it, confirming participation
Volume stepped in right where it needed to, demand was real, not passive
This isn’t the time to second-guess. We’re seeing healthy pullbacks, tight structures, and real buying. QQQ looks set to resume trend and the burden remains on sellers to disprove that.
S&P 400 Midcap
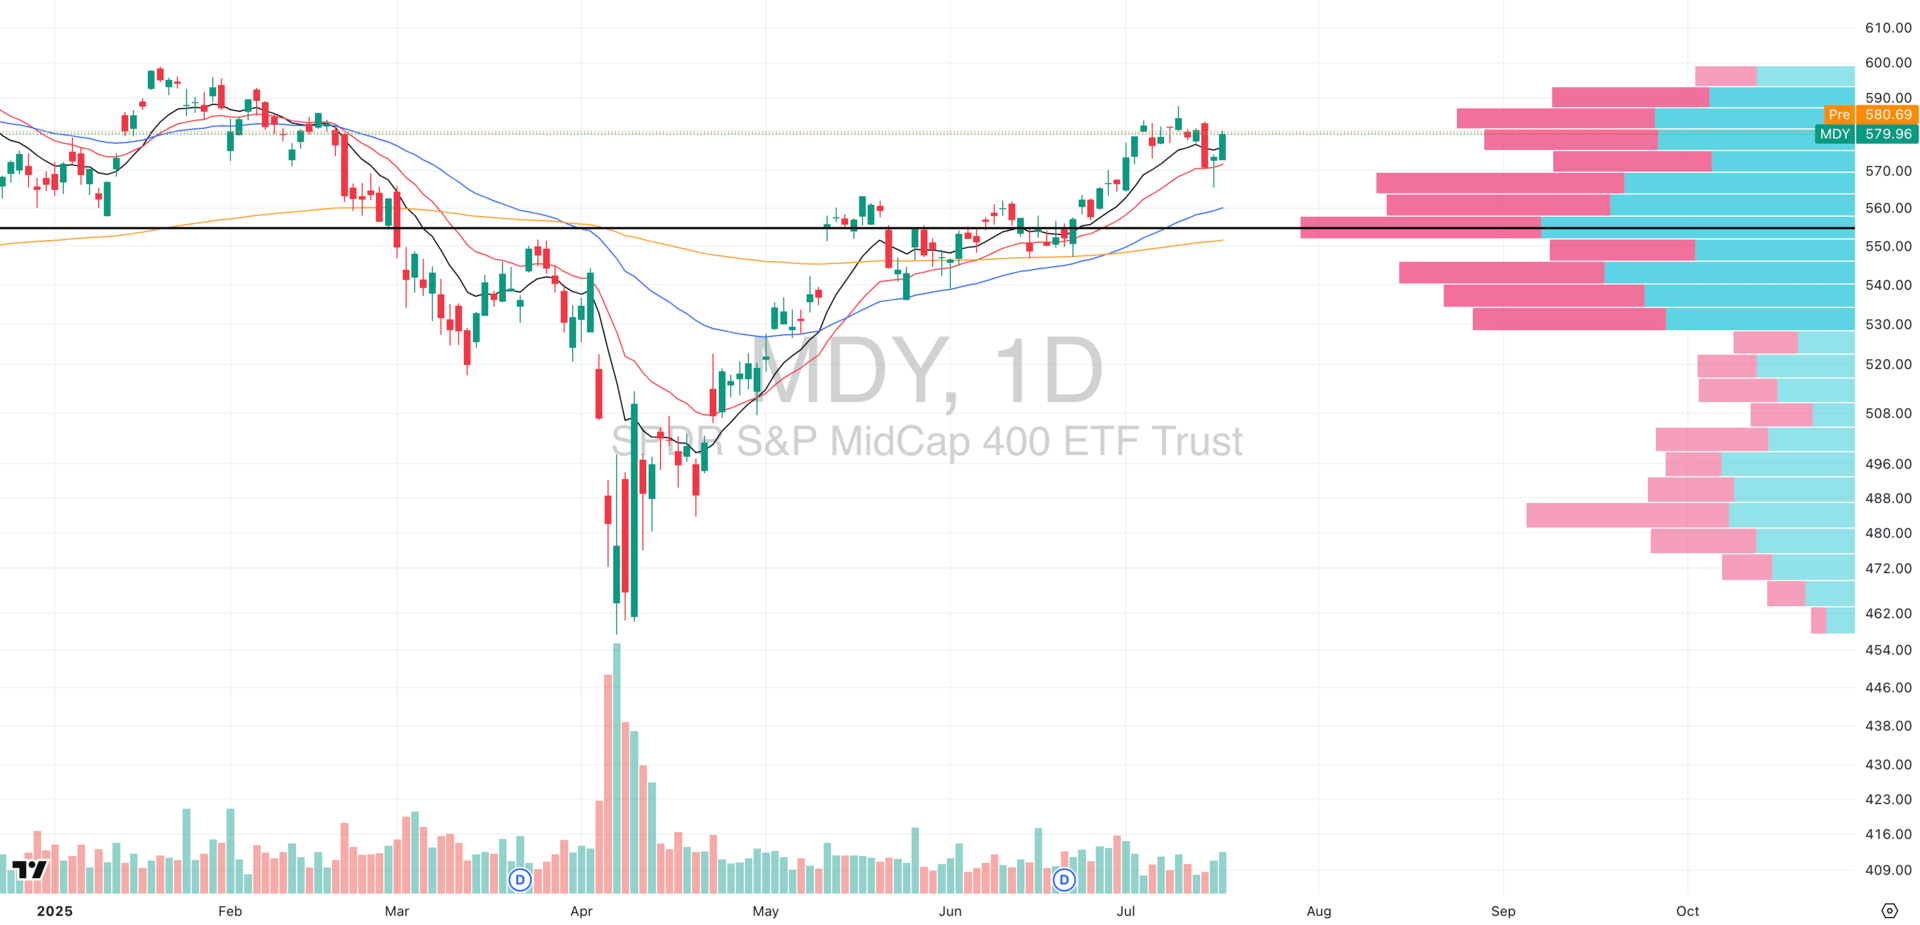
MDY VRVP Daily Chart
The MDY printed its own confirmed Morning Star reversal yesterday, this time on very high relative volume, reclaiming both the 10EMA and 20EMA in one strong session.
It’s a clear signal that buyers are defending structure and willing to step back in after shallow pullbacks.
🔍 What’s Different from QQQ?
Unlike QQQ, which is breaking into new all-time highs and in price discovery mode, MDY still has to work through overhead supply, particularly into the $590 zone, where we see past congestion.
That may cap immediate momentum, but the underlying bid is healthy.
🧠 Why It Matters:
Reclaiming both moving averages is a strong trend confirmation and combine that with high volume, this works to validate the bounce and shows this wasn’t a passive drift
We remain broadly bullish on U.S. equities, and the midcap space remains a key rotational target, especially for swing traders looking to diversify beyond crowded tech leadership.
Russell 2000
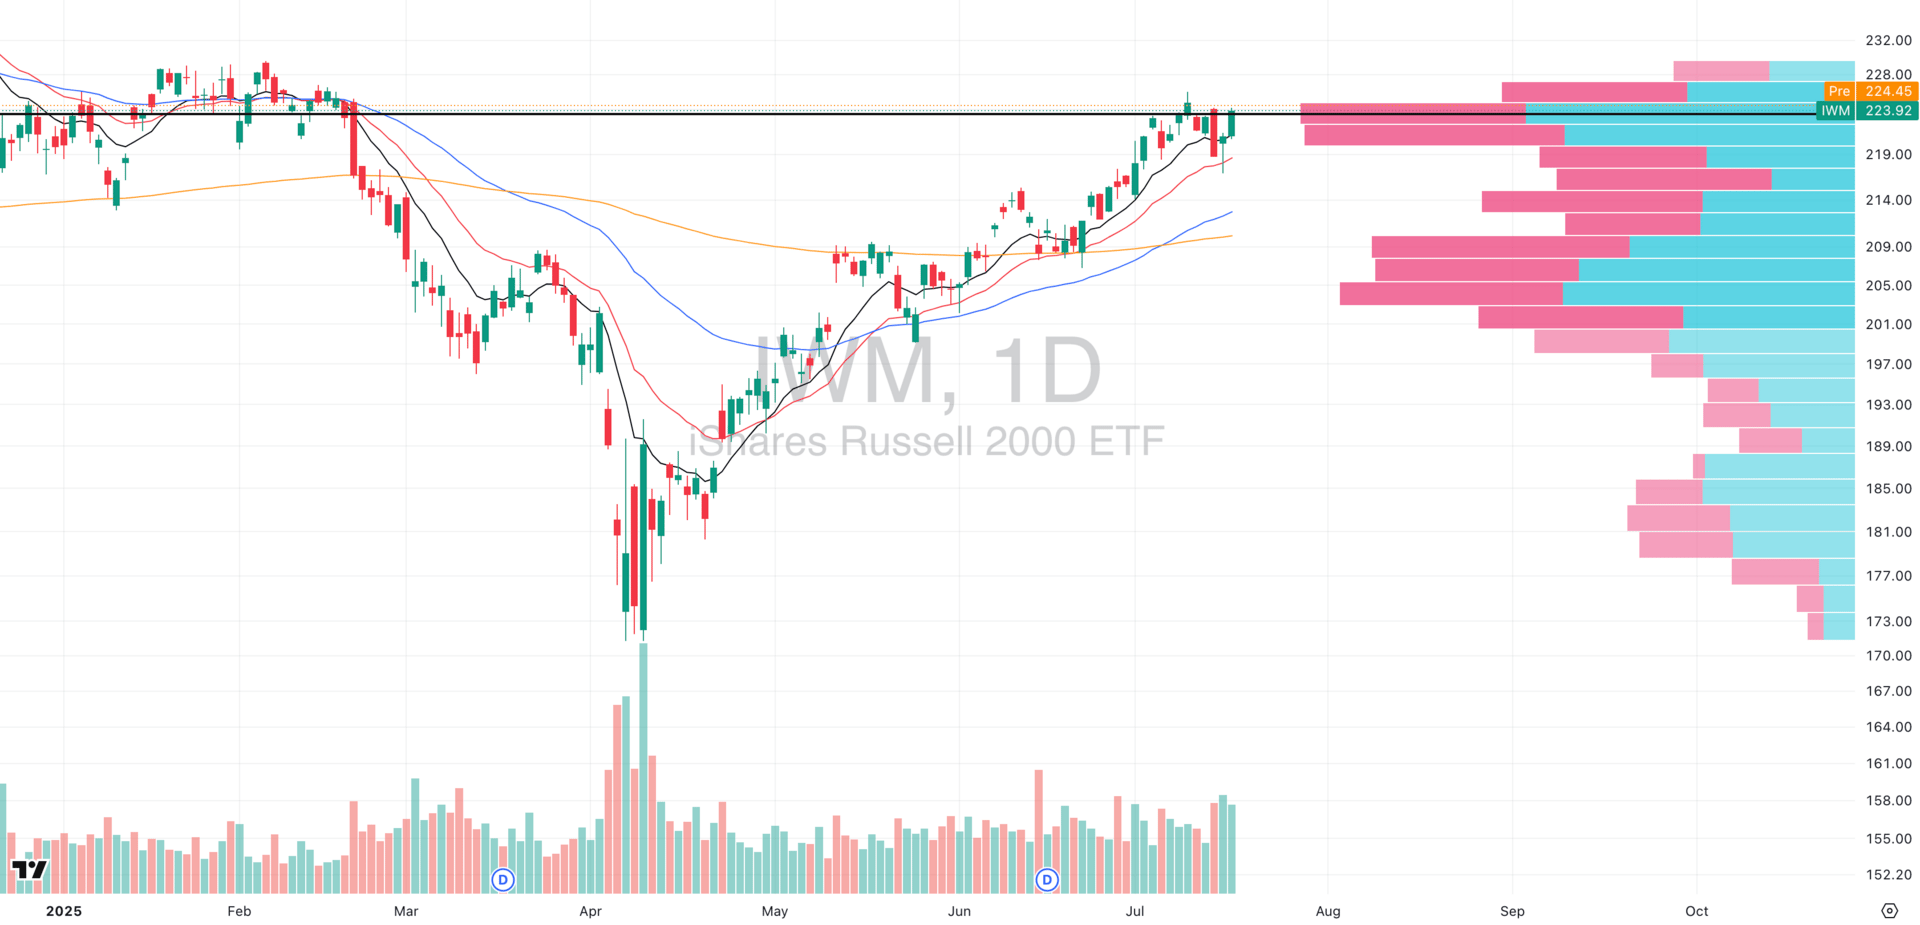
IWM VRVP Daily Chart
Small caps joined the reversal party with a clear Morning Star candlestick pattern, but what stood out was the very high relative volume as IWM surged directly into its Point of Control (POC) at ~$225.
📊 Why This Is High-Conviction Bullish:
The Visible Range Volume Profile (VRVP) shows very little overhead supply above the $225 level making this one of the cleanest breakout zones across all major indices.
Relative volume was stronger here than in QQQ or MDY, suggesting institutional interest may be rotating down the risk curve.
🧠 Contextual Edge:
Morning Star patterns during bullish breadth environments (like we’re in now) tend to resolve higher (as we discussed earlier), but what’s unique about small caps (IWM) is their historical tendency to outperform during the heart of a bull market, once risk appetite broadens beyond mega-cap tech.
That’s exactly the rotation we may be seeing start to unfold, and with low supply resistance above, a reclaimed trend structure, and broadening breadth, IWM may be the sleeper index to watch this week.
Smart Investors Don’t Guess. They Read The Daily Upside.

Markets are moving faster than ever — but so is the noise. Between clickbait headlines, empty hot takes, and AI-fueled hype cycles, it’s harder than ever to separate what matters from what doesn’t.
That’s where The Daily Upside comes in. Written by former bankers and veteran journalists, it brings sharp, actionable insights on markets, business, and the economy — the stories that actually move money and shape decisions.
That’s why over 1 million readers, including CFOs, portfolio managers, and executives from Wall Street to Main Street, rely on The Daily Upside to cut through the noise.
No fluff. No filler. Just clarity that helps you stay ahead.
FOCUSED STOCK
QUBT: A VCP Setup in a Red-Hot Sector
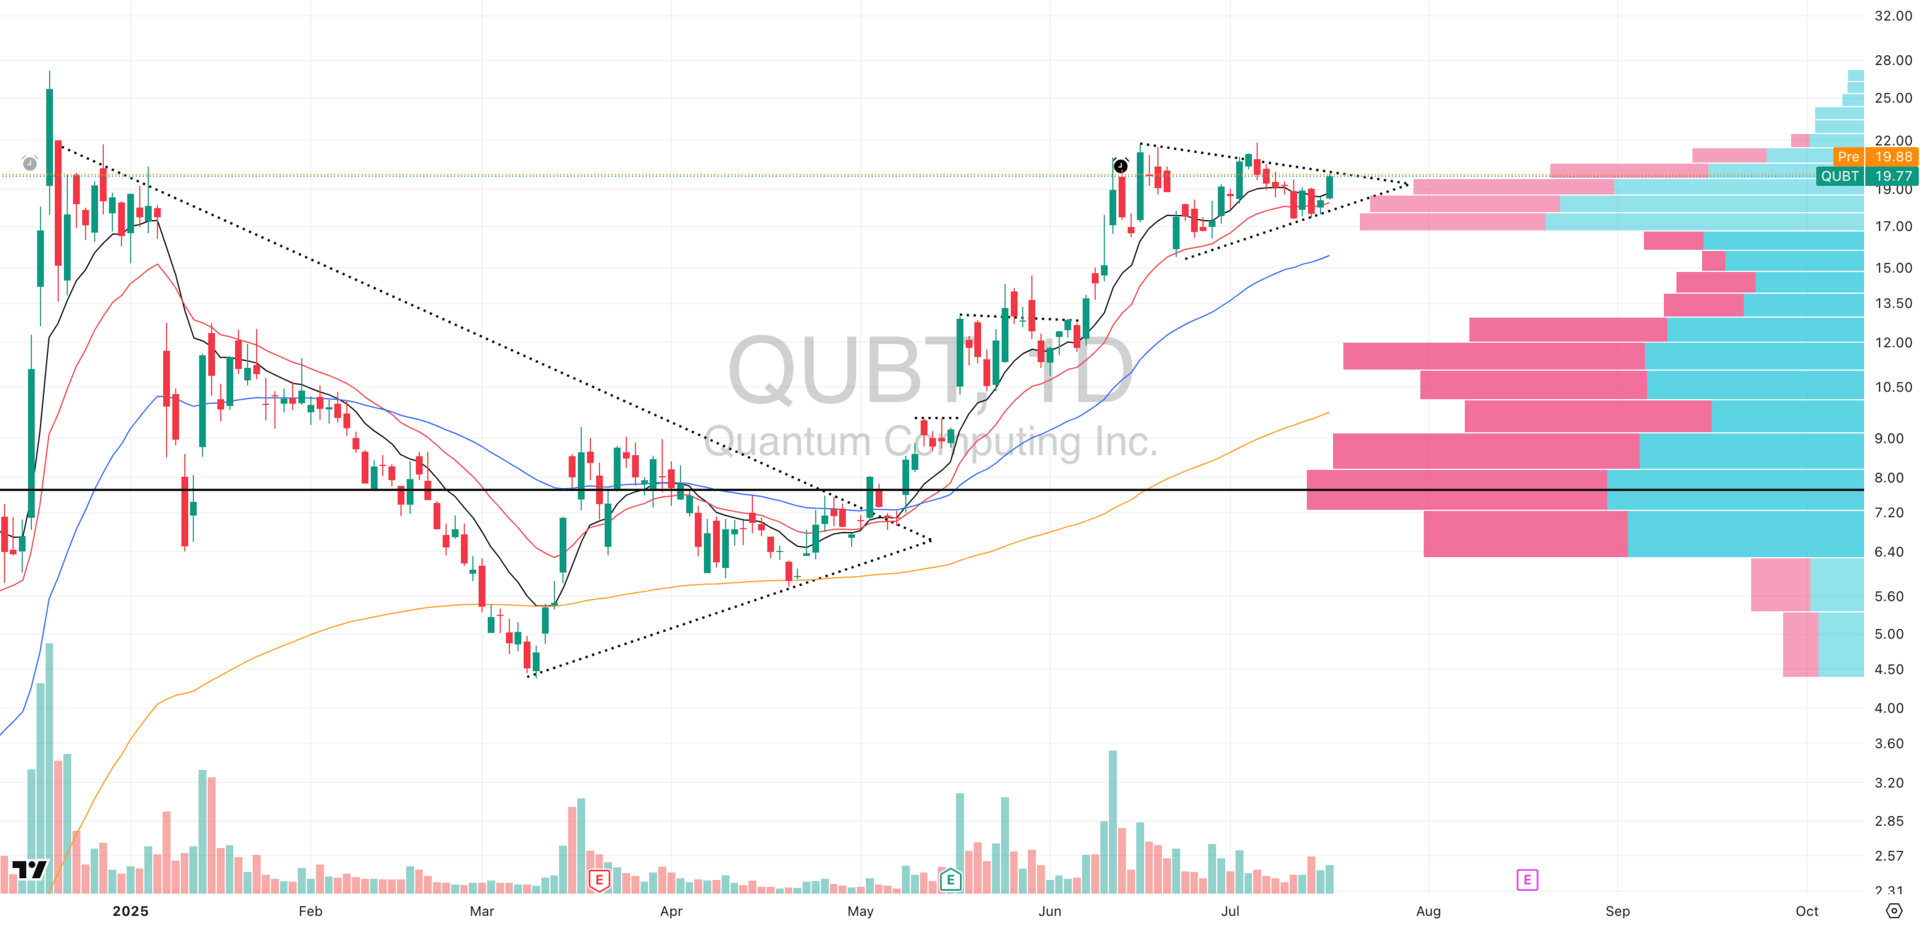
QUBT VRVP Daily Chart
We flagged the surge in quantum names yesterday with RGTI, QBTS, and others breaking out cleanly. Now, QUBT, one of the leaders in the group, is setting up what looks like a textbook Volatility Contraction Pattern (VCP).
✅ Tight Coil at Volume Pocket:
QUBT is currently sitting right at the $19.50–$20.00 zone, where the Visible Range Volume Profile (VRVP) shows an exponential drop-off in overhead supply.
This is key as tight price action at the edge of a low-volume pocket means any breakout could move fast and clean.
📊 Volume Expansion Starting:
Yesterday, we saw an intraday spike in relative volume, a potential early clue that institutions are watching this coil too.
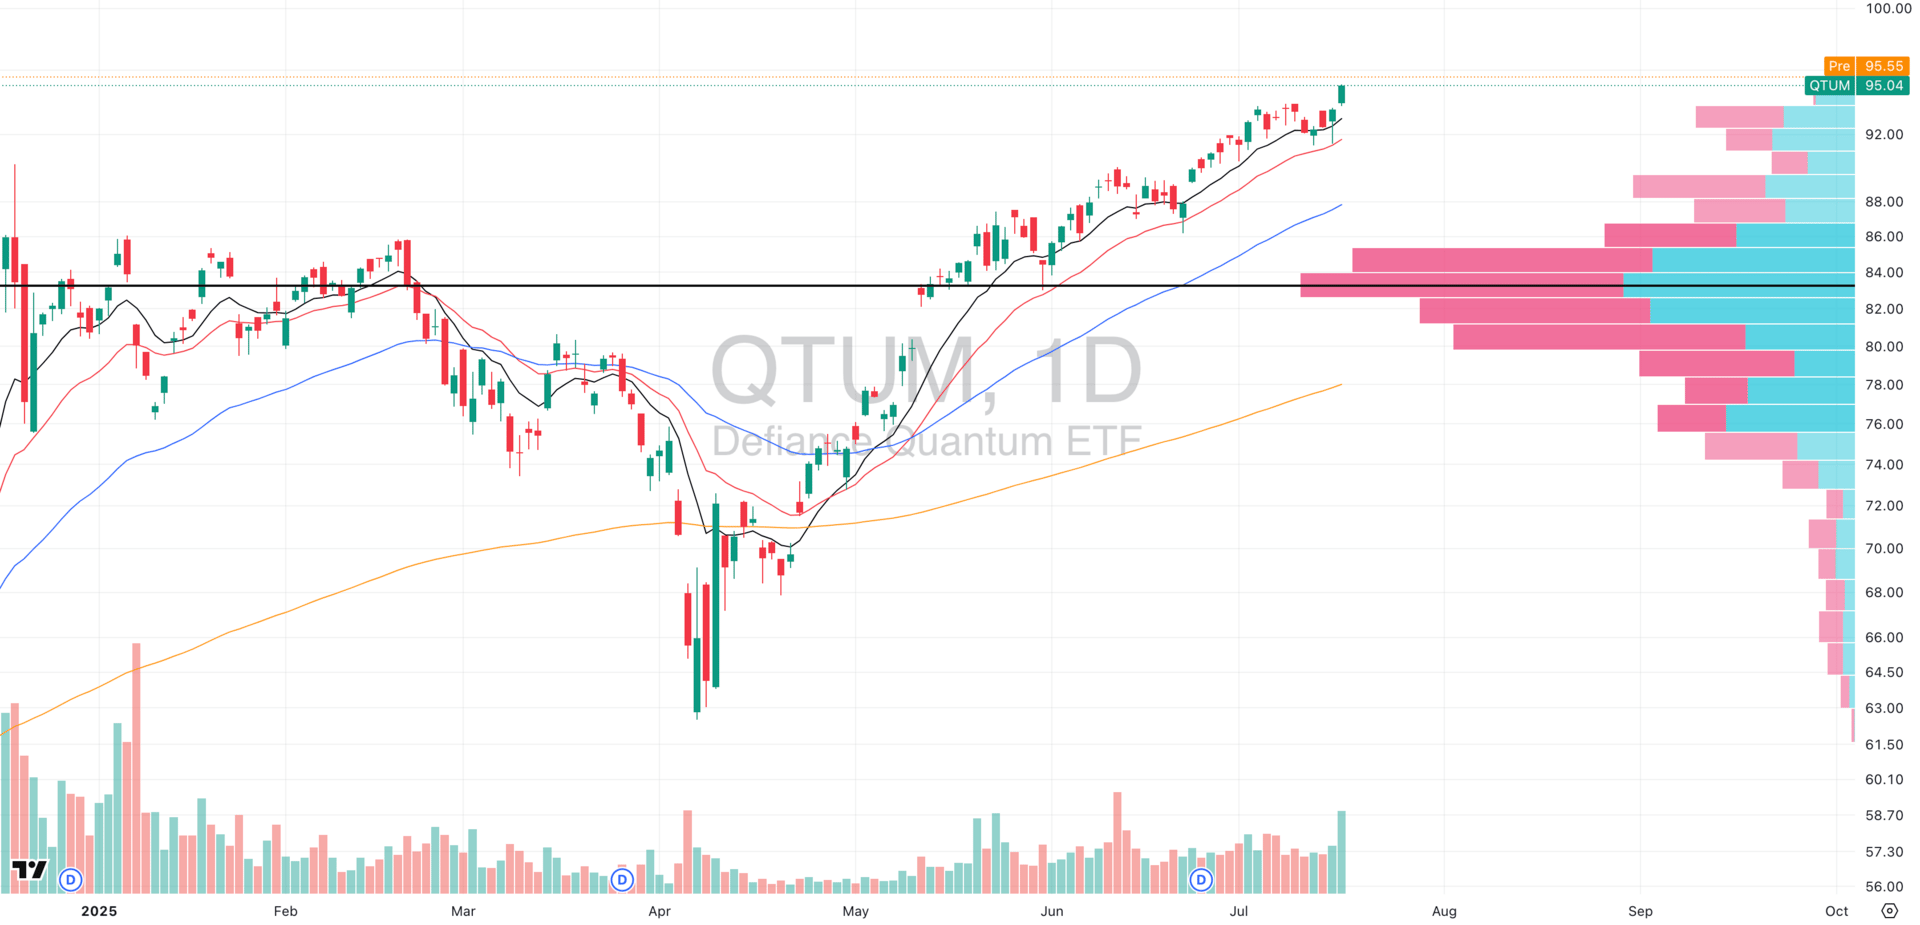
QTUM VRVP Daily Chart
⚡ Group Strength + Context:
The quantum computing theme is among the strongest in the market right now. This is not isolated price strength. Capital is rotating here, and if QUBT resolves this tight range with follow-through volume, it will be next to lead.
🧠 Risk/Reward Structure:
With a high ADR%, QUBT is volatile, but that also means you don’t need to chase. The risk is tight, and if you're watching for tight setups into clear volume gaps, this is one to keep front and center.
FOCUSED GROUP
XLF: Another Morningstar Taking Shape
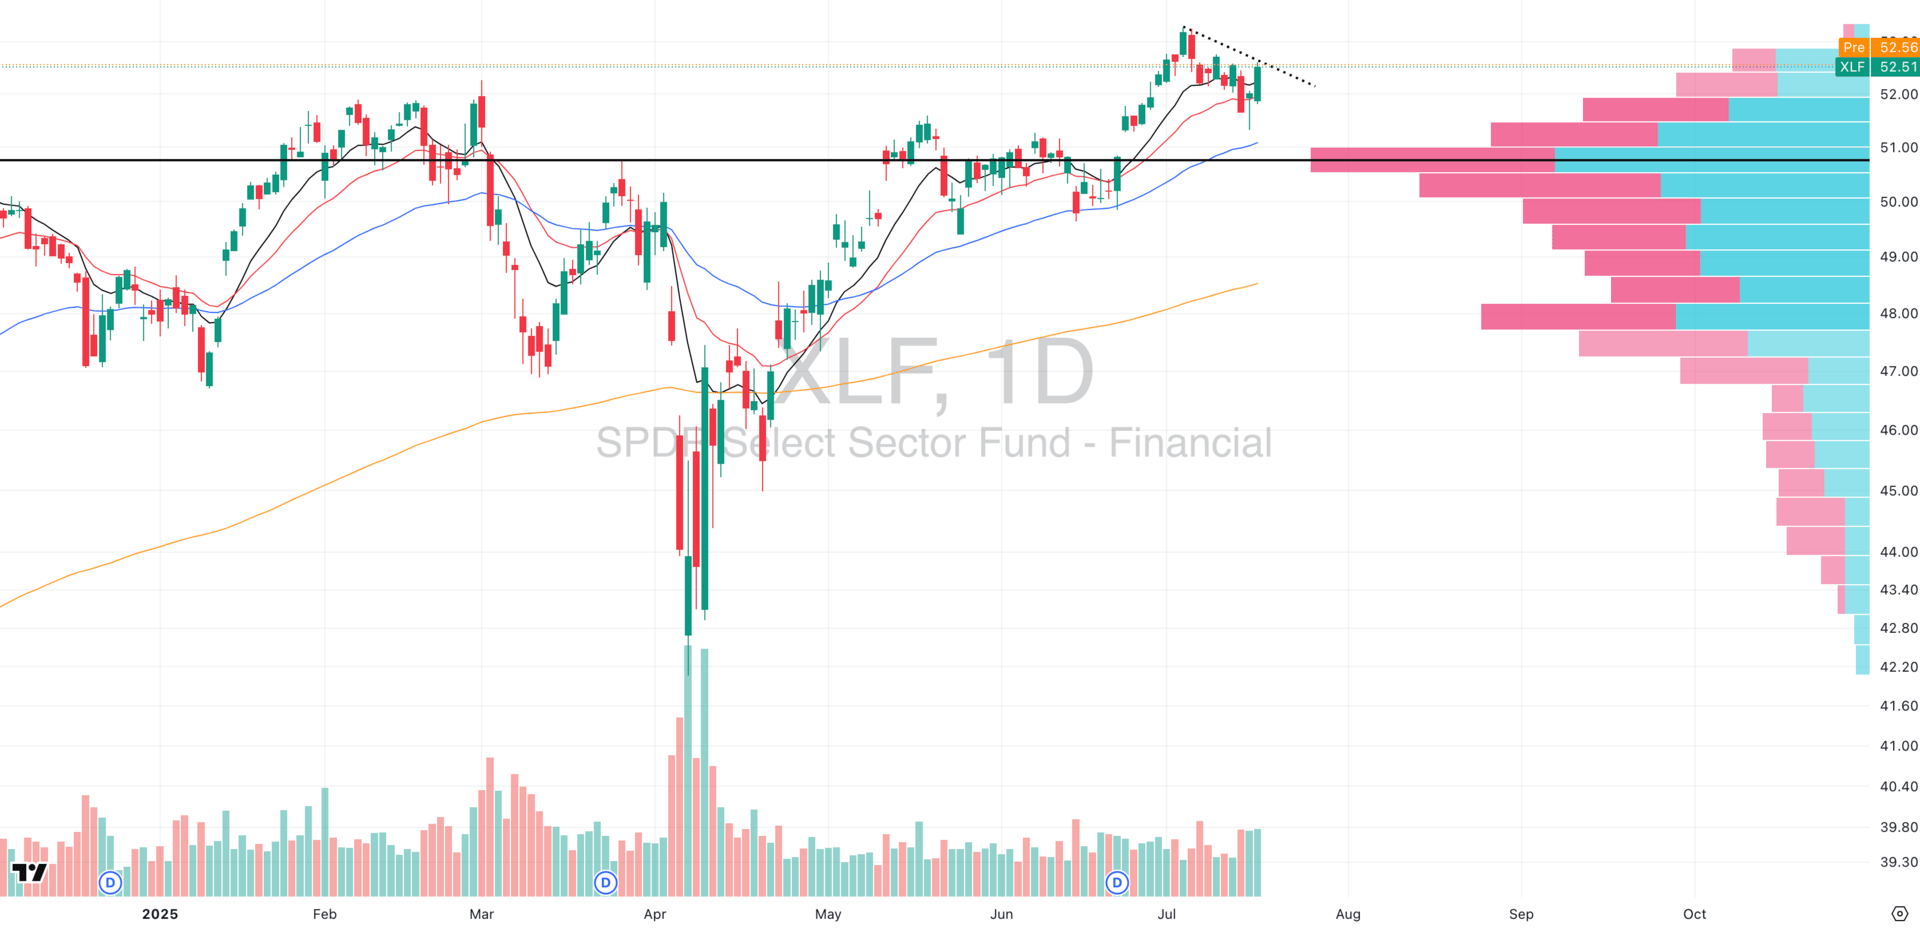
XLF VRVP Daily Chart
XLF is quietly emerging as a leadership group. Consider just RobinHood (HOOD) for example which is one of the strongest names in the market pushing highs with force.
The same Morning Star trend reversal pattern we outlined in QQQ, IWM, and MDY is now clearly developing in XLF, and it might be one of the most structurally bullish.
✅ Why It Matters:
Yesterday’s green candle fully engulfed the prior red bar, and most importantly, it closed above 100% of that red candle’s open. According to Thomas Bulkowski, this significantly strengthens the Morning Star’s statistical edge.
Even a close >50% is valid, but full-range reclaims like this are rare and powerful.
📊 Volume Confirms It:
The reversal candle printed on high relative volume, showing real conviction, and not just a passive bounce.

Q&A
Got a trading question? Hit reply and ask!
Q: “What is the difference between ADR and ATR? I’ve seen you reference both, how should I use them in my trading?”
ADR and ATR help you read the rhythm of a stock, and more importantly, how far it can realistically go before needing a break.
🔍 Definitions:
ATR (Average True Range): Measures recent volatility. It’s a moving average (typically 14-day) of how much a stock moves each day, factoring in gaps.
➤ Use ATR to understand current volatility and how extended a stock is vs its average range.ADR (Average Daily Range): Measures expected daily move, the average difference between high and low over a recent period (often 20 days).
➤ Use ADR to set expectations for daily movement, especially for targets, stops, or timing entries.
Both are volatility tools, but ATR adapts more quickly, while ADR gives a normalized average. We track both to assess entry quality and extension.
📈 Why Does It Matter for Entry and Exit?
Because you don’t just want to buy a good stock… you want to buy it at the right moment in its volatility cycle.
This is where ATR extensions come in:
🧠 The Core Idea:
Stocks that are far above their 50-day EMA by more than 4–5x ATR are often exhausted in the short-term.
Conversely, tight stocks sitting within 1–2 ATR of their 50EMA are coiled, meaning you get better risk/reward, better structure, and higher chance someone else steps in after you.
We call this the "second-mover’s edge", you want to be in before the crowd, but not so early that you’re buying something stretched.
We really recommend you take a look at one of our favorite traders, Jeff Sun, who publicly documents his trades using a fixed 0.3% risk-to-equity model very similar to ours.
What’s powerful is how he uses ATR compression to time entries and ATR multiples for exit planning.
This is how high-performing traders operate at scale:
Tight base near the 50EMA? Green light.
4x ATR move off lows? Start trimming.
>5x ATR from 50EMA? Don’t chase .
His risk profile + volatility-based system is a clear example of what repeatable, scalable trading looks like. And it’s a big part of what we track every day inside Swingly PRO.
Want full access to our trade setup scans, and daily intraday entry breakdowns?
That’s all inside Swingly Pro → see what’s included
Reply