- Swingly
- Posts
- Something Important Is Breaking
Something Important Is Breaking


MARKET ANALYSIS
What You Need To Know

Oil has exploded above $100 per barrel, marking the first time prices have crossed this level since 2022. The surge comes as the Strait of Hormuz remains effectively closed, forcing several Middle Eastern producers to cut output. Iraq has reportedly seen production fall by roughly 70%, while other producers have also announced reductions. Energy markets are now reacting to a genuine supply shock rather than just speculation.
This oil spike is the single most important macro variable for markets right now. Oil prices rose more than 35% last week alone, which is one of the largest weekly moves ever recorded in the futures market. When energy prices rise this aggressively, it immediately feeds into inflation expectations and raises the risk of a stagflation environment where growth slows while prices remain elevated.
Equity futures are reacting accordingly. Dow futures dropped more than 600 points overnight, with S&P 500 and Nasdaq futures both falling roughly 1% to 1.5% before the open. The volatility index has surged above 30 for the first time since the tariff driven selloff last April, confirming that investors are rapidly buying protection as uncertainty rises.
The market is now facing a difficult macro dilemma. Higher oil prices push inflation higher at exactly the same time the economy is already showing signs of slowing. That creates a situation where the Federal Reserve becomes trapped between two competing forces. Cutting rates risks reigniting inflation, while keeping rates high could further weaken economic growth.
Bond markets are already reacting to this tension. The US 10 year yield has pushed back above roughly 4.2%, which increases borrowing costs across the economy. Higher yields are particularly damaging for rate sensitive segments such as small caps, real estate and highly valued growth stocks.
Global markets are also reacting. European equities opened down more than 2% as investors began pricing in the inflationary effects of higher energy costs. Government bond yields across Europe have moved higher as well, reinforcing the idea that markets expect inflation pressure to remain elevated.
The biggest macro uncertainty remains the duration of the conflict. Some analysts believe the conflict may resolve within several weeks, which would allow oil prices to fall back quickly. However if disruptions to the Strait of Hormuz continue, energy markets could remain extremely tight and the inflation shock would last longer. This also adds a lot of problems for the market as its impossible to price in how long the conflict will last.
Until oil stabilises and volatility begins to compress, markets are likely to remain extremely erratic and very unpredictable. Investors are currently struggling to price risk because the situation in the Middle East is evolving almost daily. That uncertainty is the main reason volatility remains elevated across nearly every asset class.
Nasdaq
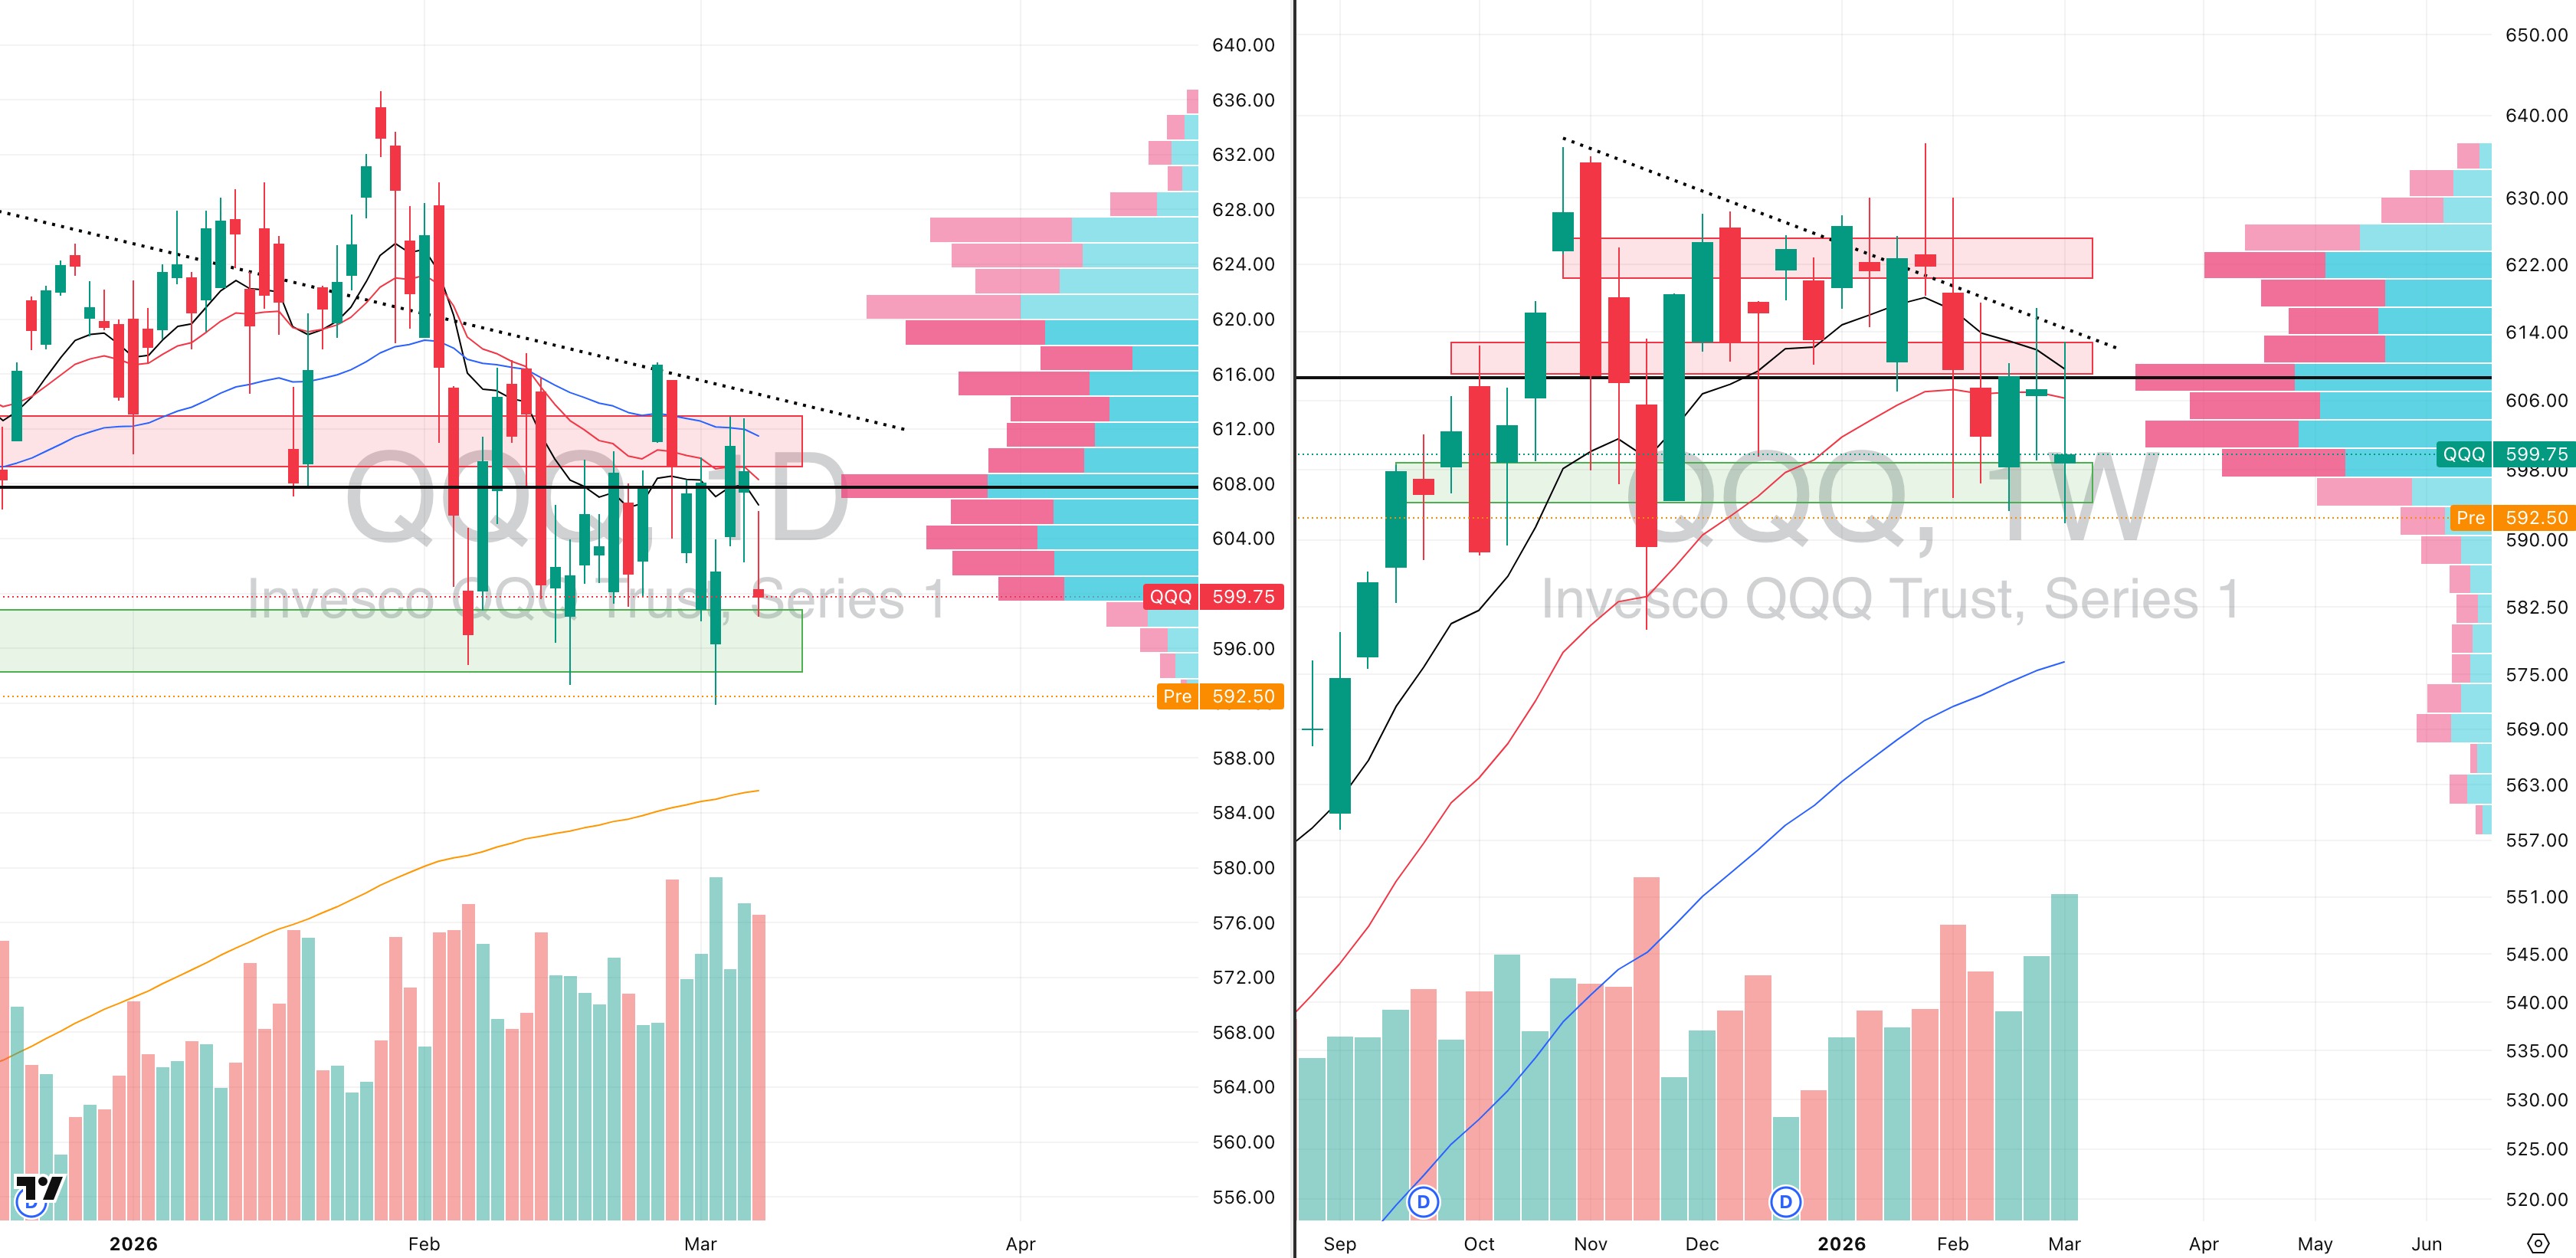
QQQ VRVP Daily & Weekly Chart
46.53%: over 20 EMA | 38.61%: over 50 EMA | 48.51%: over 200 EMA
The Nasdaq is now clearly trading inside a Stage 4 markdown phase and last week price rejected the declining 10-week moving average around $614, while also failing at the 20-week EMA.
On Friday we saw another rejection of the 10-day moving average, and importantly this occurred on very elevated relative volume.
Selling pressure is clearly accelerating. Friday’s session printed roughly 144% relative volume, while the weekly structure closed at about 162% relative volume versus the 20-week average.
That combination of expanding volume and weakening price is exactly what you typically see during the early stages of a markdown trend.
The next key level for the Nasdaq sits near $586, which is where the rising 200-day moving average currently sits. From current levels that represents roughly another 2.4% downside move, and given the pace of the selloff it would not be surprising to see that level tested relatively soon.
S&P 400 Midcap
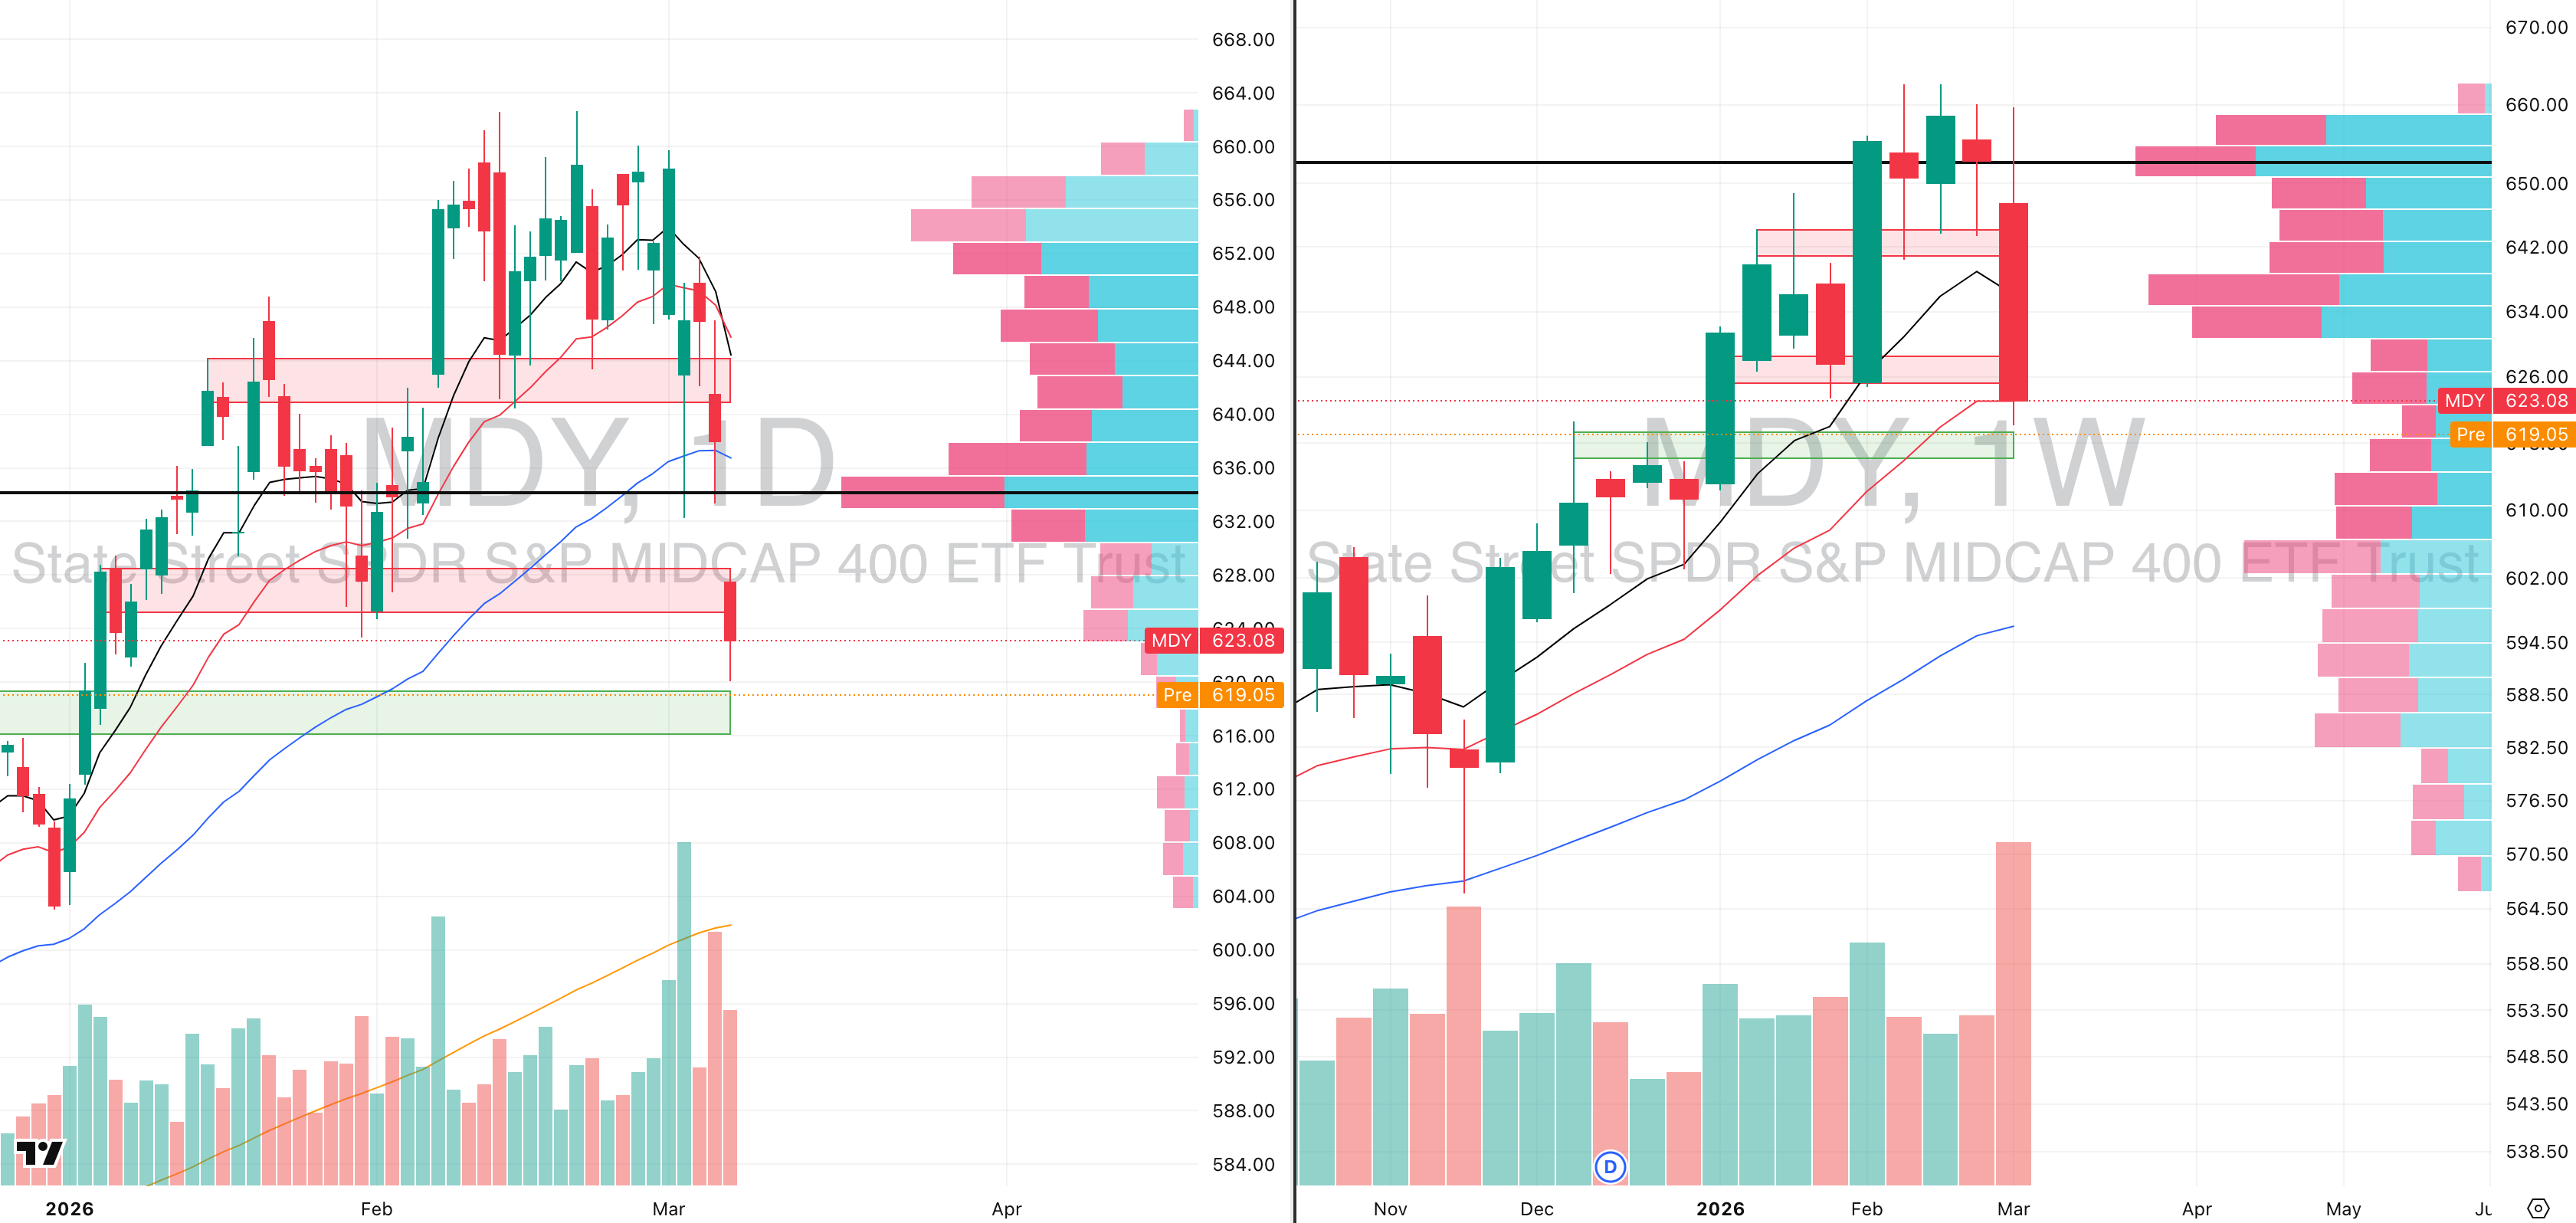
MDY VRVP Daily & Weekly Chart
24.25%: over 20 EMA | 33.51%: over 50 EMA | 54.25%: over 200 EMA
The midcap segment experienced a complete mean reversion last week. The weekly candle printed 197% relative volume versus the 20-week average, while the weekly range expanded to 6.1%, which is roughly double the typical 3% average weekly range.
Technically, MDY initially held the 20-week EMA, but we are now seeing price gap below that level this morning. In the current environment we want to emphasise that traditional signals such as candlestick patterns carry far less reliability because the market is extremely headline driven.
If price fails to reclaim the 20-week EMA near $623, the next logical downside level sits closer to $600, where the rising 200-day moving average currently resides. That would represent roughly another 3.5% downside move from current levels.
At the same time, midcaps are becoming extremely oversold in the short term. Breadth across the index has collapsed to just 24% of stocks trading above their 20-day moving average.
Historically, when breadth falls below roughly 25%, the market often enters short-term mean reversion territory, even if the broader trend remains weak.
Russell 2000
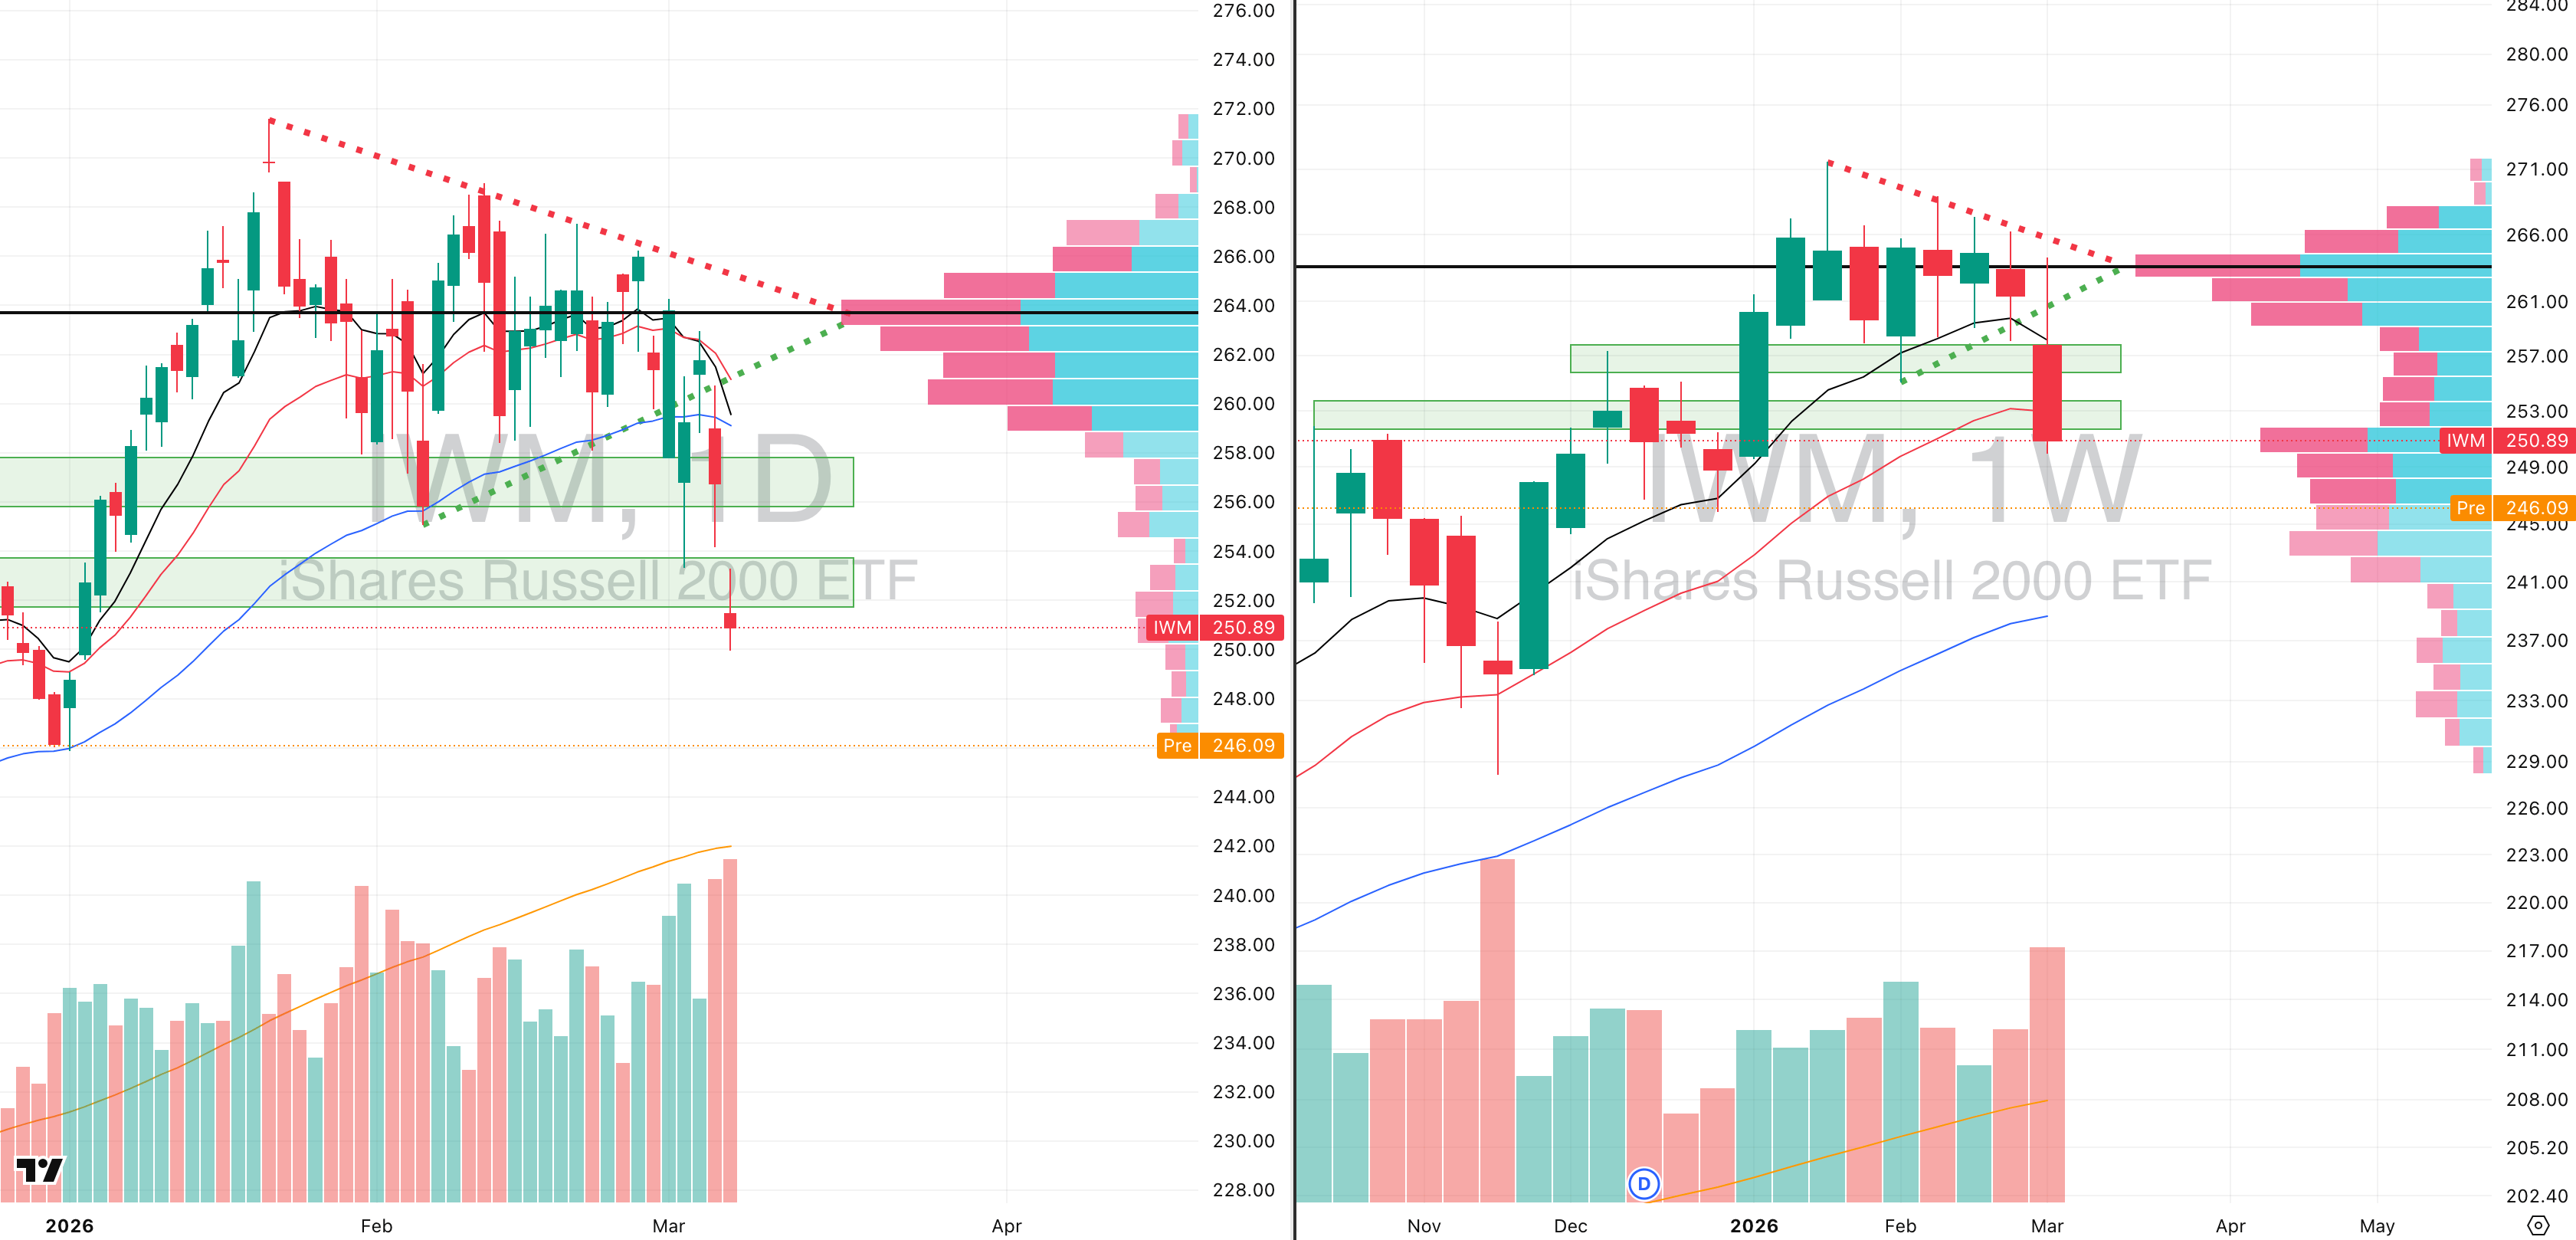
IWM VRVP Daily & Weekly Chart
29.77%: over 20 EMA | 35.34%: over 50 EMA | 54.17%: over 200 EMA
Small caps have also been hit very hard in the short term. Breadth across the group has dropped to roughly 29% of stocks trading above their 20-day moving average, reflecting broad participation in the recent selloff.
Technically, the Russell is now breaking down to its lowest levels since the breakout that launched the Stage 2 rally in late December 2025, when the index initially began trending higher off the 10-week moving average.
The structure now suggests a test of the rising 200-day moving average near $241, which also coincides quite neatly with the rising 50-week moving average. From Friday’s close that would represent roughly another 4.7% downside move.
This confluence between the 200-day and 50-week moving averages makes that area a very important level to watch. If small caps stabilise there, the market could begin forming a base. However if that level fails, the broader correction would likely deepen significantly.
FOCUSED GROUP
XLC: The Strongest Growth Sector By Far
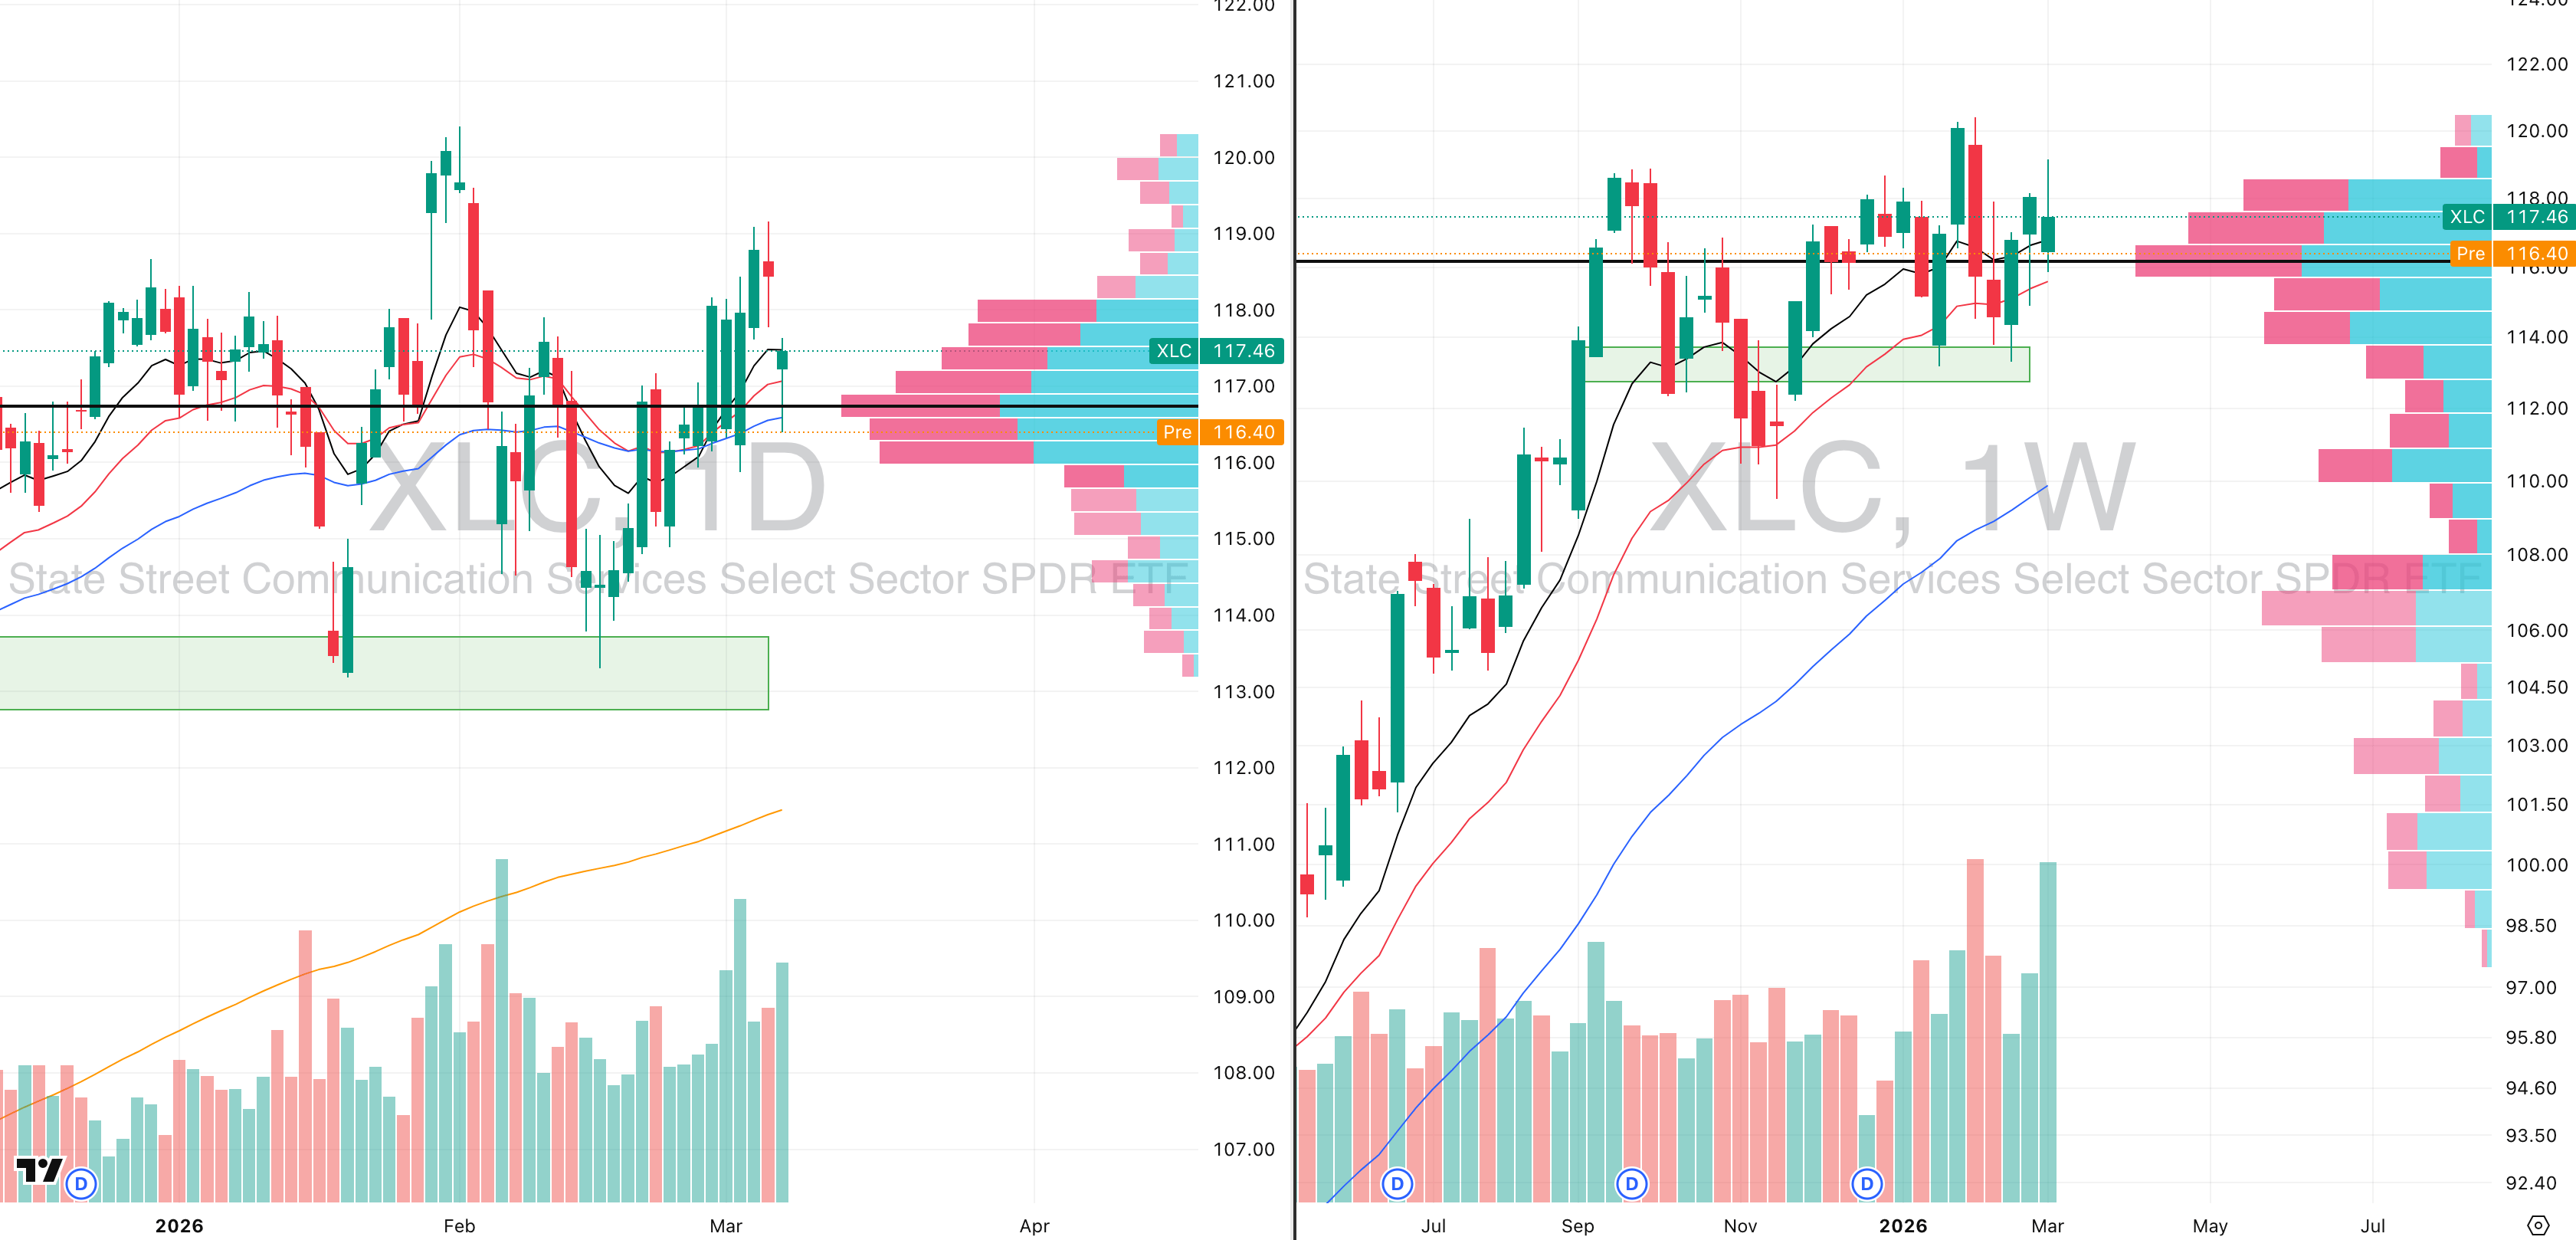
XLC VRVP Daily & Weekly Chart
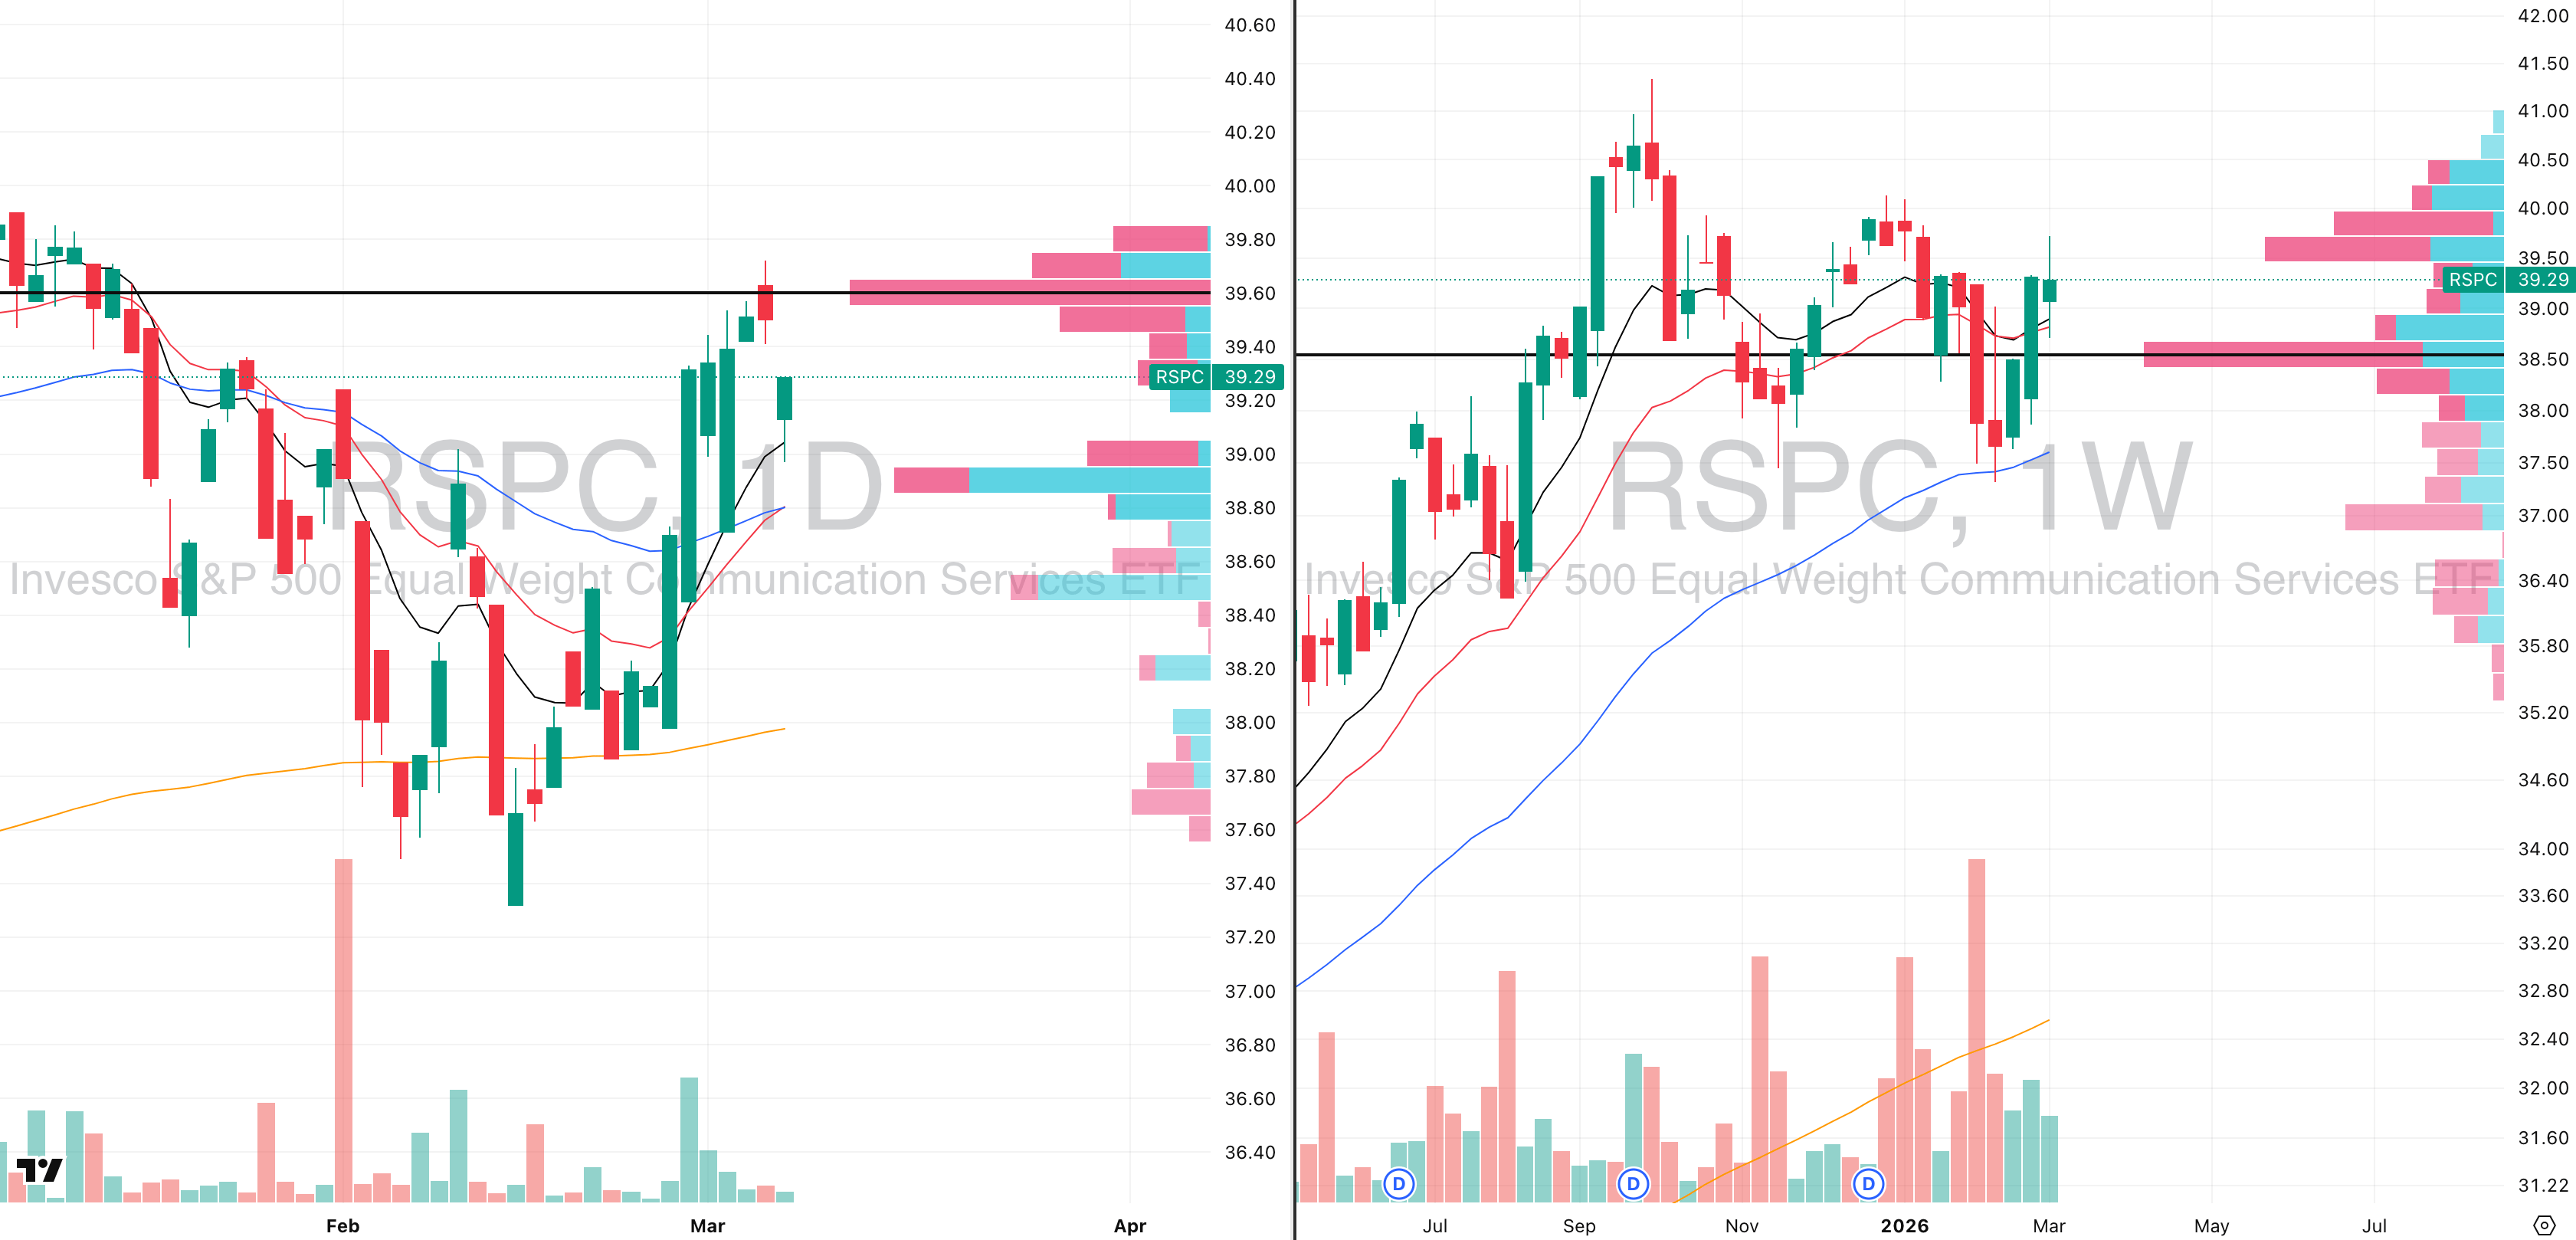
RSPC VRVP Daily & Weekly Chart
Communication Services is currently one of the few growth sectors still showing relative strength. While most areas of the market have broken down decisively, XLC continues to hold its base far better than the broader indices, which is an important signal in a market where leadership is becoming extremely narrow.
A major reason for this resilience comes down to the sector’s largest components: Meta and Google. These two companies represent the largest weightings inside XLC, accounting for roughly 38% of the entire ETF combined.
As long as these two names continue holding their structural support levels, the sector itself is naturally going to hold up better than the broader market.
This is also reflected in the equally weighted market. Even as the broader indices weaken, the equal weight structure is still attempting to push higher, which reinforces the idea that certain pockets of the market are still trying to stabilise despite the broader volatility.
That said, relative strength does not mean immediate breakouts. In the current macro environment, markets are extremely headline driven and volatile. Even sectors showing strength should be expected to produce noisy and erratic price action, rather than clean trend moves.
However, this also creates a very important downside scenario to watch. If Meta and Google begin to break below their current support levels, that would likely trigger very sharp downside moves, not only in those individual names but also in XLC as a whole.
In that case, the sector could quickly transition from relative strength to one of the most attractive short opportunities in the market. A breakdown in both Meta and Google would almost certainly pull XLC lower as well, making the ETF itself a potential short vehicle.
As long as the leaders hold, the sector remains relatively resilient. If they fail, the same leadership concentration could turn into accelerated downside momentum which is tradable.

Did you find value in today's publication?This helps us better design our content for our readers |
Reply