- Swingly
- Posts
- 🚩 Some Red Flags Flashing
🚩 Some Red Flags Flashing
OVERVIEW
Selective Strength Beneath the Surface
🟡 Neutral → Risk-On
Markets faded intraday, but no major damage done. Price pulled back on low relative volume, and breadth remains firm- this still looks like digestion, not distribution.
📈 Earnings & Extremes Collide
Big Tech earnings begin this week with Alphabet and Tesla, and while valuations are stretched, internals still support upside. These prints will set the tone for the QQQ-led AI trade.
📊 Internals
The McClellan VSI holds above 1590, and Net New Highs/Lows flipped to +2.94%, confirming broad participation and trend health, despite day-to-day volatility.

MARKET ANALYSIS
Big Tech Earnings Take Center Stage

US stocks closed mixed Monday, but the Nasdaq and S&P 500 hit fresh record highs, fueled by optimism ahead of a heavy tech earnings week. The Nasdaq gained 0.4%, marking its sixth straight record close, while the S&P 500 crossed 6,300 for the first time.
Investors are focused on two main themes this week: the looming August 1 deadline for sweeping US tariffs and earnings from tech giants like Alphabet and Tesla, set to report Wednesday. Strong results could justify lofty valuations amid renewed AI-driven enthusiasm, though comparisons to past tech bubbles linger.
On the trade front, tensions persist as the EU threatens retaliation if no deal with the US materializes. White House officials maintain a firm stance on tariffs, emphasizing deal quality over speed.
Meanwhile, solid earnings from Cleveland-Cliffs, Verizon, and Domino’s Pizza helped offset tariff-related uncertainty, with 86% of S&P 500 companies beating expectations so far this season.
Key takeaway: The market’s rally is real but balanced between trade tensions and earnings optimism.
Nasdaq
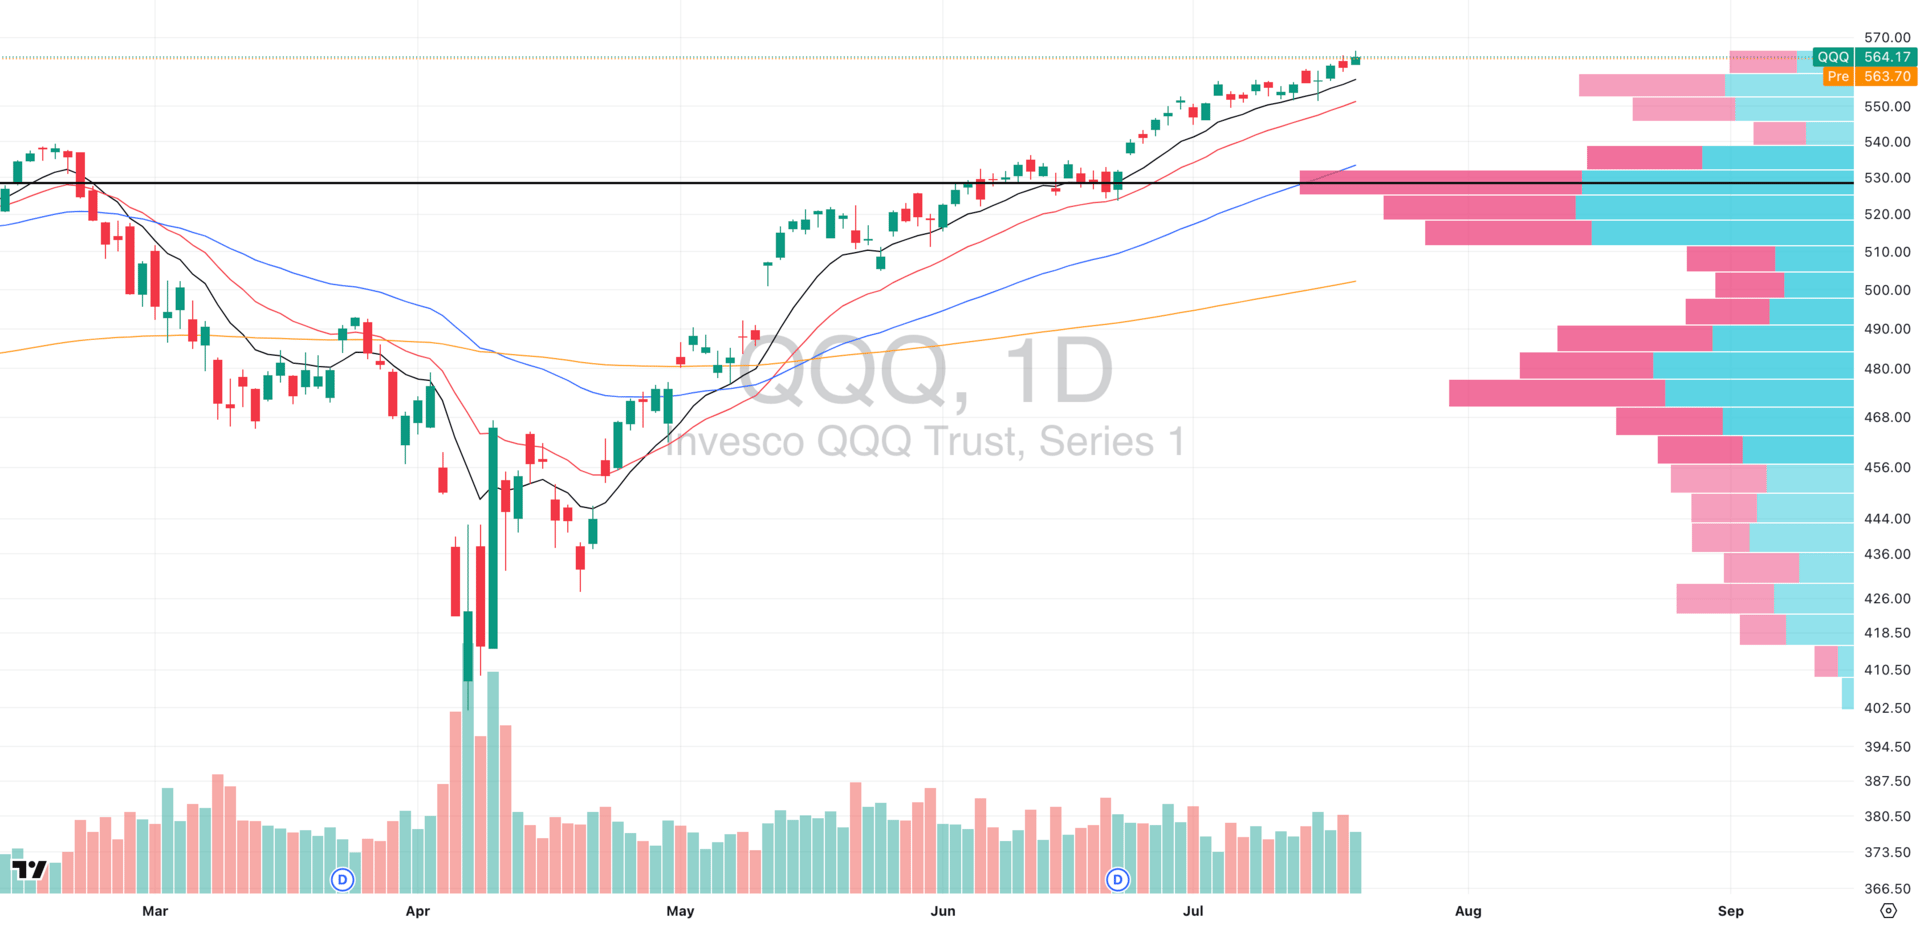
QQQ VRVP Daily Chart
The cap-weighted QQQ saw modest weakness yesterday, fading from early strength in a controlled, low-relative volume pullback.
📉 Momentum Slipping in High Beta
We’re seeing momentum cooling in the high-beta names that led this recent move. While giants like NVDA, MSFT, and GOOGL continue to dominate and artificially support QQQ, there’s emerging weakness in the mid-sized components underneath.
That’s why we turn our attention to:
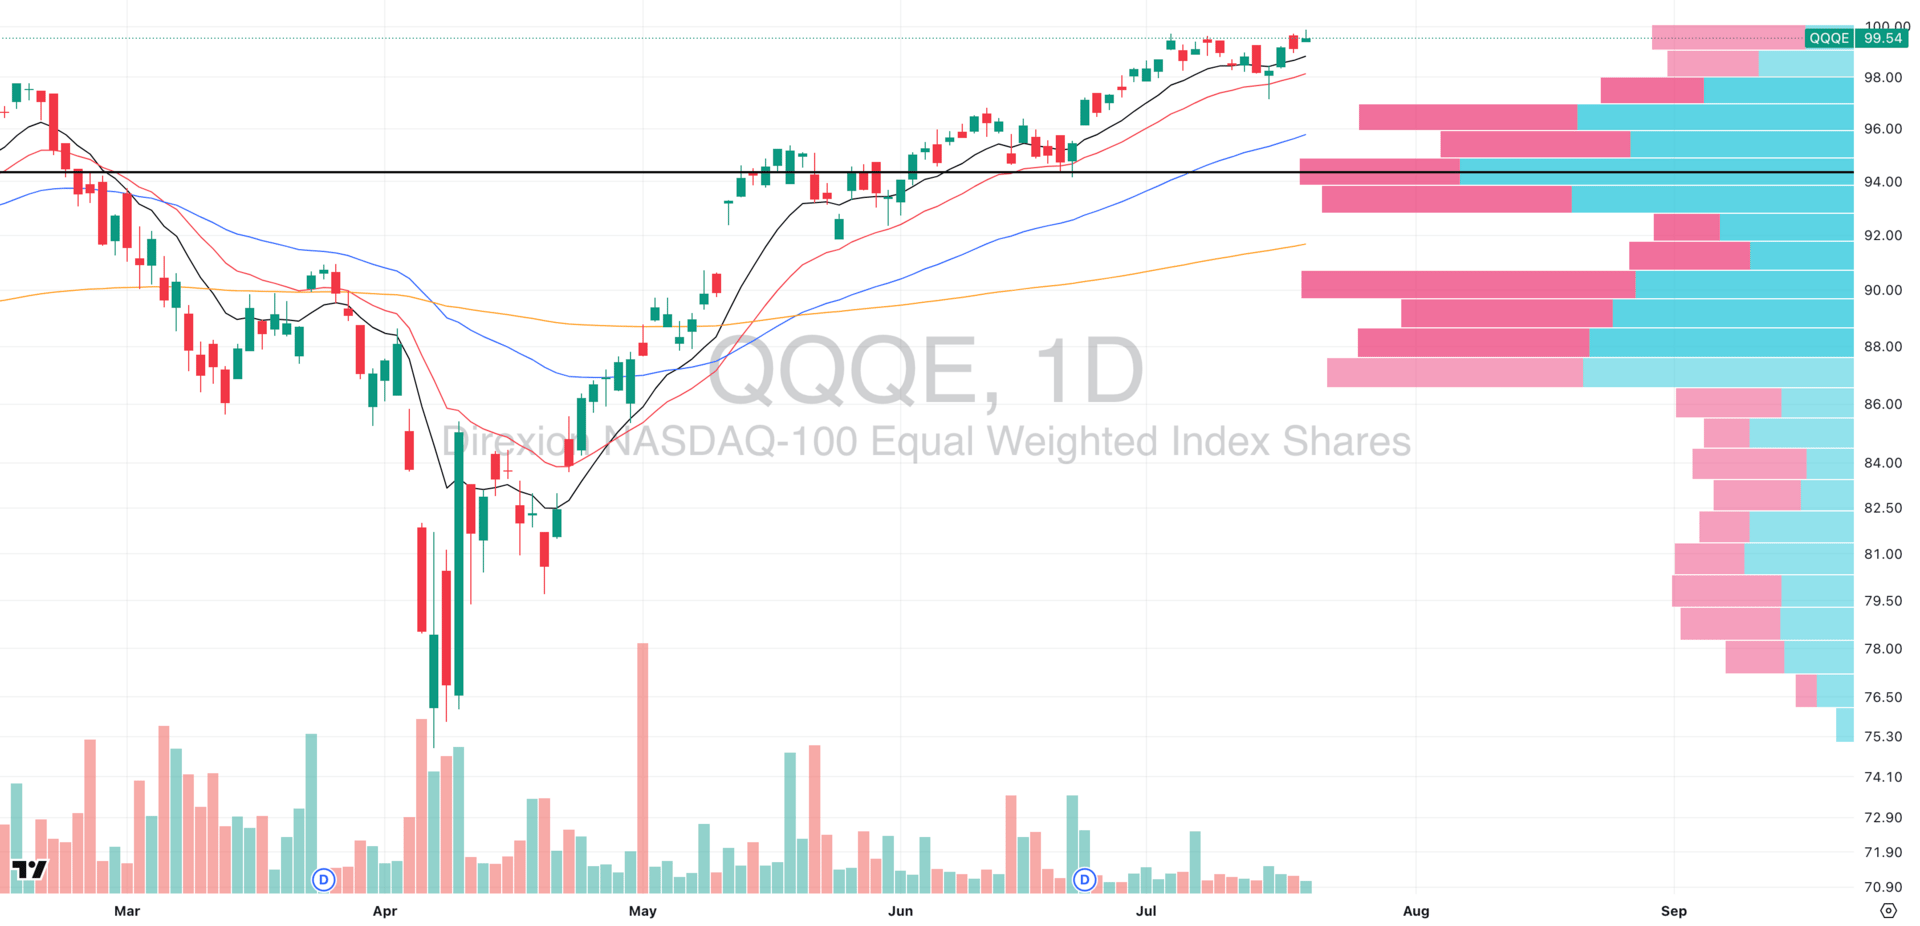
QQQE VRVP Daily Chart
The QQQE, which equal-weights the Nasdaq 100 and strips out mega-cap distortion, has now printed two consecutive fade days (Friday and Monday), both on low relative volume, suggesting a pause, not panic.
🔍 $100 Level = Key Volume Structure
Here’s the standout detail: near $100, the Visible Range Volume Profile (VRVP) shows a massive cluster of red volume, meaning this price zone has been an area of aggressive selling pressure.
🧠 Why This Matters
When price re-enters a zone of prior distribution (or creates a new zone on all time highs), two things can happen:
If demand absorbs it, that signals structural strength.
If price rolls over, we will see further weakness under the surface that begins to accelerate rather quickly to the downside, as contrarians get built up and the long trade gets crowded.
🧭 Key Takeaway:
QQQ remains technically strong, but the internals tell a more cautious story. Leadership is narrow, breadth is thinning, and any stumble in the mega-caps this earnings week could ripple fast- be warned.
S&P 400 Midcap
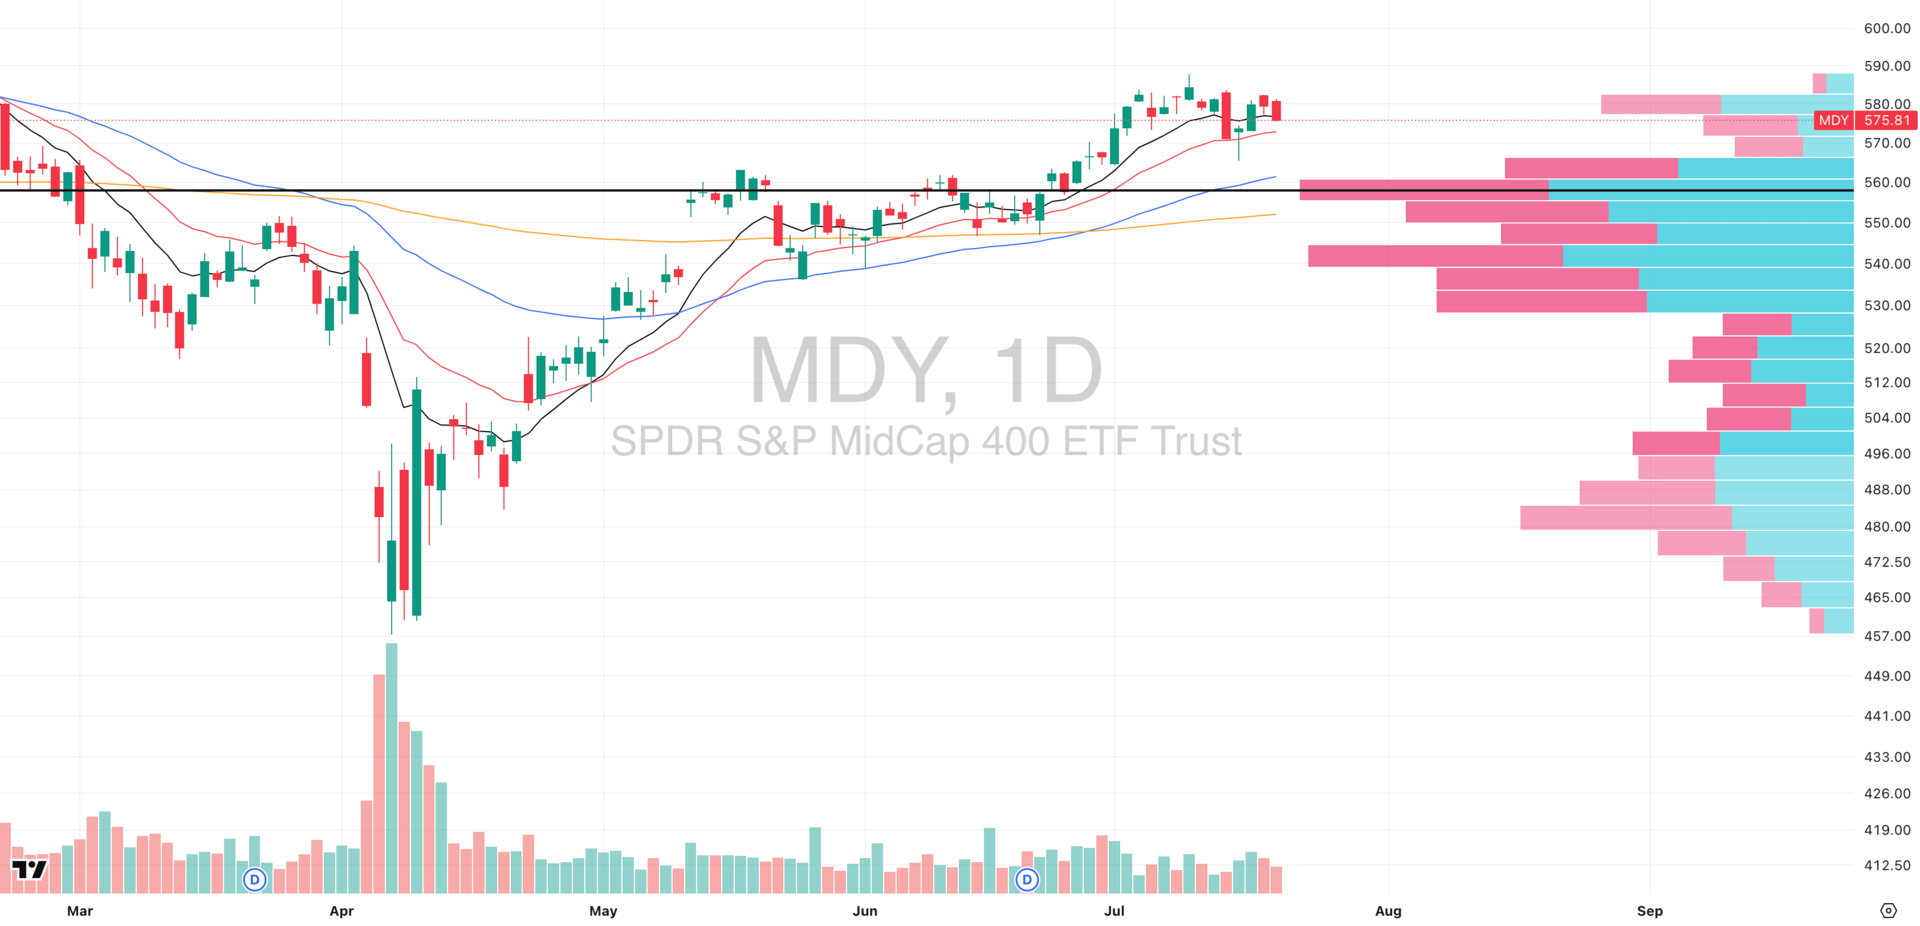
MDY VRVP Daily Chart
Midcaps (MDY) pulled back again yesterday, closing just below their daily 10-EMA and now looking poised to test the more critical daily 20-EMA today.
📉 Morning Star at Risk of Invalidation
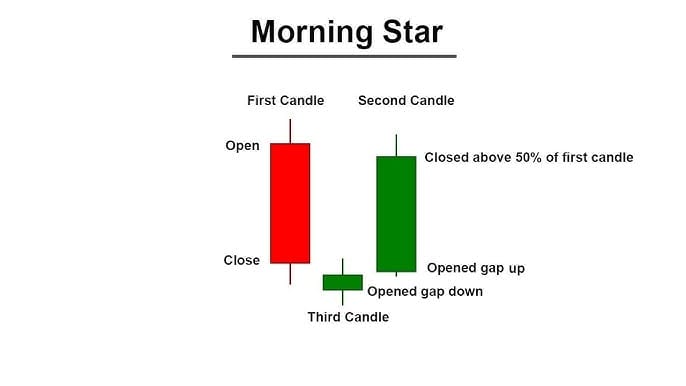
Last week’s Morning Star reversal, typically a high-probability bullish pattern, is now under pressure. Price action is retracing more than expected, and unless buyers step in soon, that reversal setup could be fully negated.
🔍 But Volume Says… Patience
There is a silver lining here: relative volume has been low during both of the last two red days. This suggests we’re seeing controlled digestion and not aggressive distribution, a key distinction when managing risk.
📌 Level to Watch:
Keep a close eye on the $570-$578 zone (aligned with the 20-EMA and recent breakdown shelf). If MDY holds this area and finds demand, the broader structure remains intact.
Russell 2000
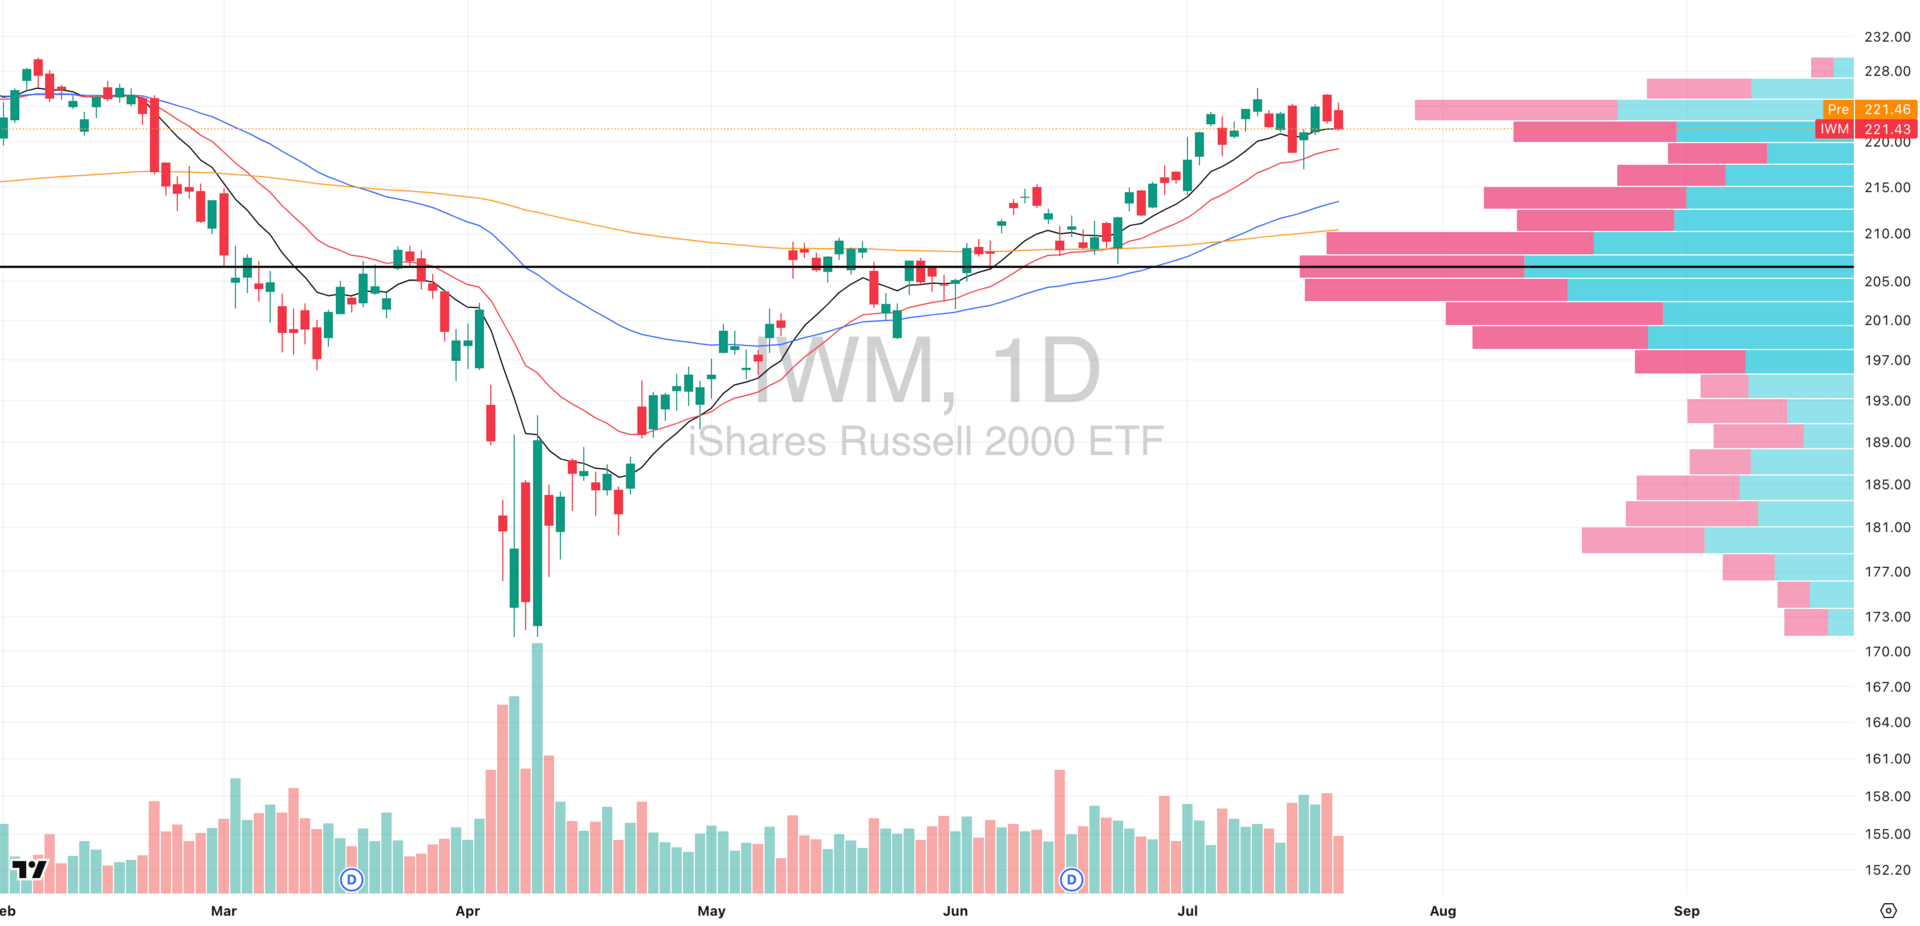
IWM VRVP Daily Chart
The Russell 2000 (IWM) pulled back yesterday, fading down into its rising daily 10-EMA just like the midcaps.
🔍 Volume Divergence Developing?
While Friday's rejection candle came on elevated relative volume, suggesting strong supply, Monday’s pullback was on notably lighter volume, signaling a lack of aggressive selling. This divergence between price and volume isn’t actionable just yet, but it’s an early sign to monitor.
📌 Key Level: Daily 20-EMA Support
Last Wednesday, we saw a clear Morning Star reversal pattern form right off the daily 20-EMA, triggering strong demand and helping to reclaim trend structure. That level (around $222–223) is now shaping up as a critical "line in the sand."
🧠 Why It Matters
If the market is attempting to rotate into risk-on breadth, small caps will likely be the first to respond. IWM needs to hold and bounce from this zone to validate that scenario. If it fails here, it could signal continued hesitation beneath the surface and will be the first sign the risk appetite might be decreasing.
Missed the Market’s Big Moves?

The market moves fast - we make sure you don’t miss a thing.
Elite Trade Club delivers clear, no-fluff market intel straight to your inbox every morning.
From stocks to big-picture trends, we cover what actually matters.
Join 100,000+ readers who start their day with the edge.
FOCUSED STOCK
RDDT: Quiet Strength In A Choppy Market
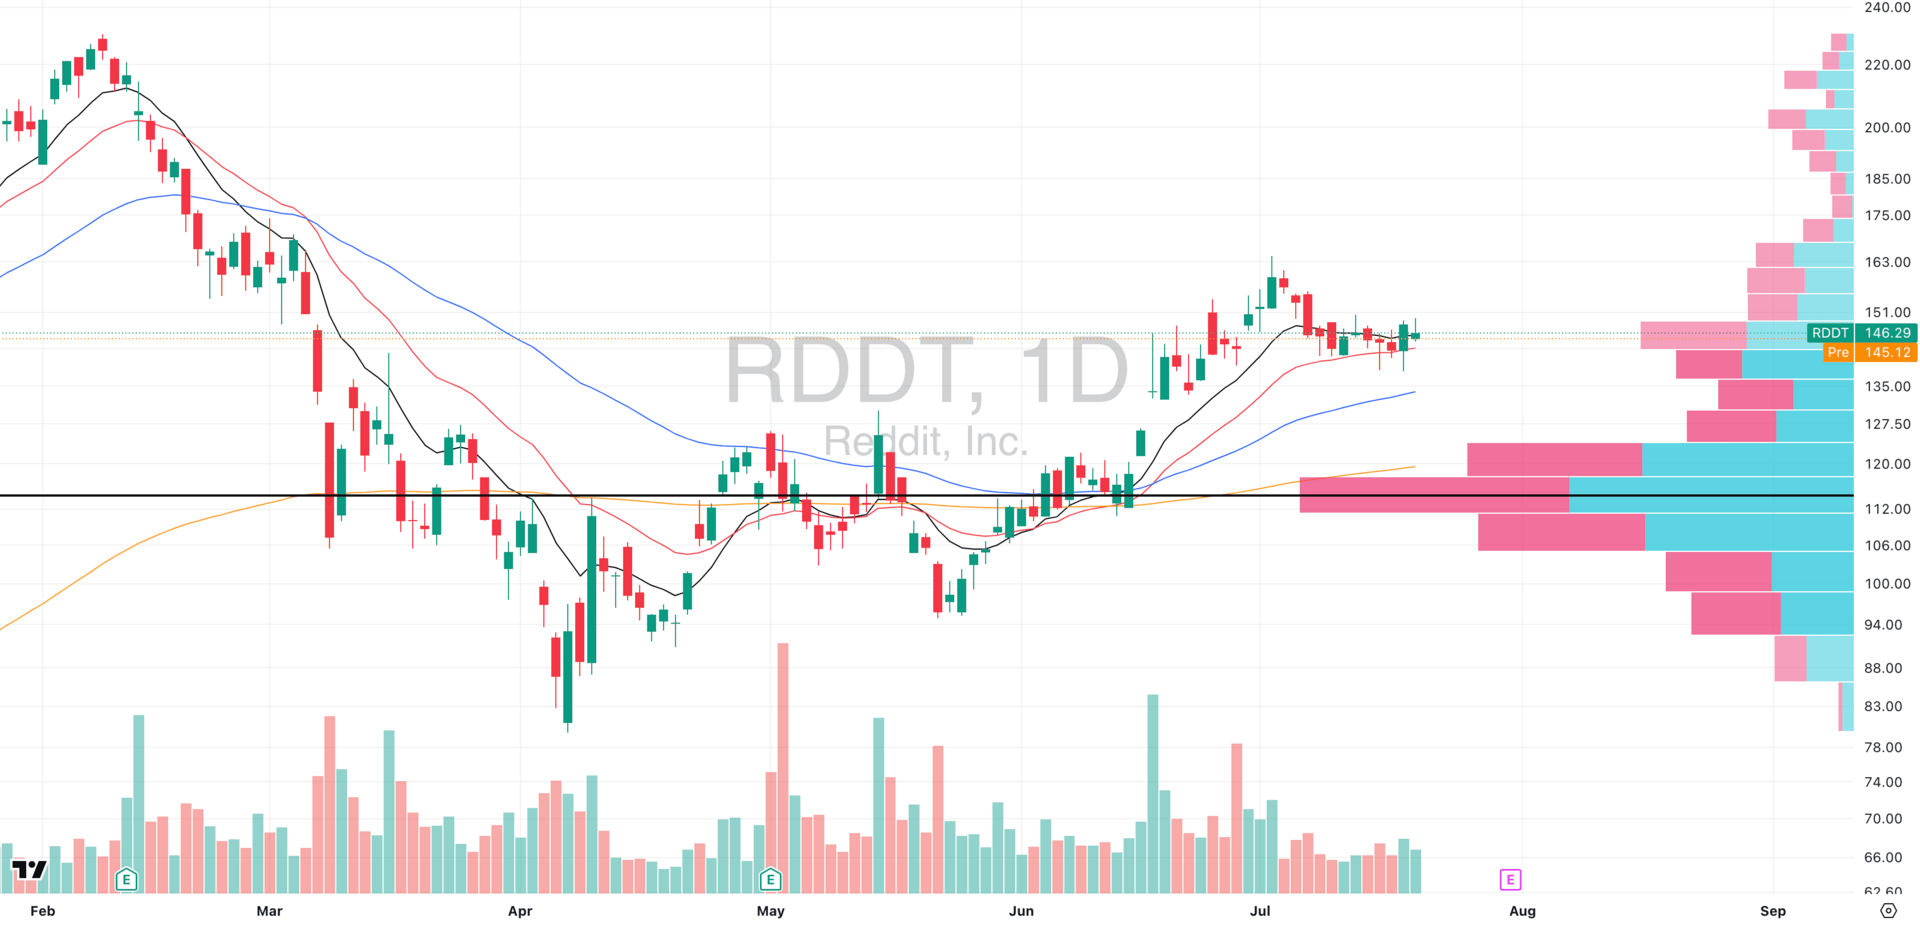
RDDT VRVP Daily Chart
While many high-beta names have shown signs of stress over the past few sessions, Reddit (RDDT) is standing out for all the right reasons.
✅ Structural Context
RDDT has been quietly consolidating around its rising daily 20-EMA, building a tight base right on top of the $145–$151 volume shelf visible on the Volume Profile.
This area has historically attracted strong demand, and recent price action continues to respect it.
📊 Volume Confirmation
Friday’s session was particularly notable. RDDT initially undercut the 20-EMA, a textbook shakeout, only to reverse sharply and close with a powerful green hammer candle.
Not only did this candle engulf the prior range, it also printed on elevated relative volume, a key sign of real support.
🧠 Why It Matters
This is exactly the type of setup we watch for post-pullback:
Trend intact
Pullback contained
Buyers stepping in on volume
Strong sector/group
Early stage 2 rally
If the broader market stabilizes, RDDT could be one of the first names to re-accelerate.
FOCUSED GROUP
IBIT: Bitcoin Still Looks Strong
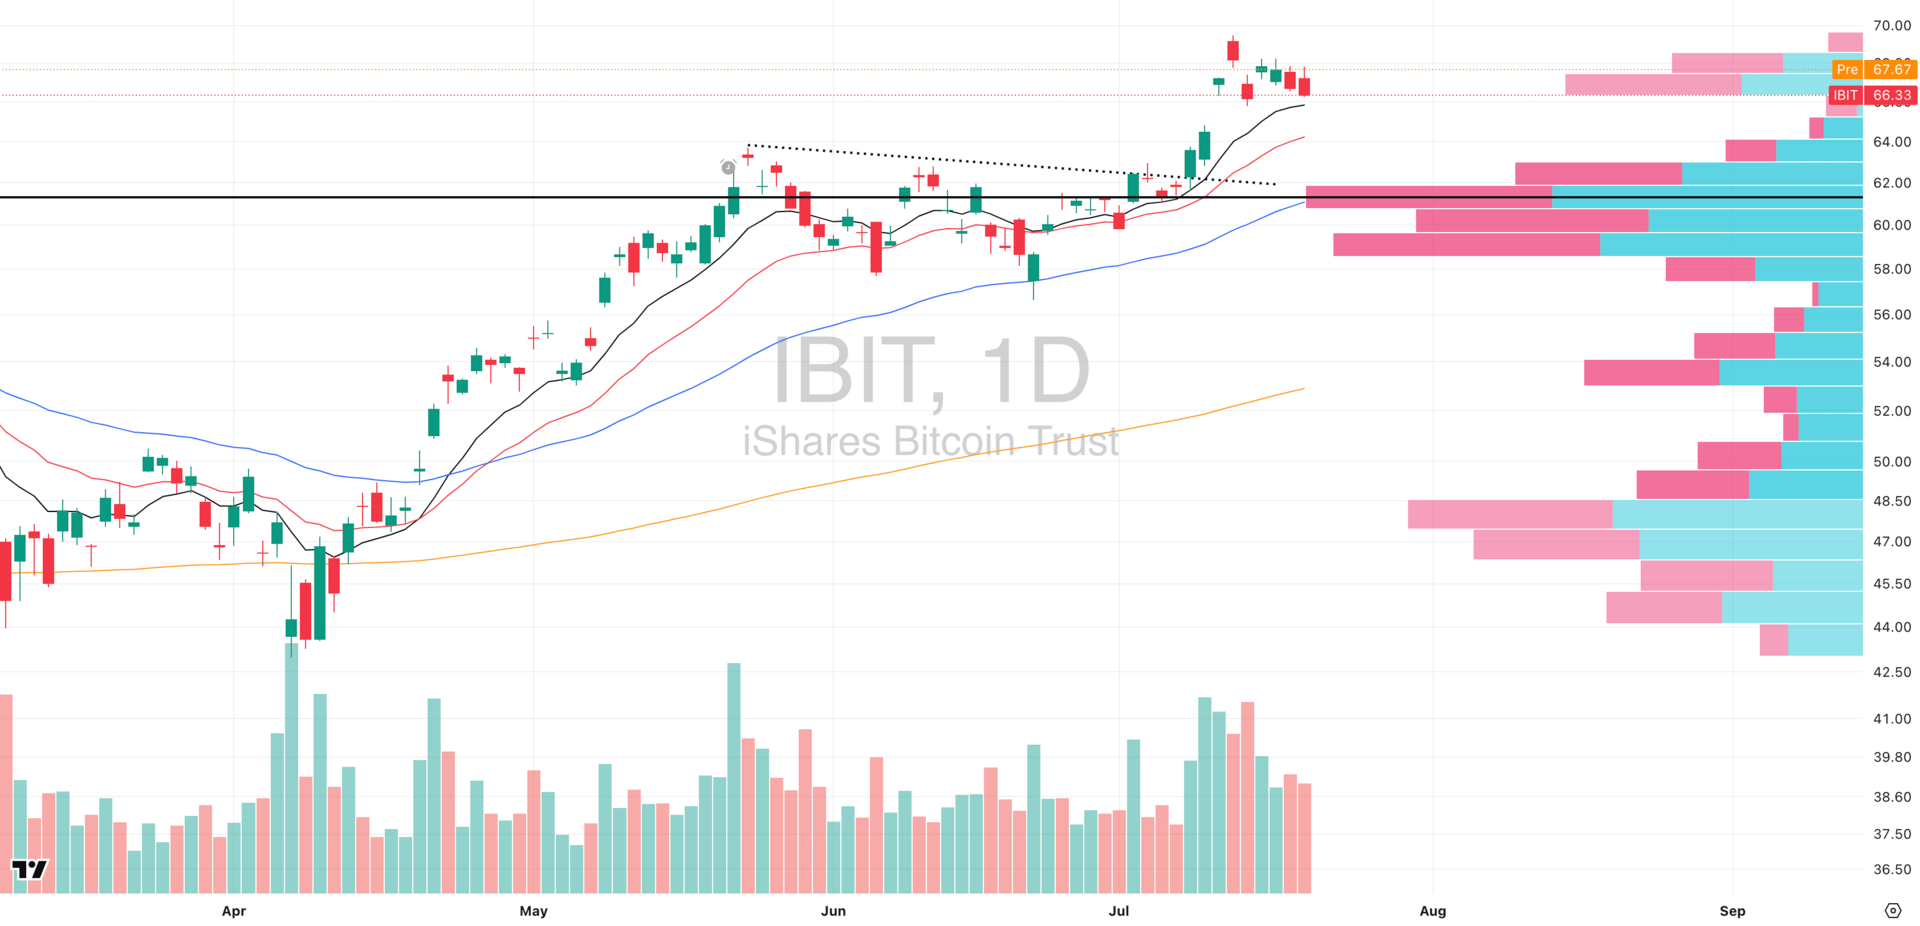
IBIT VRVP Daily Chat
Monday’s session brought sharp intraday volatility to crypto markets, with BTCUSD opening strong before fading hard into the close, a move that triggered correlated weakness across the entire crypto-adjacent ETF space, including IBIT.
But underneath that surface-level shakeout, the structure on IBIT remains remarkably constructive.
Volatility Contraction Pattern (VCP): IBIT continues to tighten just above its rising daily 10-EMA. This kind of coiling price action, when paired with declining relative volume, often precedes high-velocity expansions.
Volume Tells the Story: Despite recent red candles, relative volume has stayed low, suggesting these pullbacks are orderly digestion, not aggressive distribution.
Context from BTCUSD: Bitcoin itself undercut the 10-EMA intraday and found support- a classic shakeout move that coincided with IBIT holding structure.
We still see real bullish potential here. This remains one of the cleaner ETF expressions for traders looking to play crypto momentum with clear risk-defined setups.
Unless we see a breakdown of this VCP base, IBIT looks like a high-probability pullback continuation long setup.

Q&A
We Really Need Your Help!

We’re building the most actionable trading report on the internet, and we want to hear directly from you.
Every day, we feature real trader questions, and the more context you provide, the better we can tailor the insight.
Whether you're struggling with entries, navigating volatility, or trying to level up your system, this is your chance to get personalized input.
Let’s make Swingly the sharpest trading space on the web!
Want to learn why thousands of traders trust us for their daily market reports?
That’s all inside Swingly Pro → see what’s included
Reply