- Swingly
- Posts
- Small Caps Lead, Nasdaq Waits — What Traders Need to Know
Small Caps Lead, Nasdaq Waits — What Traders Need to Know
In partnership with
OVERVIEW
The Trend-Following Danger Zone
Breadth is holding across the market, but all eyes are on NVDA earnings tomorrow afternoon, which will dictate the short-term path of the Nasdaq.
🟢 Risk-On: Small caps (IWM) and midcaps (MDY) continue to lead with strong breadth and constructive digestion after Friday’s breakout.
🟥 Risk-Off: Mega-cap tech (QQQ) remains the weakest segment, stuck in a bearish broadening wedge and effectively untradeable until NVDA clears.
🟨 Defensive/Momentum: Telecom (XTL) has surged off its 20-day EMA in a three-day rally, with ASTS standing out as a high-beta outlier. Precious metals (EGO) remain relative leaders pressing toward new highs.

MARKET ANALYSIS
Expect A Choppy Market Today

Macro news is light today. Most of the headlines (Fed board reshuffling, political drama, tariffs) don’t materially impact near-term price action. What actually matters:
👉 The market is holding breadth steady ahead of NVDA earnings tomorrow afternoon.
This is the event. With the Nasdaq pinned in a vulnerable wedge and breadth leadership already shifting into mid and small caps, NVDA’s report will dictate whether mega-cap tech finds a second wind or continues to bleed relative strength.
Until then, the tape is essentially in “wait mode.” Traders are unlikely to aggressively reposition in front of such a binary event.
Nasdaq

QQQ VRVP Daily Chart
% over 20 EMA: 50.49% | % over 50 EMA: 47.52% | % over 200 EMA: 60.39%
The QQQ, which tracks the cap-weighted Nasdaq components, has managed to hold its point of control (POC) around $564 with a short-term bounce. But structurally, nothing has changed as the ascending broadening wedge we highlighted yesterday remains in play, and historically this pattern skews bearish.
The real issue here is concentration risk. NVDA alone makes up more than 10% of QQQ, and tomorrow’s earnings report will dictate the short-term path of the entire index.
Until that catalyst is out of the way, QQQ is essentially untradeable. This is a complete avoid until we see both the numbers and, more importantly, the market’s reaction.
Technically, the $574 supply zone remains the key battleground. The index has been rejected here twice in recent sessions, and any sustained push above it would raise the probability of a retest toward the wedge top. But until NVDA resolves, those levels don’t matter.
S&P 400 Midcap

MDY VRVP Daily Chart
% over 20 EMA: 74.75% | % over 50 EMA: 69.75% | % over 200 EMA: 61.00%
The midcaps continue to show relative strength. After Friday’s powerful breakout, yesterday’s inside day on lower relative volume looks far more like digestion than failure.
In fact, we welcome this type of pause, especially as it’s occurring above the key $588 level, which aligns with the July 2025 range highs.
The most important thing to watch from here is whether that former resistance at $588 flips into lasting support. If it does, the character change remains firmly intact and sets up the potential for further upside extension.
Compared with the Nasdaq (20 EMA: 50.49%, 50 EMA: 47.52%, 200 EMA: 60.39%), the breadth differential is striking.
Participation is broader, leadership is healthier, and the group is simply holding up better through digestion phases.
Russell 2000
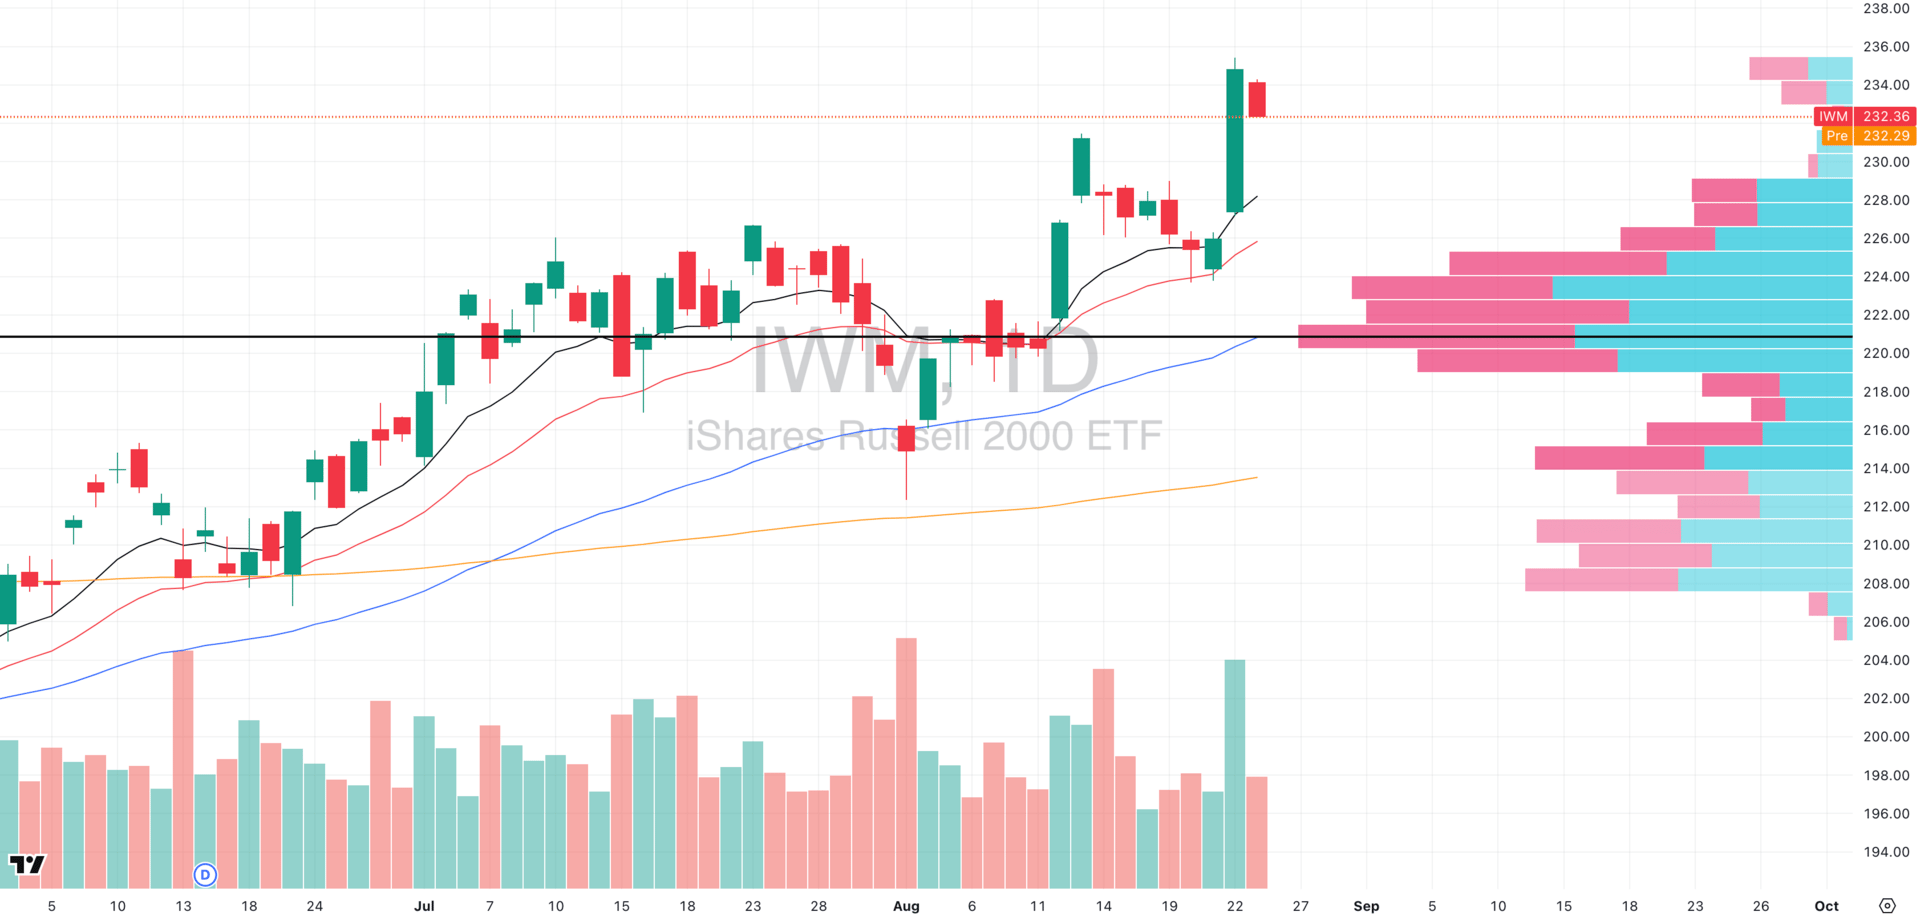
IWM VRVP Daily Chart
% over 20 EMA: 77.02% | % over 50 EMA: 69.89% | % over 200 EMA: 58.88%
The small caps remain our most bullish equity segment. Like the midcaps, IWM spent yesterday in low relative-volume digestion mode with the relative volume yesterday being less than half of what we saw in Friday’s surge. That kind of light-volume consolidation is exactly what you want to see after a powerful breakout.
Compare this with MDY (% above 20 EMA: 74.75%, 50 EMA: 69.75%, 200 EMA: 61.00%) and QQQ (50.49% / 47.52% / 60.39%), and it’s clear: small caps and midcaps are where participation is healthiest, while the Nasdaq lags.
From a structural standpoint, more consolidation into NVDA’s earnings tomorrow would actually be the most constructive outcome here. It allows moving averages to catch up and underlying support levels to climb, setting the stage for the next leg higher. Another straight-up rally would look less sustainable.
Your Daily Edge in the Markets
Want to stay ahead of the markets without spending hours reading?
Elite Trade Club gives you the top stories, trends, and insights — all in one quick daily email.
It’s everything you need to know before the bell in under 5 minutes.
Join for free and get smarter about the markets every morning.
FOCUSED STOCK
EGO: Precious Metals Still Leading

EGO VRVP Daily Chart
ADR%: 3.27% | Off 52-week high: -1.7% | Above 52-week low: +75.5%
If you’ve been following our reports since July, you’ll remember we flagged precious metals as an important group to watch as accumulation began building in both gold and silver miners. That early relative strength call has since played out, with the metals space emerging as a clear trend leader in recent weeks.
One standout is EGO, which is now pressing toward new 52-week highs. The stock has been steadily stair-stepping higher since July and is currently pushing into pre-market strength. Ideally, we’d like to see a brief contraction here to let the moving averages catch up, but the bigger picture is clear: metals are outperforming, and EGO is a prime example of a stock riding that tailwind.
👉 Broad principle for trend traders: You generally want to be looking for longs in stocks near or at all-time highs.
Stocks making new highs are:
Proving leadership: institutions are willing to keep pressing them higher.
Free of overhead supply: no trapped bagholders selling into strength.
Aligned with trend-following math: the biggest multi-bagger runs almost always begin from stocks pushing through prior highs, not from “cheap” looking names near lows.
This is why, broadly speaking, we track stocks like EGO (and other metals/miners right now) as they press into 52-week highs.
While it’s tempting to bottom-fish, the probability edge in swing trading comes from owning the strongest names in the strongest groups at or near their highs.
FOCUSED GROUP
XTL: The Leading Defensive Group

XTL VRVP Daily Chart
The SPDR S&P Telecom ETF (XTL) tracks U.S. telecom and communication service companies — a mix of traditional carriers, wireless operators, and satellite names. While telecom is generally viewed as a defensive sector, the way XTL has been trading recently looks a lot more like momentum leadership.
After testing its 20-day EMA last week, XTL has ripped higher in a powerful three-day rally, reclaiming relative strength and breaking toward new highs.
What makes this notable is that telecom is typically not where you see leadership during risk-on rotations.

ASTS VRVP Daily Chart
Within the telecom group, our favorite name is AST SpaceMobile (ASTS) — one of the more powerful high-beta growth plays in the sector.
Since its June 2025 breakout, ASTS has rallied +81% without a single close below its 10-day EMA, showing exceptional trend strength. That kind of consistency is rare in a name this volatile and signals strong institutional sponsorship behind the move.
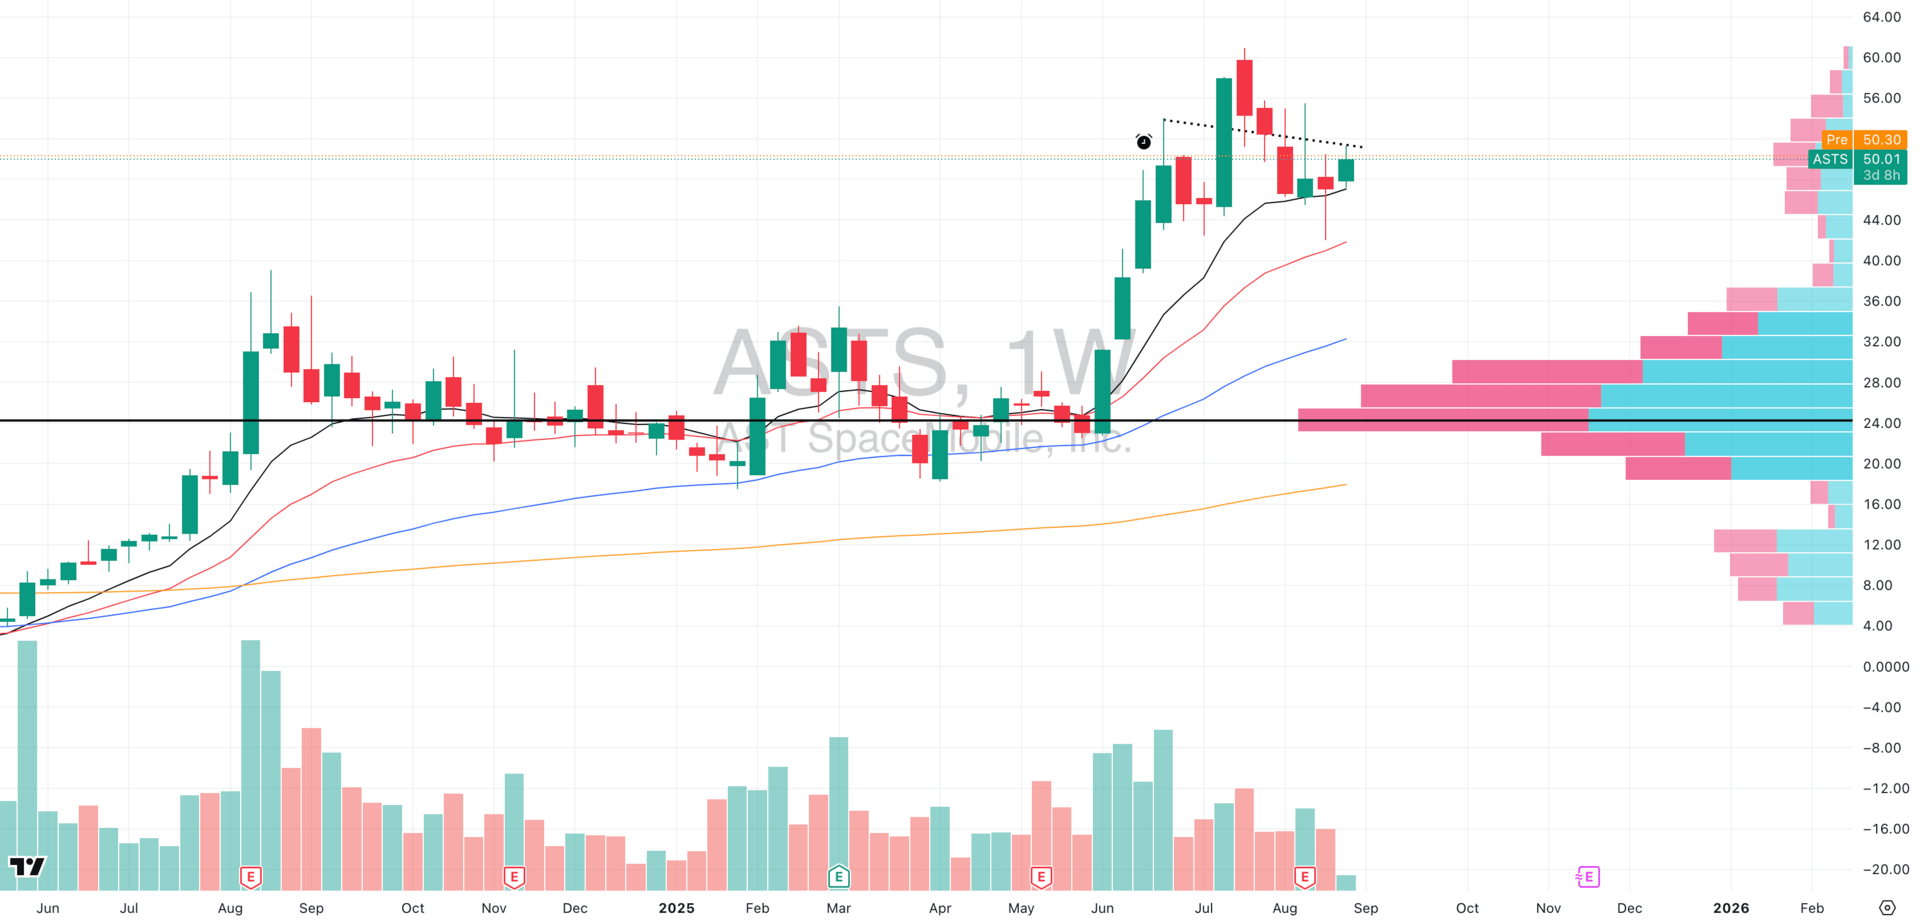
ASTS VRVP Weekly Chart
Right now, ASTS is working on a large base off its June highs. We’re seeing a series of higher lows forming as the stock tightens along its 50-day EMA, which lines up with the 10-week EMA on the weekly chart.
For swing traders, this alignment of daily and weekly structure is exactly the kind of technical setup we track and we actively scan for this kind of linear price action

Did you find value in today's publication?This helps us better design our content for our readers |
Reply