- Swingly
- Posts
- September Chop: Tech Cracks, Russell at Risk
September Chop: Tech Cracks, Russell at Risk
In partnership with

OVERVIEW
🟥 Risk Off
Seasonality bites → September is historically the weakest month; failed breakouts + no follow-through confirm chop regime.
Nasdaq under pressure → QQQ stuck below $573–574 supply, with breadth collapsing and QQQ/SPX ratio rolling over. Leadership narrowing to GOOG/AAPL = fragile.
Midcaps (MDY) → Strong weekly base-building, but immediate upside capped at $600 multi-year supply. Expect chop near highs.
Russell 2000 (IWM) → Still RS leader, but rejected at $235–236 cluster. Below 10-EMA ($232.75) risks a quick flush to 20-EMA ($229).
Focused Stock (NFLX) → Holding a flag at POC with buyers stepping in. RS candidate for when chop ends, not an immediate breakout.
Focused Group (CIBR/PLTR) → Cybersecurity at a tipping point. Break of $71.40 on CIBR = air pocket to 200-EMA. PLTR coiling at $155 shelf — weakness here is a market-wide warning.

MARKET ANALYSIS
September + Trend Failure = Chop Regime
Macro catalysts are secondary right now. ADP payrolls (+54K vs. +75K) and rising jobless claims pushed Fed cut odds above 97% for September, but the market isn’t trading off policy expectations. The tape is telling you all you need to know.
Seasonal Context → September is the weakest month for U.S. equities over the last 50 years, with median S&P 500 returns of –0.9%. The current pattern of failed breakouts and no follow-through is classic September behavior.
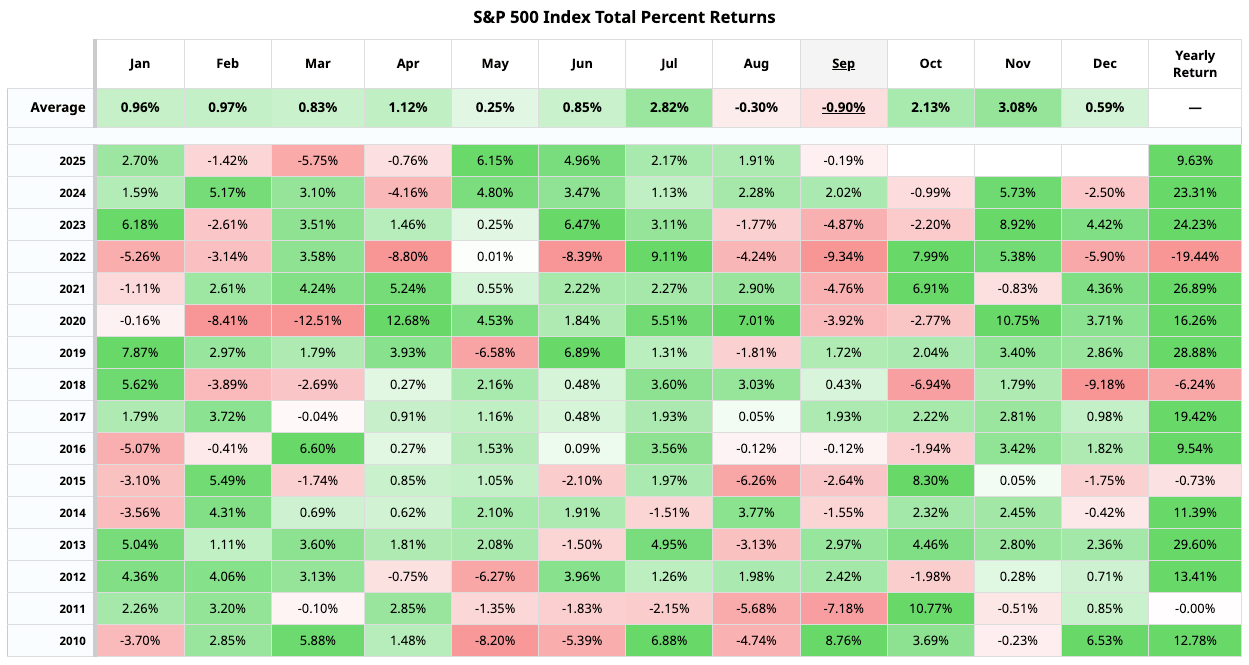
Credit: Barchart.com
Breadth/Leadership Split → Tech strength is coming almost entirely from GOOG and AAPL. Beneath that, participation is too narrow to sustain trends. This is why multi-day holds, both long and short, are statistically breaking down.
Nasdaq

QQQ VRVP Daily Chart
% over 20 EMA: 36.63% | % over 50 EMA: 38.61% | % over 200 EMA: 59.40%
The Nasdaq remains pinned under the $573–$574 supply shelf, where repeated rejections signal that sellers still dominate this zone. Yesterday’s rally looked strong at the headline level, but strip out GOOG and the index was dead weight. Since late August, relative volume has increased on down days while QQQ has slipped lower — a distribution signature, not an accumulation one.

QQQE VRVP Daily Chart
Internals confirm the deterioration. With just 36.6% of Nasdaq stocks above their 20-day, 38.6% above the 50-day, and barely 59% above the 200-day, breadth has decisively broken down.
This is exactly what failed uptrends look like beneath the surface: the generals holding the line while the soldiers retreat. The equal-weight QQQE makes that plain, still trading below its 50-day and structurally weak.
QQQ/SPX: Why It Matters
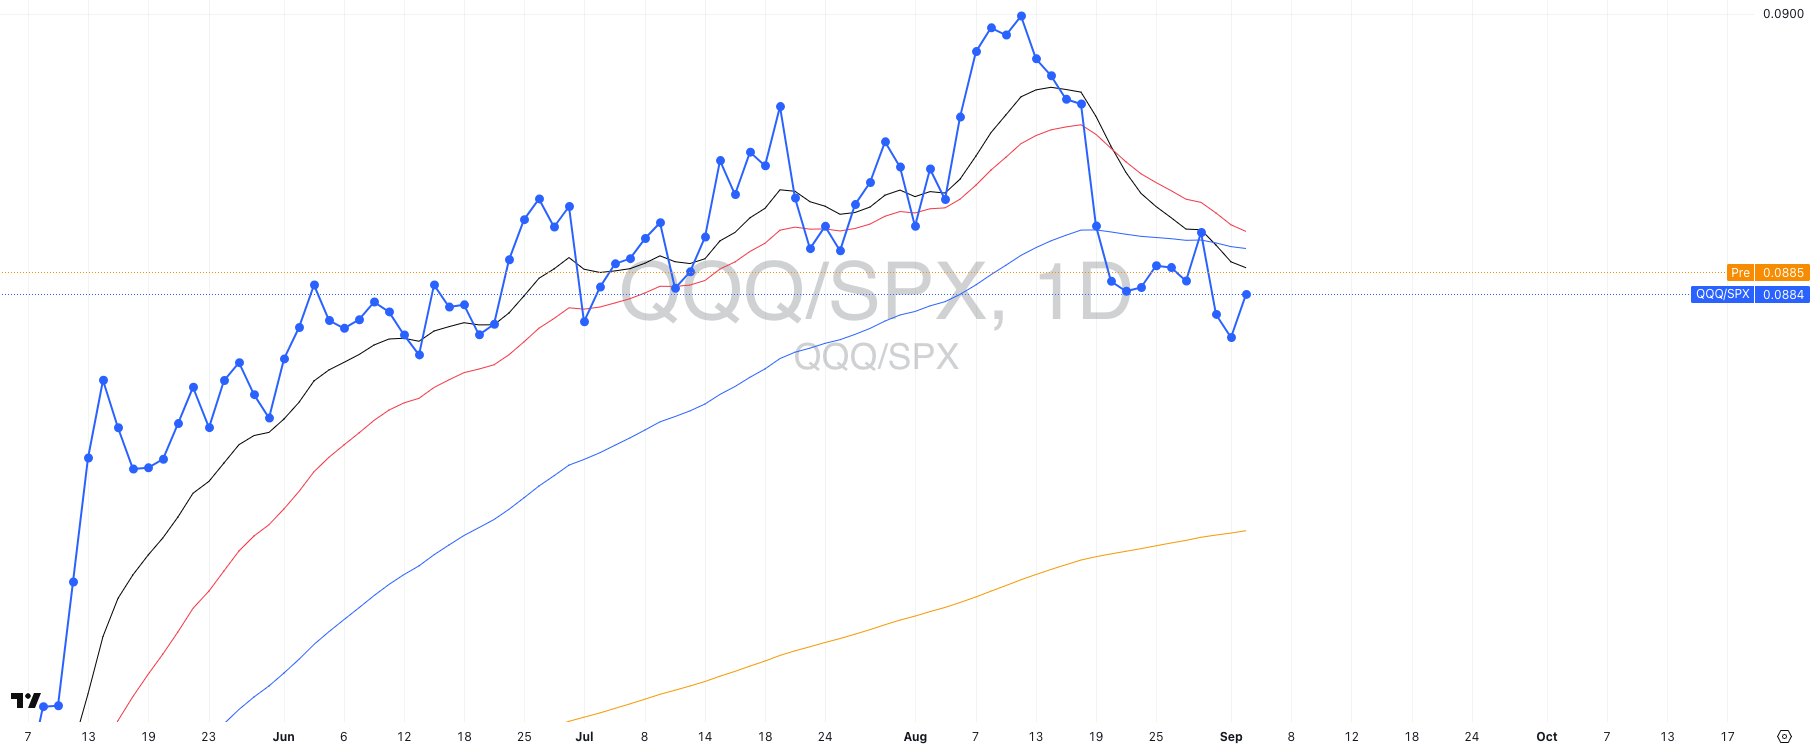
QQQ/SPX Daily Chart
The QQQ/SPX ratio measures whether the Nasdaq-100 (growth/tech-heavy) is outperforming or underperforming the broader S&P 500. When the line is rising, it means money is rotating into tech/growth relative to the rest of the market. When the line is falling, it means tech is losing leadership.
Right now, that ratio has rolled over. Despite QQQ holding up on the surface, it’s underperforming SPX. That’s important because Nasdaq leadership has been the single driver of most market’s advances in recent memory.
In these conditions, breakouts in growth are far more likely to fail, and the higher-probability trades often shift into non-tech sectors or defensive groups (precious metals), or holding cash.
S&P 400 Midcap

MDY VRVP Daily Chart
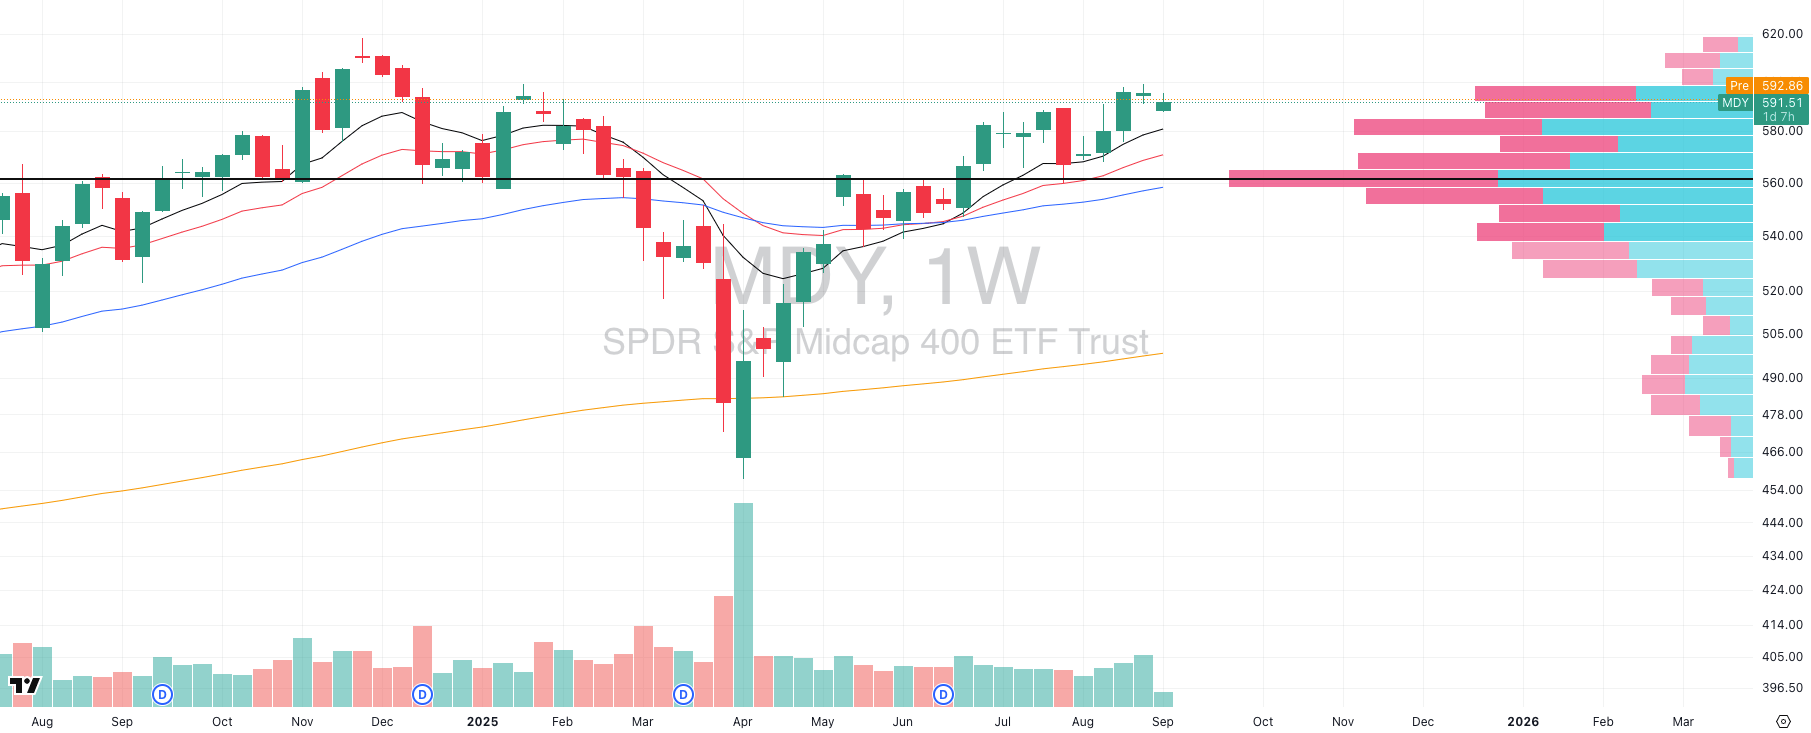
MDY VRVP Weekly Chart
% over 20 EMA: 60.50% | % over 50 EMA: 61.25% | % over 200 EMA: 60.00%
Midcaps don’t look weak when you zoom out. The weekly chart shows MDY pressing into the $600 zone, a level that has rejected price multiple times since early 2024.
The difference this time is in the volume and structure. Relative volume has expanded through August as MDY defended its 10-week EMA, a sign that buyers are supporting pullbacks rather than distributing into strength.
What this implies is not immediate breakout, but base construction beneath resistance. Markets rarely clear multi-year supply on the first test. Instead, the highest-probability path is for midcaps to consolidate, absorb sellers, and build cause.
Expect chop in the short term, but the larger timeframe still argues for constructive base-building rather than exhaustion.
Russell 2000
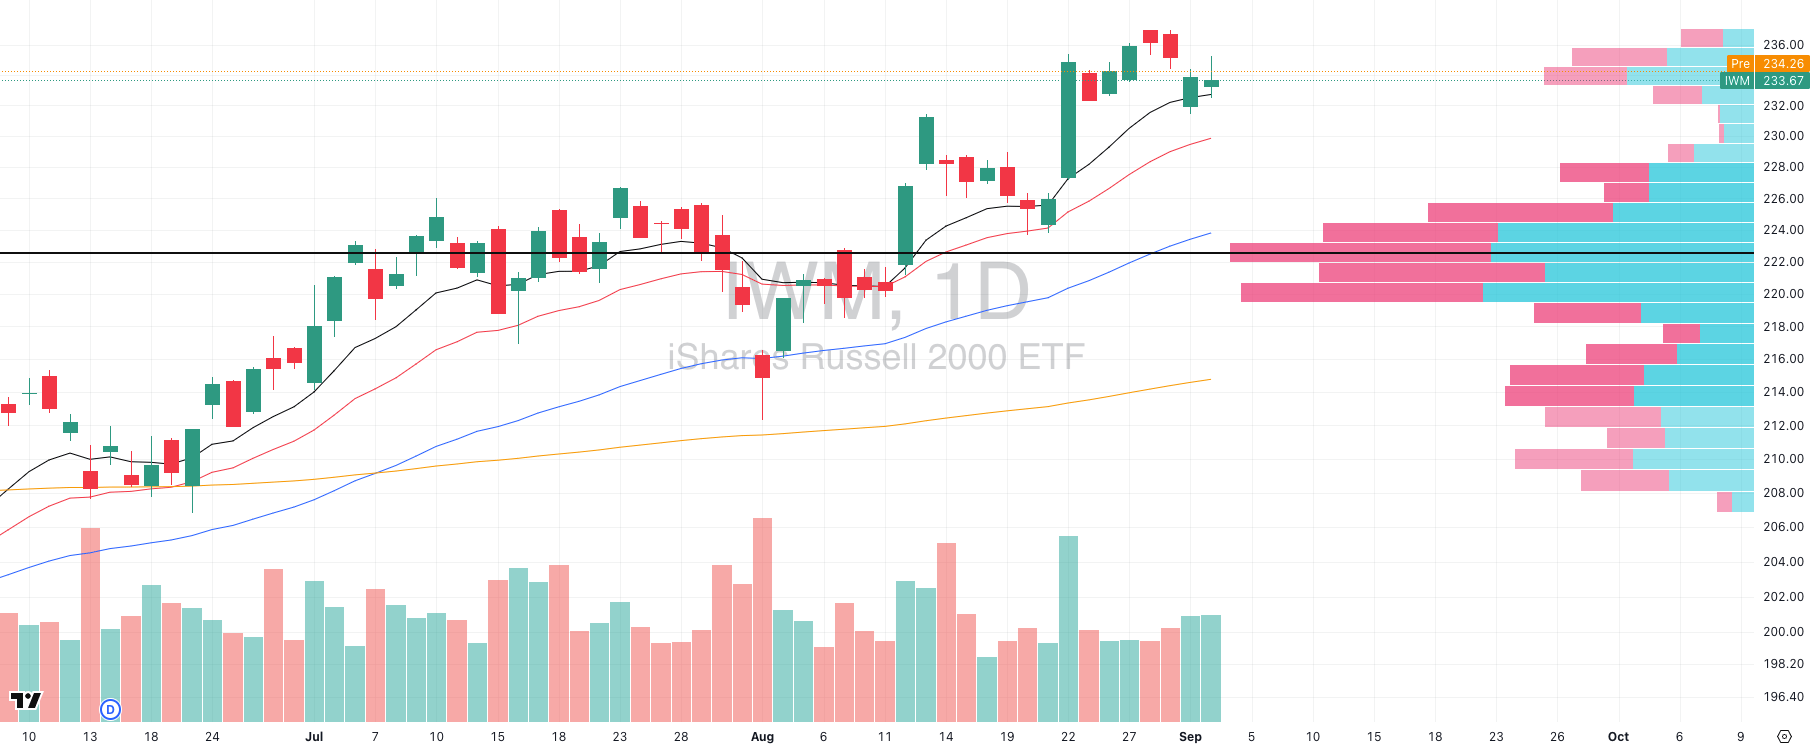
IWM VRVP Daily Chart
% over 20 EMA: 65.95% | % over 50 EMA: 65.84% | % over 200 EMA: 58.90%
Structurally, IWM has been the clear relative strength leader, continuing to ride its rising 10-EMA and defending pullbacks better than QQQ or MDY.
But yesterday’s session was the first real sign of supply: the dense VRVP volume cluster at $235–236 rejected price on elevated relative volume, showing sellers are actively defending that zone.
Best case from here would be tight sideways consolidation above $231–232 (prior breakout shelf). That would reset momentum and keep the uptrend intact.
But watch the 10-EMA closely (~$232.75). If IWM breaks and closes below that level, there’s a high-probability case for a fast flush into the rising 20-EMA at $229.
The visible range volume profile confirms this as there’s a volume pocket between $232 and $229 that could accelerate price discovery lower. That move would represent roughly –2.1% downside.
The Real Traders Aren't on CNBC

Your current options for finding stock trades:
Option 1: Spend 4 hours daily reading everything online
Option 2: Pay $500/month for paywalled newsletters and pray
Option 3: Get yesterday's news from mainstream financial media
All three keep you broke.
Here's where the actual edge lives:
Twitter traders sharing real setups (not TV personalities)
Crowdfunding opportunities before they go mainstream
IPO alerts with actual timing
Reddit communities spotting trends early
Crypto insider takes (not corporate PR)
The problem? You'd need to be terminally online to track it all.
Stocks & Income monitors every corner where real money gets made. We send you only the actionable opportunities. No fluff, no yesterday's headlines.
Five minutes daily. Walk away with stock insights you can actually act on every time.
Stocks & Income is for informational purposes only and is not intended to be used as investment advice. Do your own research.
FOCUSED STOCK
NFLX: Relative Strength Flagging at POC
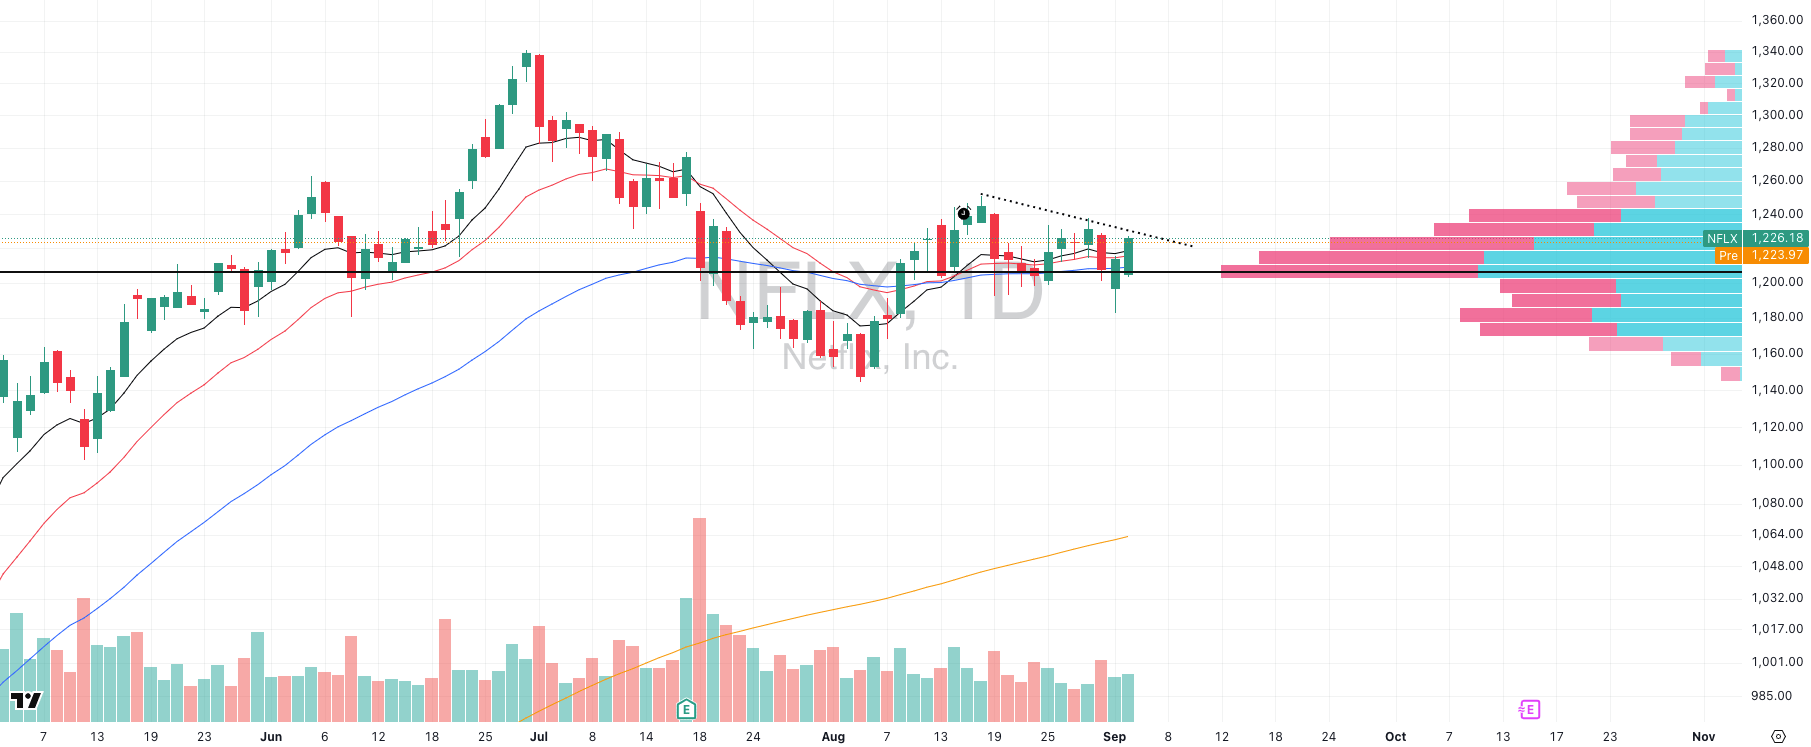
NFLX VRVP Daily Chart
ADR%: 2.23% | Off 52-week high: -8.6% | Above 52-week low: +85.6%
NFLX is quietly showing relative strength in an otherwise weak tech tape. While many peers have broken trend, NFLX has carved a tight flag right at its Point of Control (~$1,220).
Yesterday’s bounce was key: price tagged the VRVP support shelf and reversed higher, confirming that buyers are defending demand at this level and preventing a deeper breakdown.
Structurally, NFLX is digesting its summer run, refusing to give up ground while building energy beneath declining short-term MAs. The longer it holds this flag at POC without unraveling, the higher the probability it resolves upward when market conditions improve.
This isn’t a breakout setup for today as the broader environment is too choppy. But NFLX is exactly the type of RS name you want on your watchlist.
In swing trading, when you can’t push risk in chop, you switch to detective mode: find the stocks showing quiet accumulation and resilience.
When the tape clears, those are the first you want to ride.
FOCUSED GROUP
CIBR: At A Major Tipping Point

CIBR VRVP Daily Chart
CIBR is pressing against a major inflection. Price is trading below its Point of Control (~$73) with the 10-, 20-, and 50-day EMAs curling lower and showing clear evidence of momentum fading.
Structurally, higher lows remain intact, but the VRVP highlights the risk: a break under $71.40 likely triggers a sharp air pocket move toward the rising 200-day EMA ($68), where the next demand shelf sits.
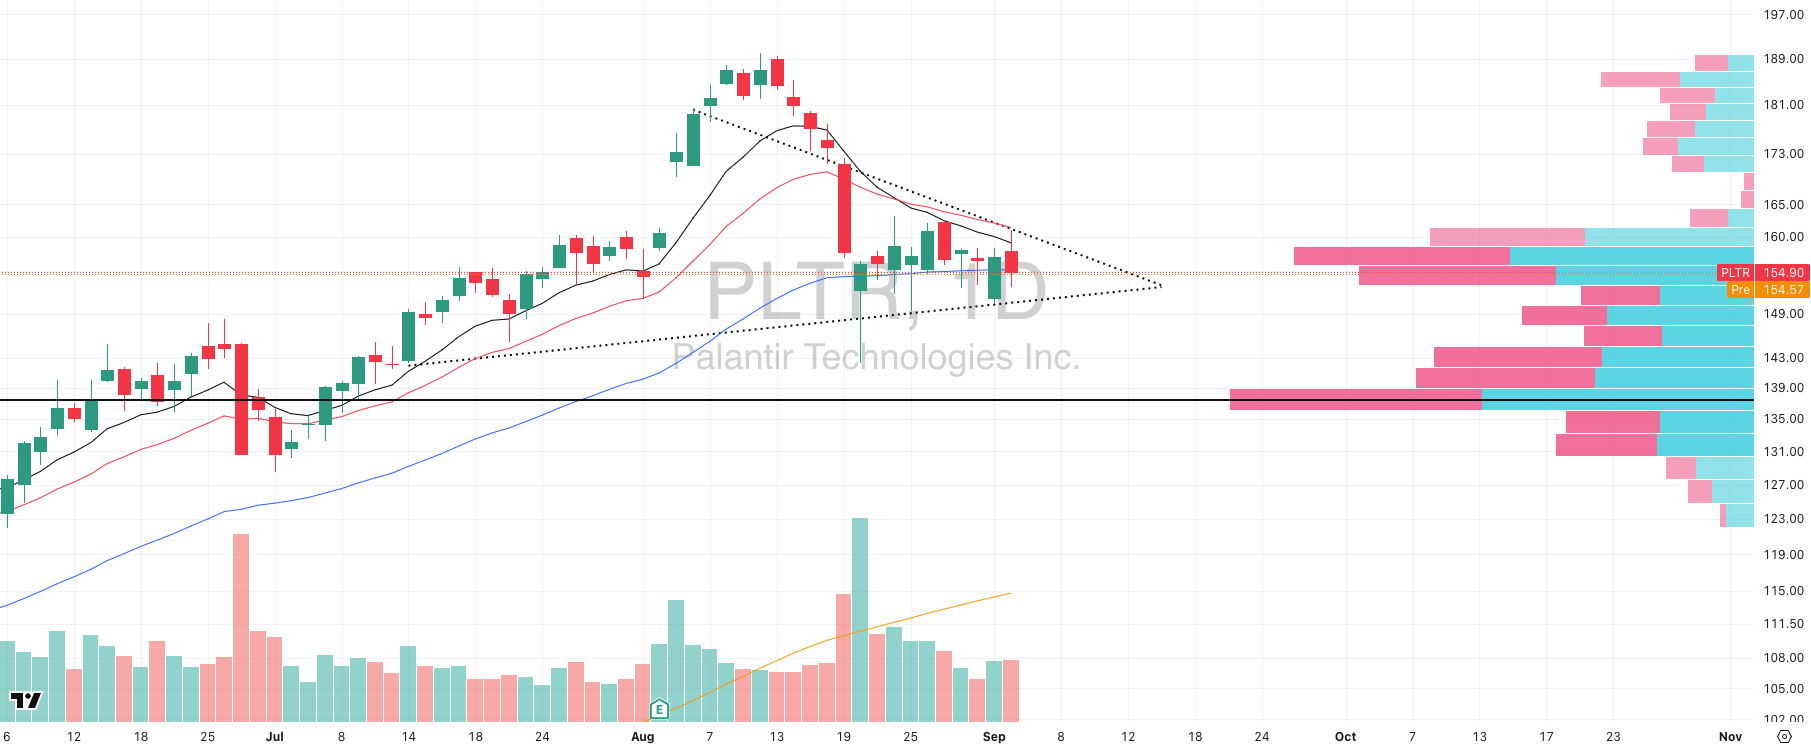
PLTR VRVP Daily Chart
This is also extremely important because PLTR has been one of the market’s broader leaders, so seeing it struggle here is a major warning sign. PLTR is coiling into a tight triangle right at the $155 VRVP shelf.

Did you find value in today's publication?This helps us better design our content for our readers |
Reply