- Swingly
- Posts
- Selling Pressure Hits Extreme Levels
Selling Pressure Hits Extreme Levels


MARKET ANALYSIS
Here’s What You Need To Know

Oil remains the dominant macro variable to begin the week, but the key overnight shift is that energy markets have at least temporarily stepped back from the most extreme stress scenario.
After briefly trading above $105 in Brent and above $100 in WTI overnight, crude has pulled back, with WTI now closer to $95 and Brent near $102 as markets respond to signs that the United States is actively trying to stabilise shipping flows through the Strait of Hormuz.
That matters because the market’s biggest immediate fear was not simply the military escalation itself, but the possibility of a prolonged disruption in one of the most important global energy arteries.
Treasury Secretary Scott Bessent confirmed that Iranian tankers are currently being allowed through the Strait, while reports also suggest the U.S. is close to announcing a multinational escort coalition for commercial shipping. That has eased some of the most immediate panic pricing in crude, at least for now.
Futures are responding positively to that moderation in oil. U.S. index futures are higher across the board this morning, with Dow futures up roughly 350 points, S&P 500 futures up around 1%, and Nasdaq futures also pushing higher.
The bounce itself should not yet be interpreted as a clean shift in risk appetite; at this stage it is more accurately a relief response after three consecutive losing weeks and an extremely defensive close on Friday.
The broader macro backdrop remains fragile because the geopolitical situation itself has not improved materially. President Trump has made clear that while oil infrastructure was spared during Friday’s strikes on Iranian military assets, that restraint could change if Iran continues obstructing shipping traffic. In practical terms, the market is still pricing a conflict that could easily re-escalate if crude transport is disrupted again.
The reason equities have not collapsed more aggressively despite this backdrop is largely earnings resilience. Consensus forward earnings estimates for 2026 and 2027 remain elevated, and that has so far prevented a more violent de-rating in the major indices. In other words, the market is still giving corporate earnings the benefit of the doubt even while macro risk rises.
That creates a very unusual environment: geopolitics are deteriorating, oil remains elevated, but equities are still only modestly below highs because earnings expectations have not yet materially adjusted lower. That disconnect is important because if energy prices stay elevated for longer, margin pressure across multiple sectors becomes much harder to ignore.
This week now becomes especially important because central banks enter focus at exactly the same time as geopolitical stress remains elevated. The Federal Reserve, European Central Bank, Bank of Japan, and Bank of England all face policy decisions this week, and they are doing so while inflation remains sticky and oil is threatening to become inflationary again.
U.S. inflation data has already reinforced that challenge. Core PCE remains firm, personal spending is still resilient, and labour market data continues to show demand that is slowing only gradually rather than sharply. That means central banks have less flexibility than markets would prefer if oil begins feeding directly back into inflation expectations.
At the same time, the AI complex remains an important counterweight for sentiment this week. Nvidia’s GTC conference begins today, and markets are watching closely because any major AI-related announcements from Jensen Huang could become one of the few strong positive catalysts capable of offsetting part of the macro caution currently dominating broader positioning.
Premarket price action already reflects that selective optimism. Nvidia is trading higher ahead of the conference, Meta is rebounding after reports of large workforce reductions tied to AI spending discipline, and crypto-linked equities are also stronger alongside digital assets.
Internationally, China continues to offer one of the more stable macro signals. Retail sales and industrial output both came in stronger than expected, with industrial production especially continuing to surprise positively. That reinforces the idea that external demand into Asia remains firmer than many expected, particularly from Europe and Southeast Asia.
Nasdaq
QQQ VRVP Daily & Weekly Chart
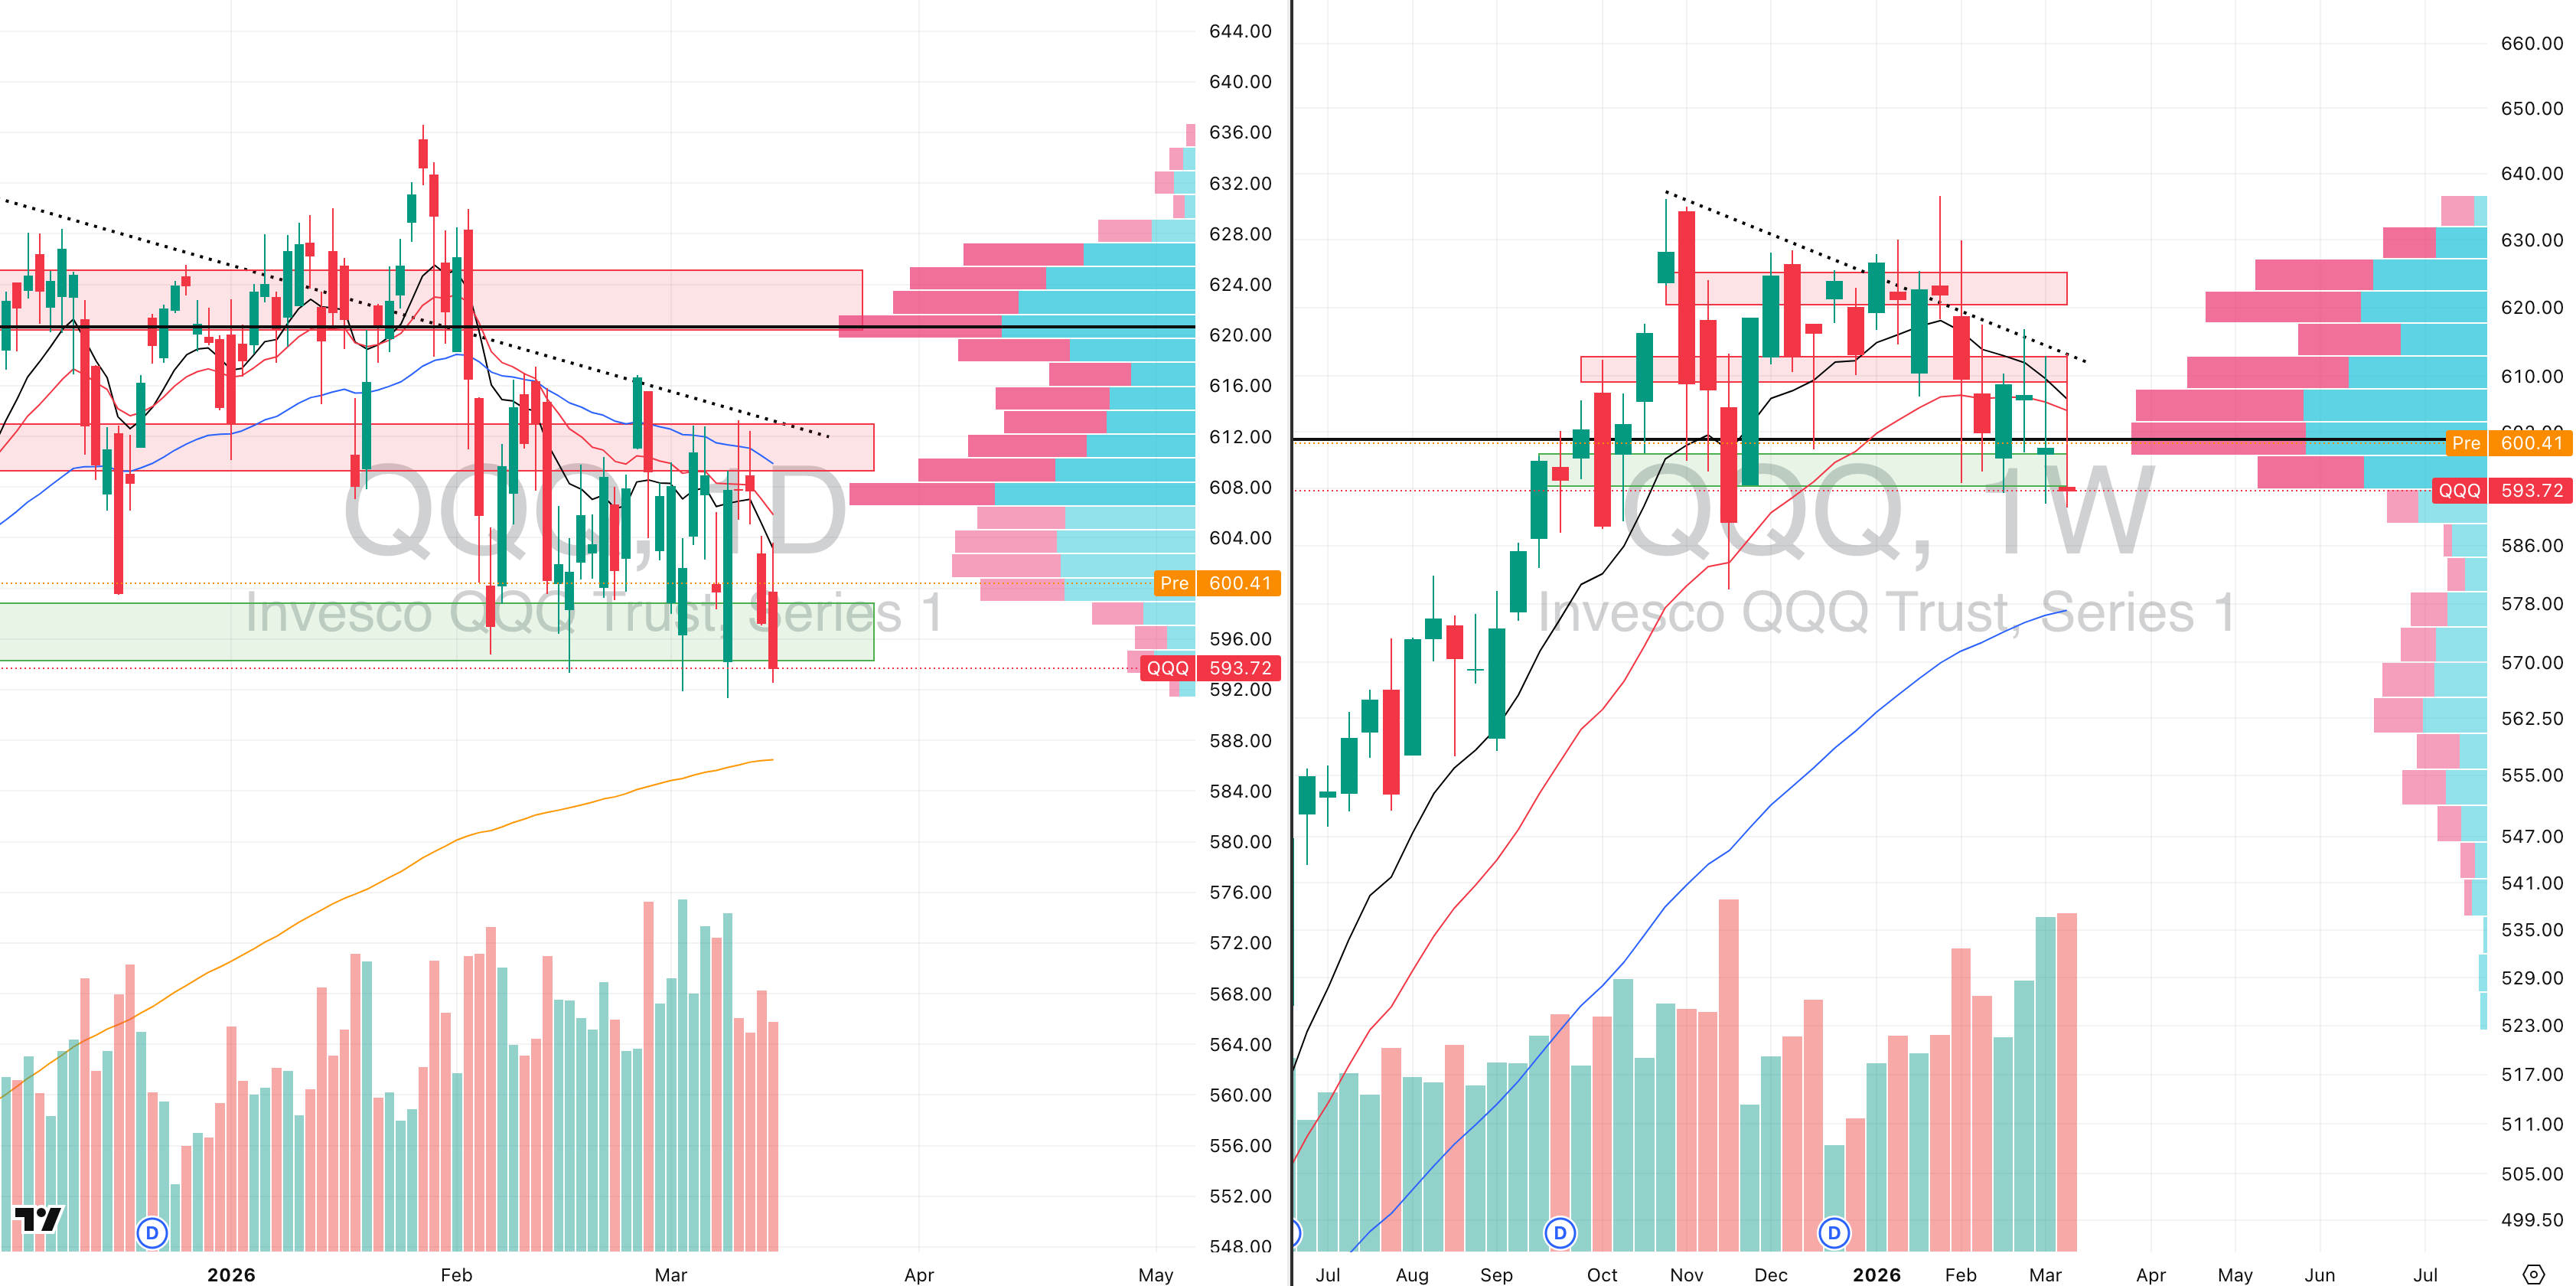
25.74%: over 20 EMA | 28.71%: over 50 EMA | 43.56%: over 200 EMA
The Nasdaq continues to show increasingly fragile behaviour on the weekly structure. Last week produced another sharp rejection from the same declining resistance line that has capped every major upside attempt since the October 27 peak, which now means price has spent 133 days trapped in a broad sideways range without being able to reclaim trend control.
What makes last week materially more concerning is the quality of the sell-off rather than simply the direction. The weekly candle printed 161% relative volume, which is the highest participation seen during this entire corrective phase, while the total weekly range expanded to just under 4%.
That is significant because the QQQ already carries an elevated weekly average range near 3.3%, so last week was not simply volatile — it was materially more aggressive than normal even by recent Nasdaq standards.
Although futures are attempting a bounce this morning and price is still technically sitting on the same demand band that has repeatedly held since September 2025, especially across the February base-building period, the size of last week’s rejection means that demand has not yet earned trust.
The market is bouncing from support, but it is doing so immediately after the heaviest weekly selling pressure seen in months.
The reason caution remains high is that selling at the highs has become increasingly dense every time price approaches that declining resistance structure. That repeated inability to reclaim supply means this remains a market in repair, not a market back in trend.
From here, the most likely path still appears lower before any sustainable recovery can develop. The first downside objective remains the rising 200-day EMA near 586, which implies roughly another 2.4% downside from current levels.
If that level fails to hold, the next major support sits lower near 577, where the rising 50-week moving average becomes the next weekly trend reference.
S&P 400 Midcap
MDY VRVP Daily & Weekly Chart
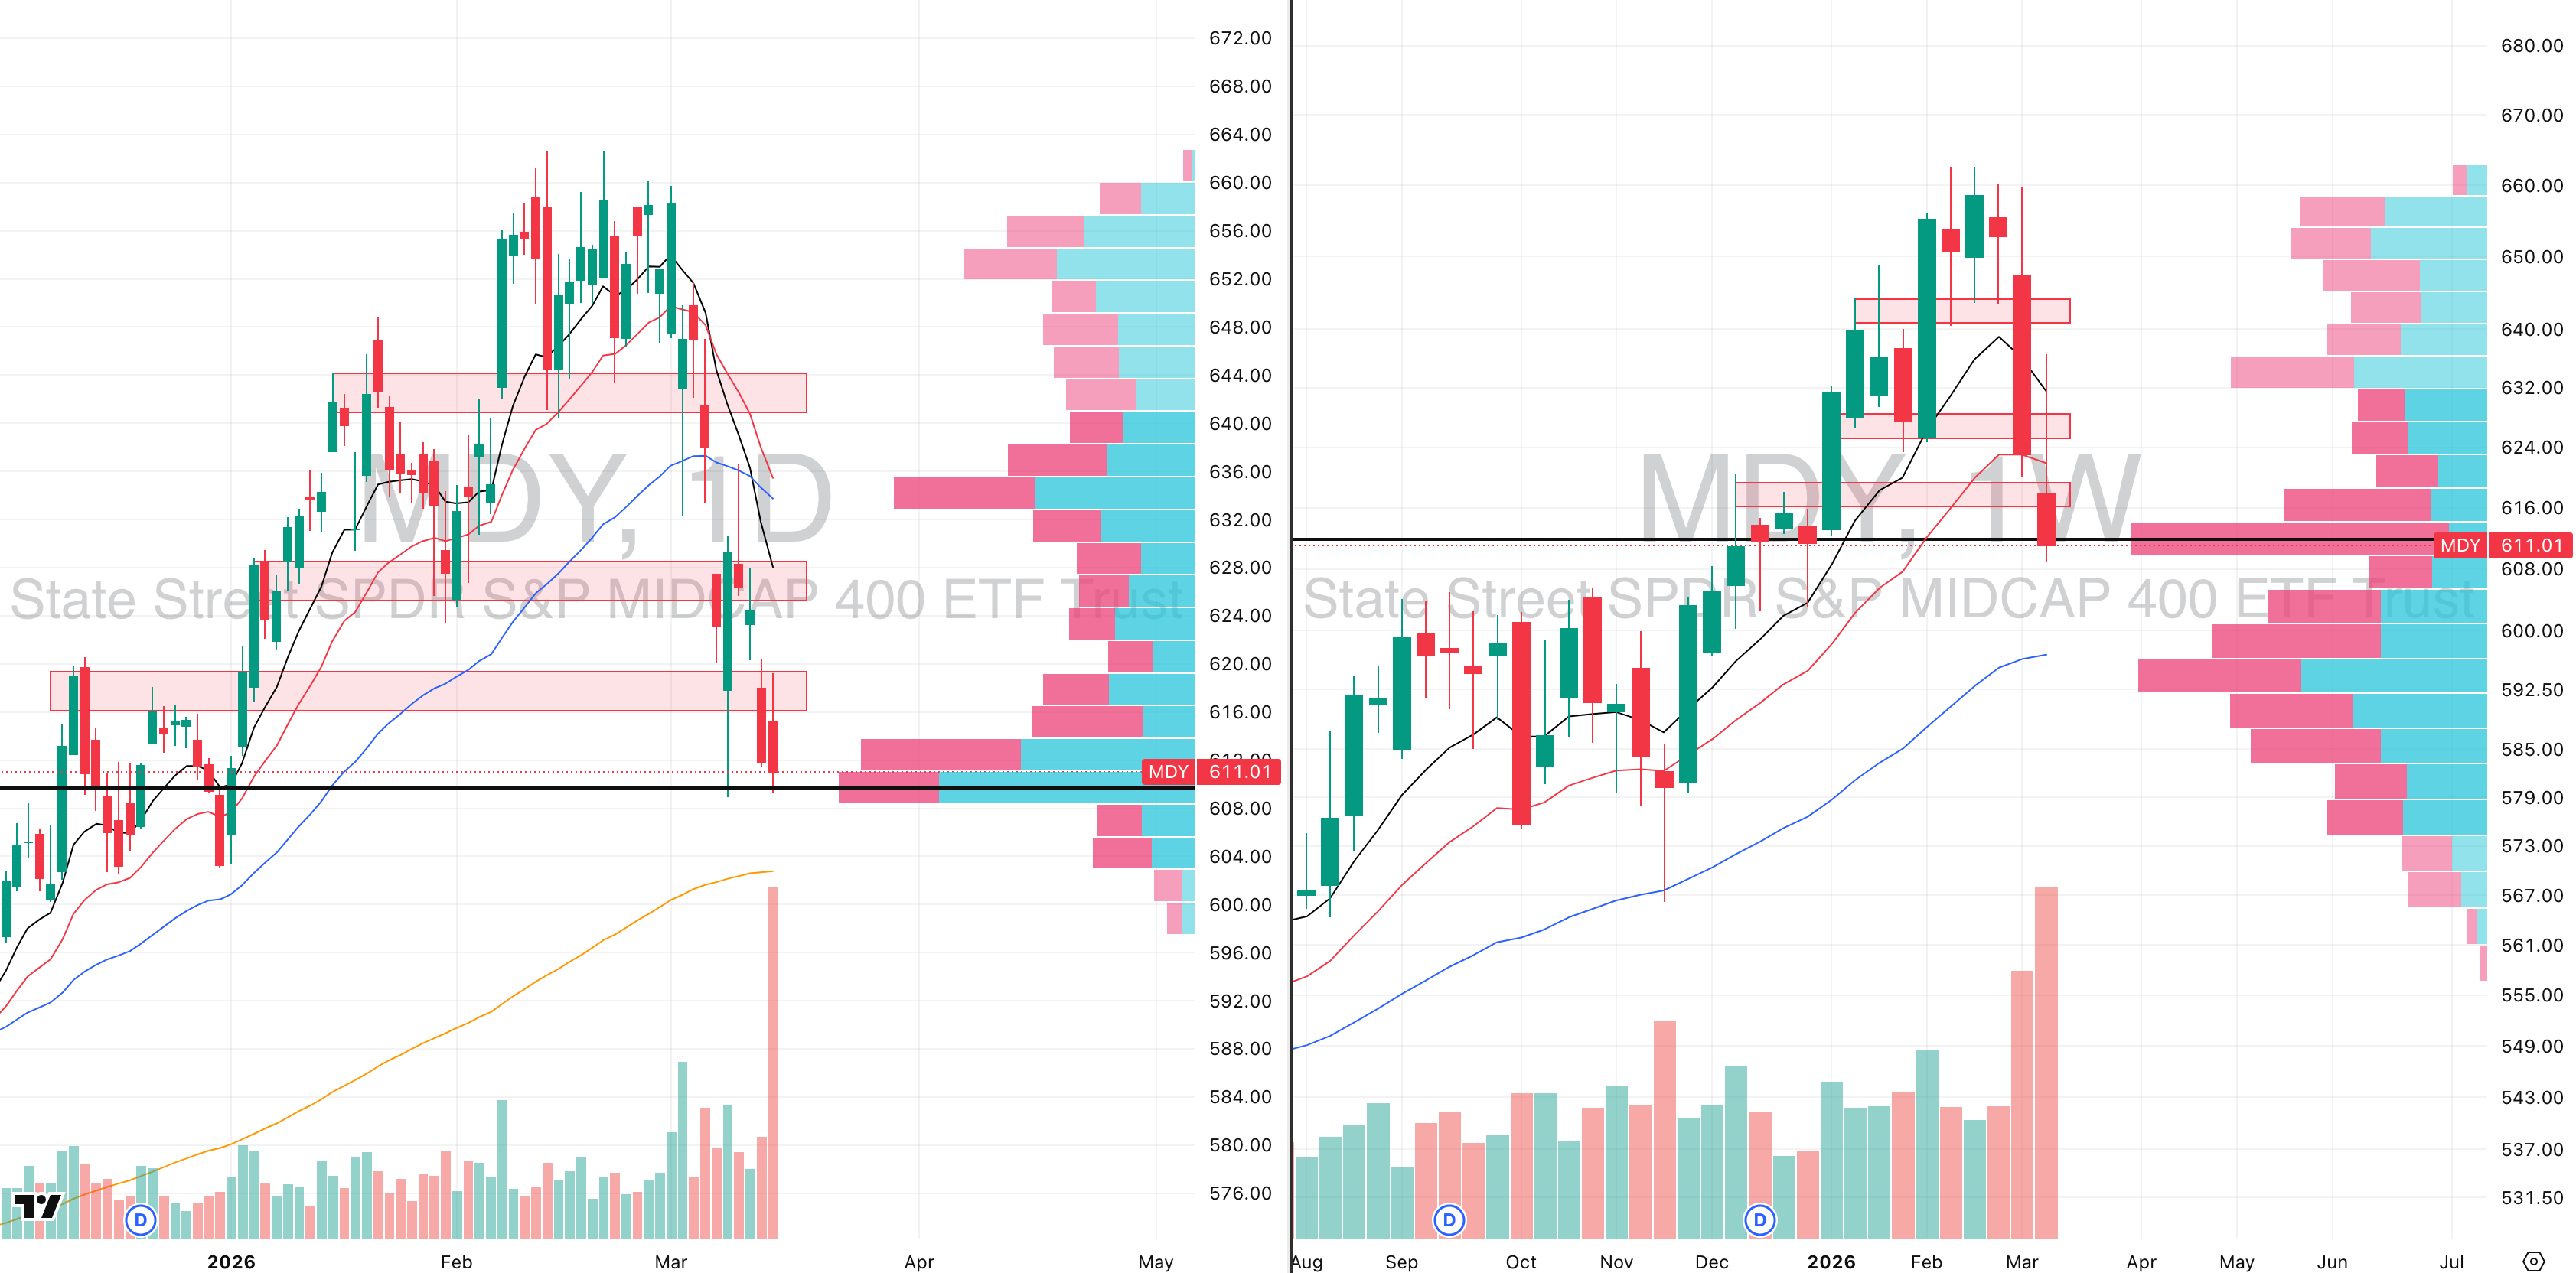
17.00%: over 20 EMA | 25.50%: over 50 EMA | 45.00%: over 200 EMA
Mid-caps have now moved from being the strongest capitalisation group in the U.S. market to the area showing some of the clearest evidence of institutional unwinding.
Breadth has collapsed aggressively. Only 17% of stocks inside the MDY now remain above their 20-day EMA, which is an extremely depressed reading and one that historically often coincides with short-term mean reversion conditions. In simple terms, the group is now deeply oversold on a short-term breadth basis.
Price is also sitting directly around the point of control on both the daily and weekly structure, which is why some bounce behaviour is beginning to appear this morning.
However, the major difference here is that the oversold condition is occurring alongside extraordinary selling participation. Friday printed 465% relative volume on the daily chart, which is one of the most extreme daily volume spikes the ETF has seen in years.
On the weekly timeframe, volume expanded to roughly 250% relative volume, which is exceptional by historical standards.
That type of participation is not ordinary rotation. It reflects major position unwinding inside what had previously been the leading area of the U.S. equity market.
Structurally, MDY is now in confirmed Stage 4 decline, and the last two weeks of rising relative volume strongly suggest that this is not behaving like a typical bear trap. Selling pressure is accelerating rather than exhausting.
The next likely downside target remains the rising 200-day EMA near 604, which implies another 1.2% downside from current levels. That level becomes the first place where a more meaningful technical response could emerge.
Russell 2000
IWM VRVP Daily & Weekly Chart
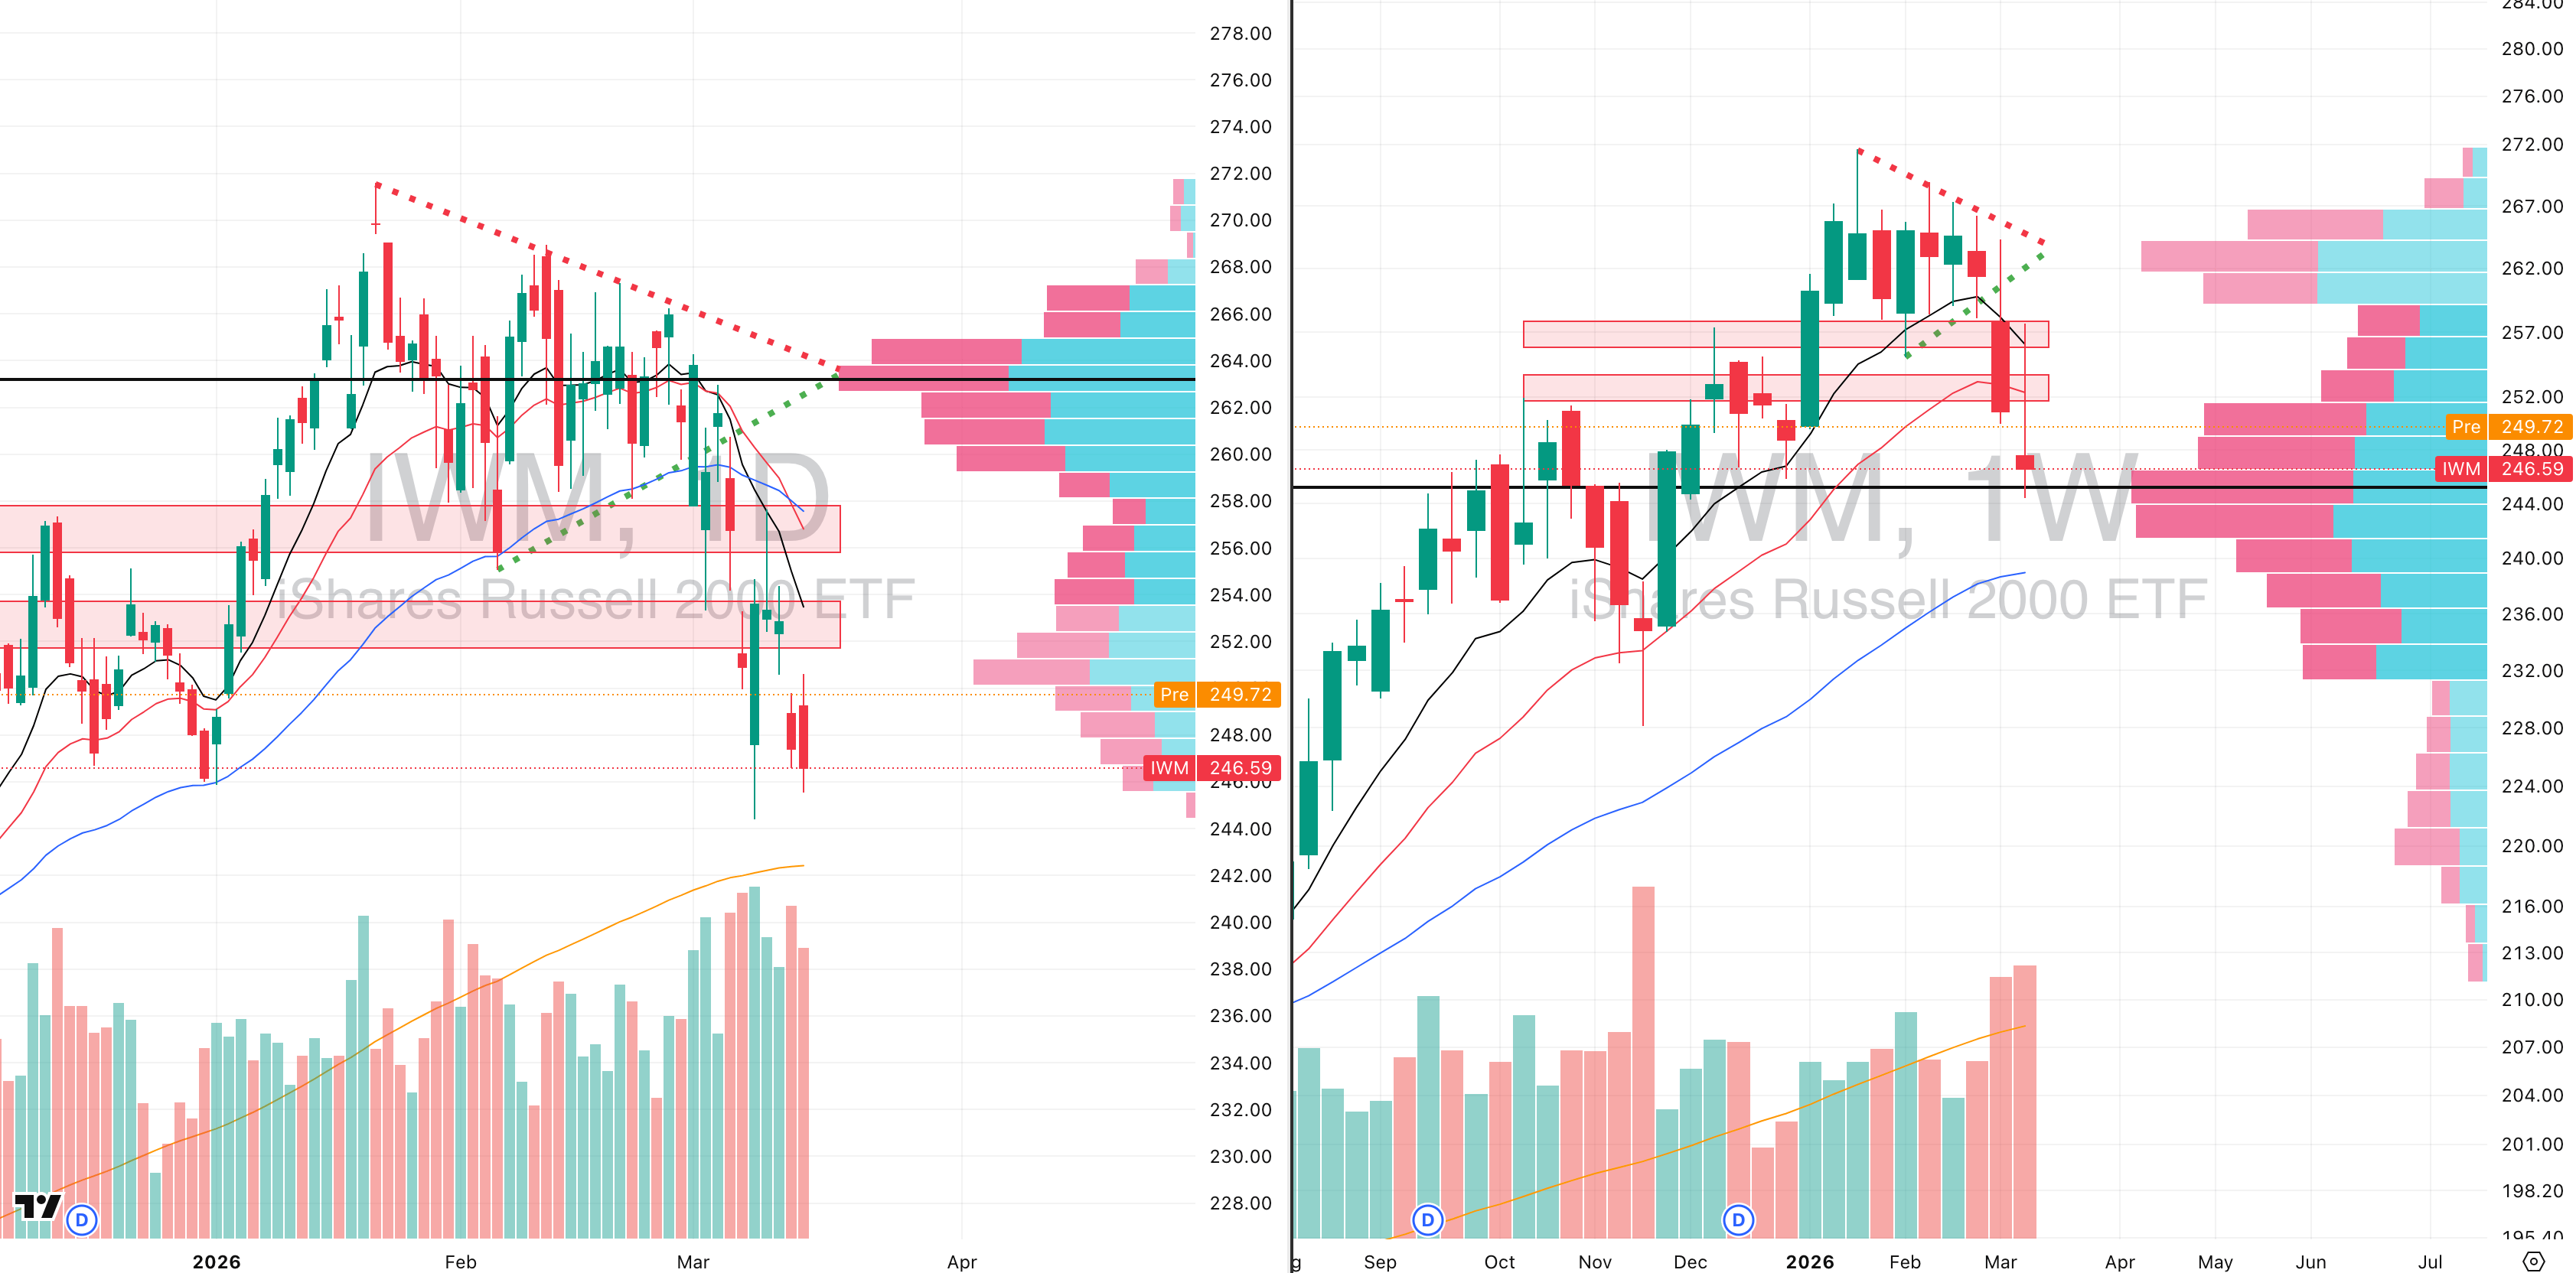
21.28%: over 20 EMA | 26.55%: over 50 EMA | 47.20%: over 200 EMA
Small caps are showing a similar deterioration to mid-caps, although the quality of the selling remains less aggressive, largely because the group never displayed the same degree of prior strength that mid-caps had built over recent months.
Last week produced two very large weekly candles, with the most recent weekly bar printing 154% relative volume and a total weekly range of 5.2%. That is roughly 1.3 times greater than the average twenty-week range, which confirms that volatility inside small caps has also expanded materially.
The difference versus MDY is that relative selling pressure has been less extreme, which keeps the IWM slightly more orderly by comparison even though the structure remains weak.
Price is currently sitting on a visible demand level near 247, which was an important support area during the October through December 2025 base and where buyers have once again attempted to stabilize price.
Even so, the broader expectation remains that small caps are likely to continue probing lower before a stronger base can form.
The most likely next test remains the rising 200-day EMA near 242.50, which implies another 2.5% downside from current levels. That level carries more importance because it also represents the first major trend support beneath the current range.
In practical terms, the IWM is behaving like a weaker version of the same broad equity stress now visible across growth-sensitive segments: some support is present, but trend control has clearly weakened.
FOCUSED STOCK
IREN: Crypto Stocks Beginning To Bounce
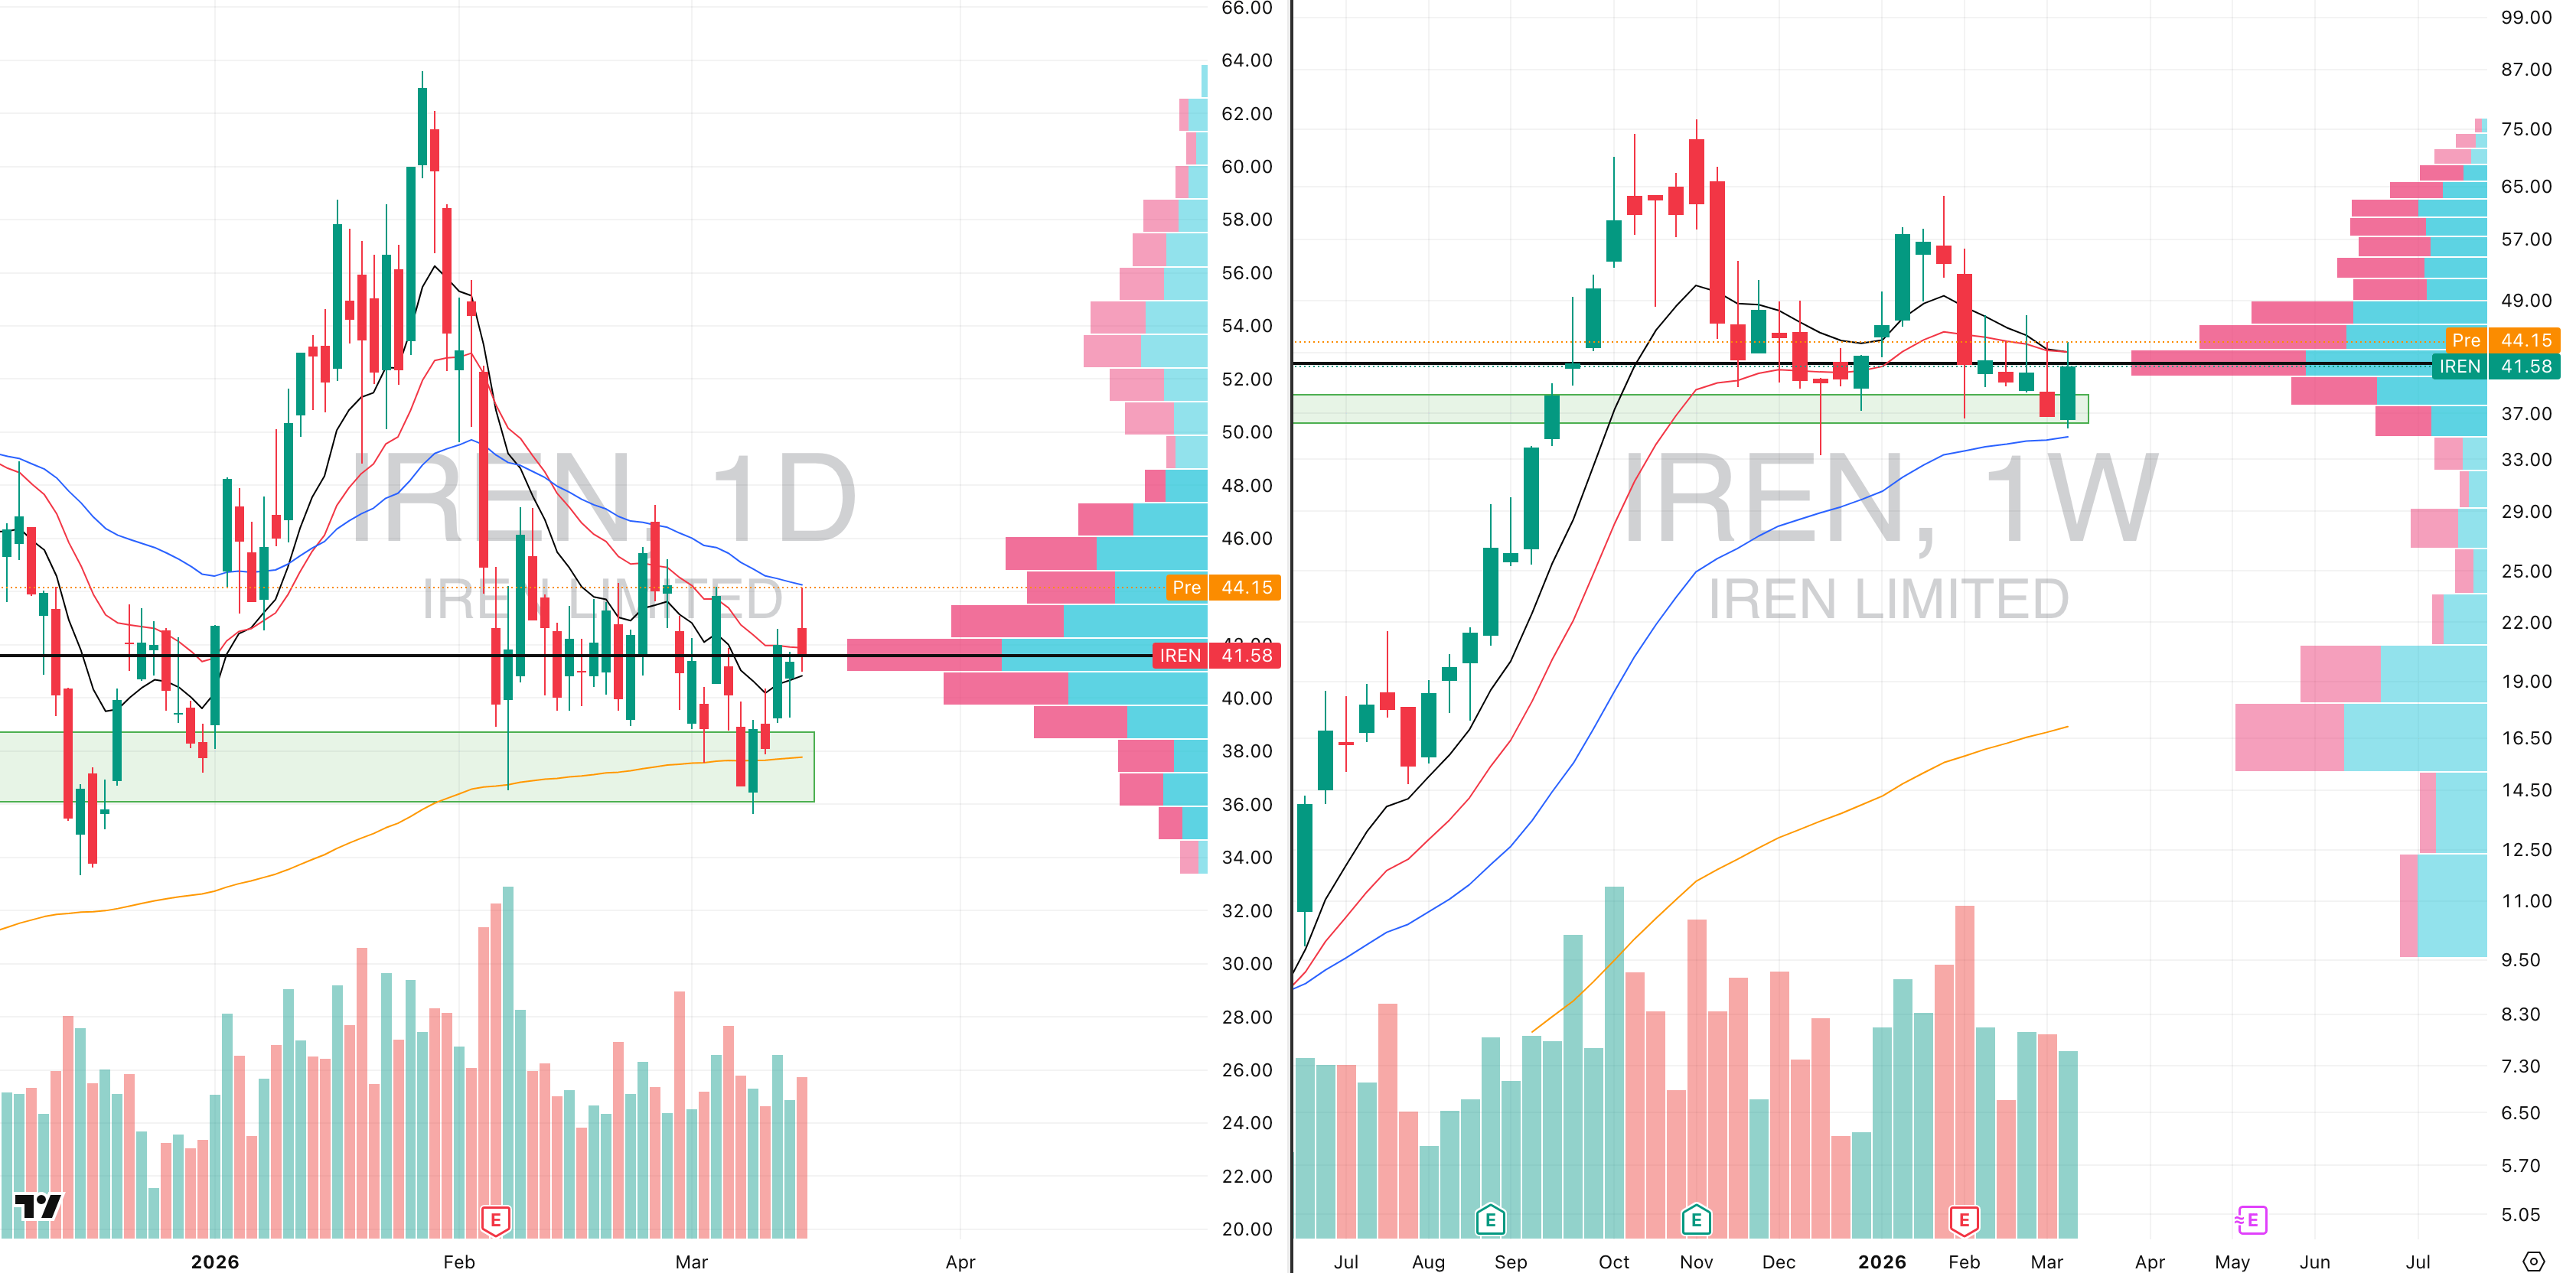
IREN VRVP Daily & Weekly Chart
ADR%: 8.59% | Off 52-week high: -45.9% | Above 52-week low: +711.3%
Am

Did you find value in today's publication?This helps us better design our content for our readers |
Reply