- Swingly
- Posts
- 🚨 Sellers May Have Taken The Wheel
🚨 Sellers May Have Taken The Wheel

OVERVIEW
Leadership Hit, But Not Broken
🟥 Risk-Off: Breadth cracked across small and midcaps. Leadership softened. VIX reclaimed short-term trend. High-volume rejections are replacing clean breakouts
📊 Broad Market Structure: Momentum has stalled. Low-volume zones are being filled on the downside. Demand failed to defend prior support zones.
⚠️ Risk Rotation Underway: Defensive assets like gold and miners are attracting bid. Growth names are pulling back despite no new macro shocks, this is character shift, not news reaction.
🧠 Step Back, Don’t Chase: This is how digestion phases begin. Don’t force new exposure. Protect open gains, observe how price responds at the 20EMAs, and wait for clean setups to reappear.

MARKET ANALYSIS
Pressure Beneath the Surface

Markets are in absorption mode, digesting a wave of earnings and inflation data against the backdrop of renewed trade policy friction.
While PPI came in soft (0.0% MoM, 2.3% YoY), easing some inflation concerns, the CPI print earlier this week surprised to the upside, pushing rate cut expectations further out. The Fed now looks increasingly likely to hold steady through September, despite political pressure to ease.
Meanwhile, fresh tariff headlines-including potential levies on drugs and semiconductors by August 1- are keeping macro risk premium elevated, particularly around globally exposed sectors.
What matters most today isn’t the macro noise, it’s the technicals. So let’s get straight into the charts.
Nasdaq
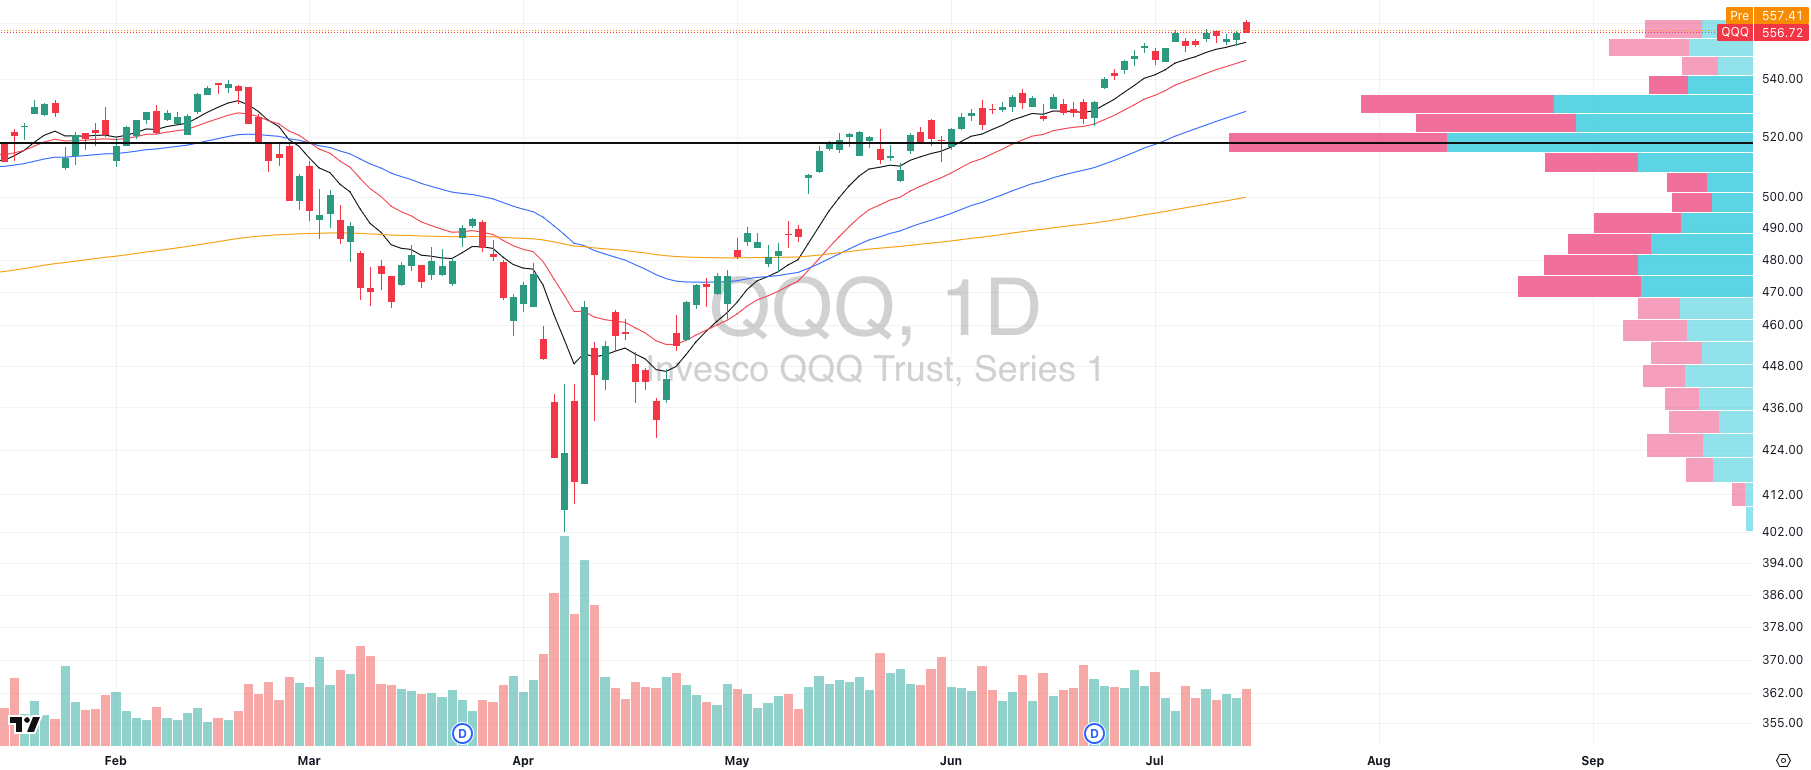
QQQ VRVP Daily Chart
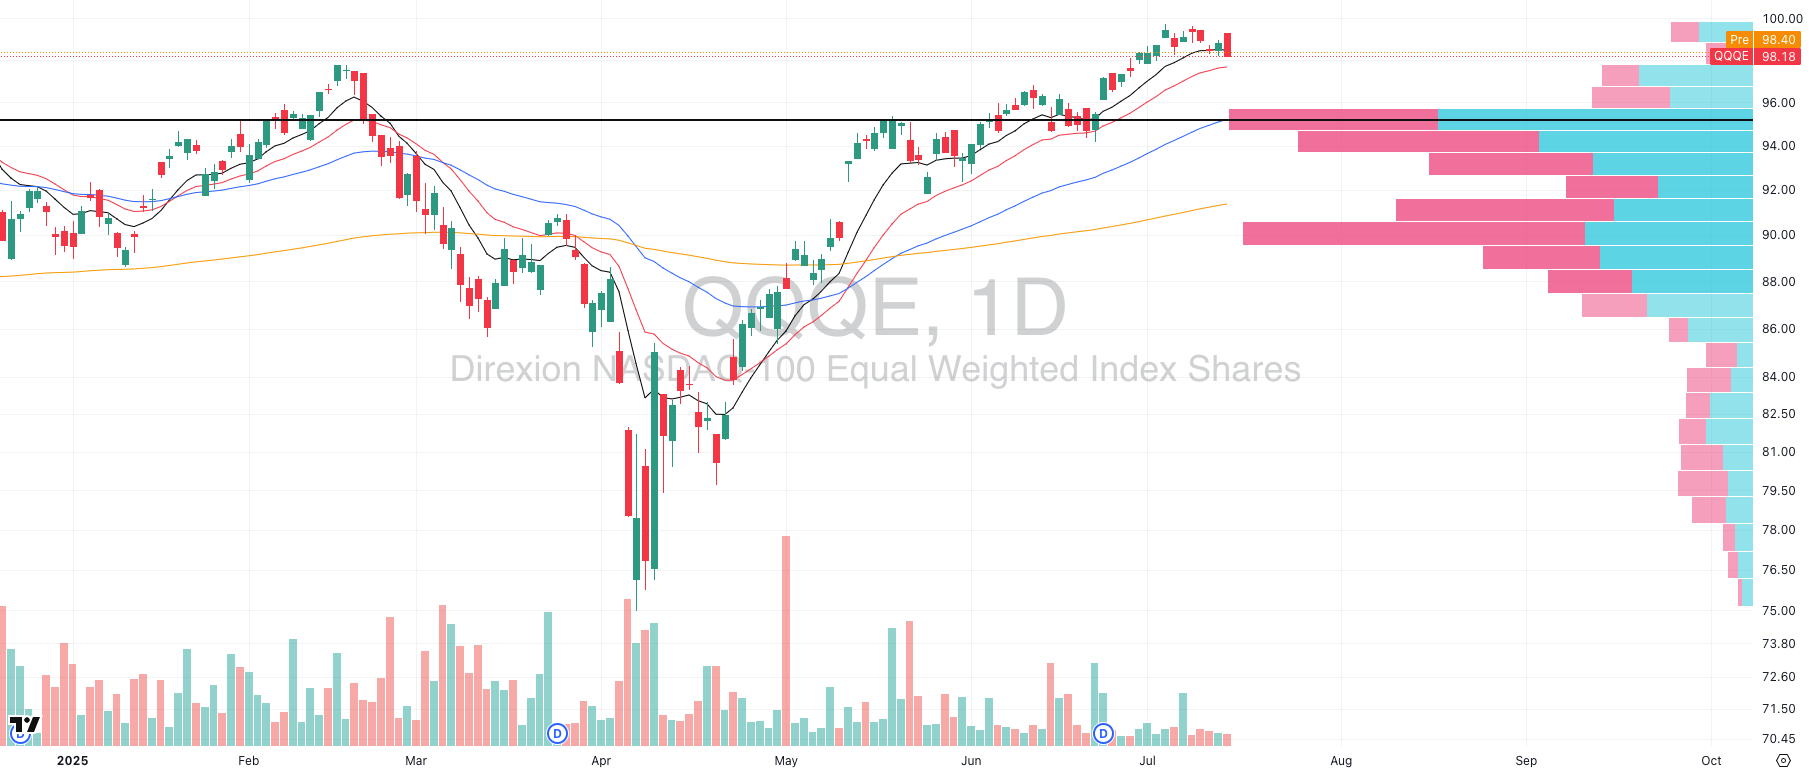
QQQE VRVP Daily Chart
Yesterday brought a notable pullback across tech, with both QQQ and QQQE reversing from recent highs. What’s important is the composition of that weakness:
QQQE (equal-weight Nasdaq 100) underperformed, confirming that mega-cap names are still holding up better than the average stock.
NVDA alone propped up part of the index intraday, a reminder that leadership is still intact, even amid broad selling.
Relative volume spiked in QQQ, showing this wasn’t a passive drift, it was a meaningful test of demand.
🔍 What We’re Seeing:
The fact that megacaps outperformed during weakness signals that risk isn’t fully off.
Pullbacks are healthy inside trend, what matters is how leaders react at their EMAs, not that they pull back.
Our open positions in top names held structure, and that’s what counts.
We’re risk-off for new longs today because this is where the market decides whether to tighten or slip. Watching the close > open relationship, leadership EMAs, and breadth response.
Until trend breaks, we’re respecting strength, but not willing to press into uncertainty.
S&P 400 Midcap
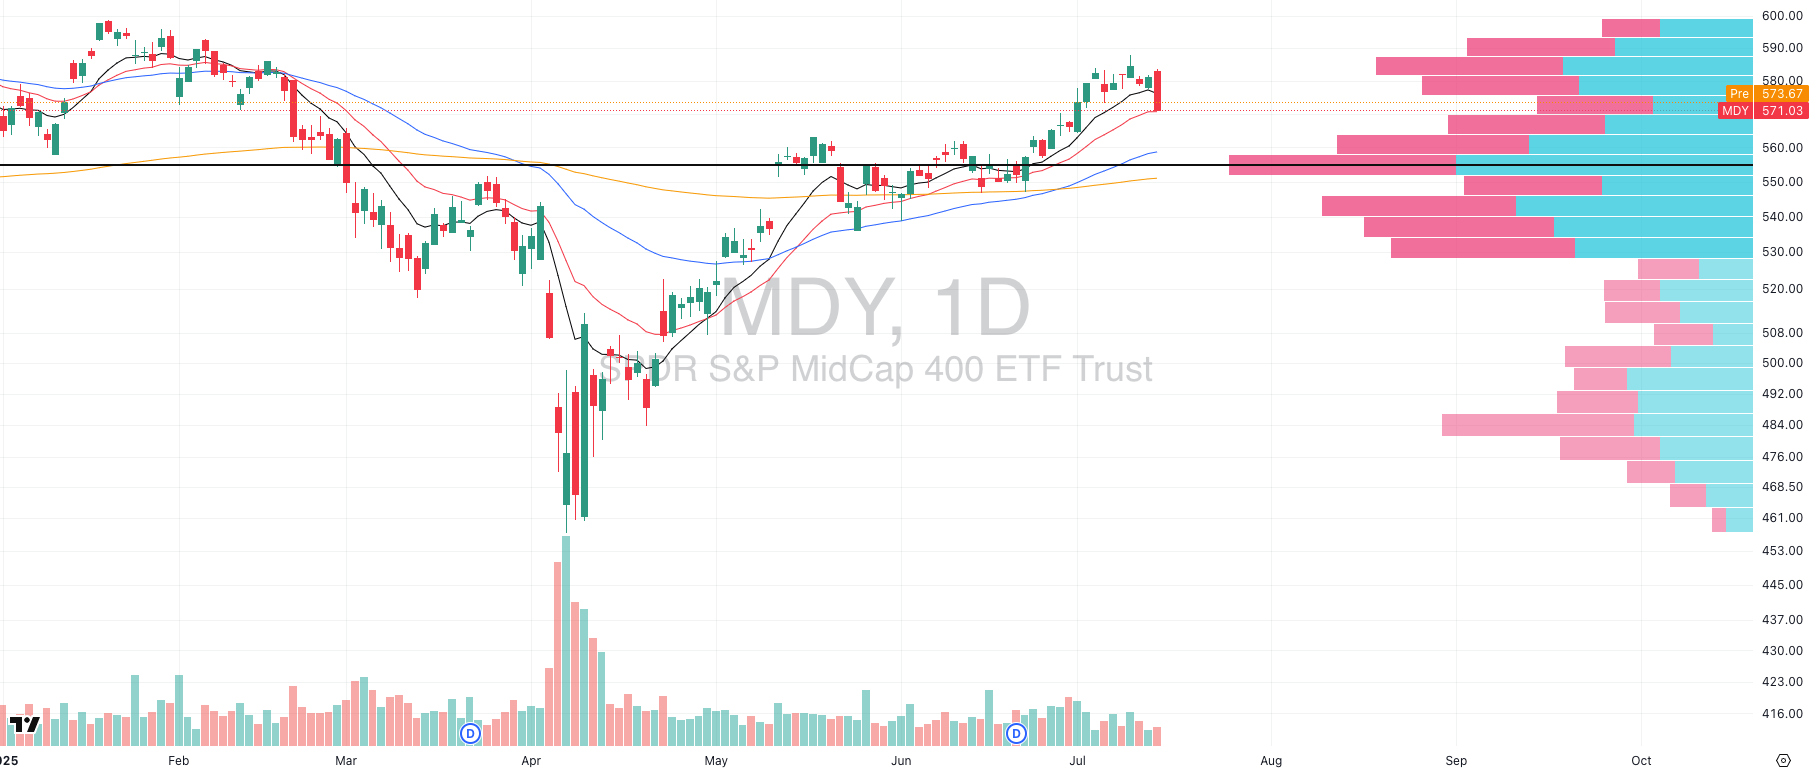
MDY VRVP Daily Chart
Midcaps pulled back yesterday, but the volume didn’t confirm the move. MDY printed a red session, yes but it did so on very low relative volume, which historically tends to invalidate breakdowns rather than confirm them.
As we always say:
Price shows direction. Volume confirms intention.
This isn’t a high-conviction rejection so far it was more likely a pause, possibly even a bear trap.
🔍 Key Structural Notes:
No high-volume breakdown = no confirmation of trend change.
The VRVP shows a low-volume zone down toward ~$560. If we drift lower, this zone could accelerate price, but only if volume increases.
So far, this is a low-energy pullback within a still-intact uptrend.
Remember!
We don’t overreact to red candles. We watch how the market pulls back, and right now, MDY is pulling back without real selling pressure.
If this were a true character break, we’d see high relative volume on the move down just like we did yesterday in small caps, and large cap equal weight segments.
Russell 2000
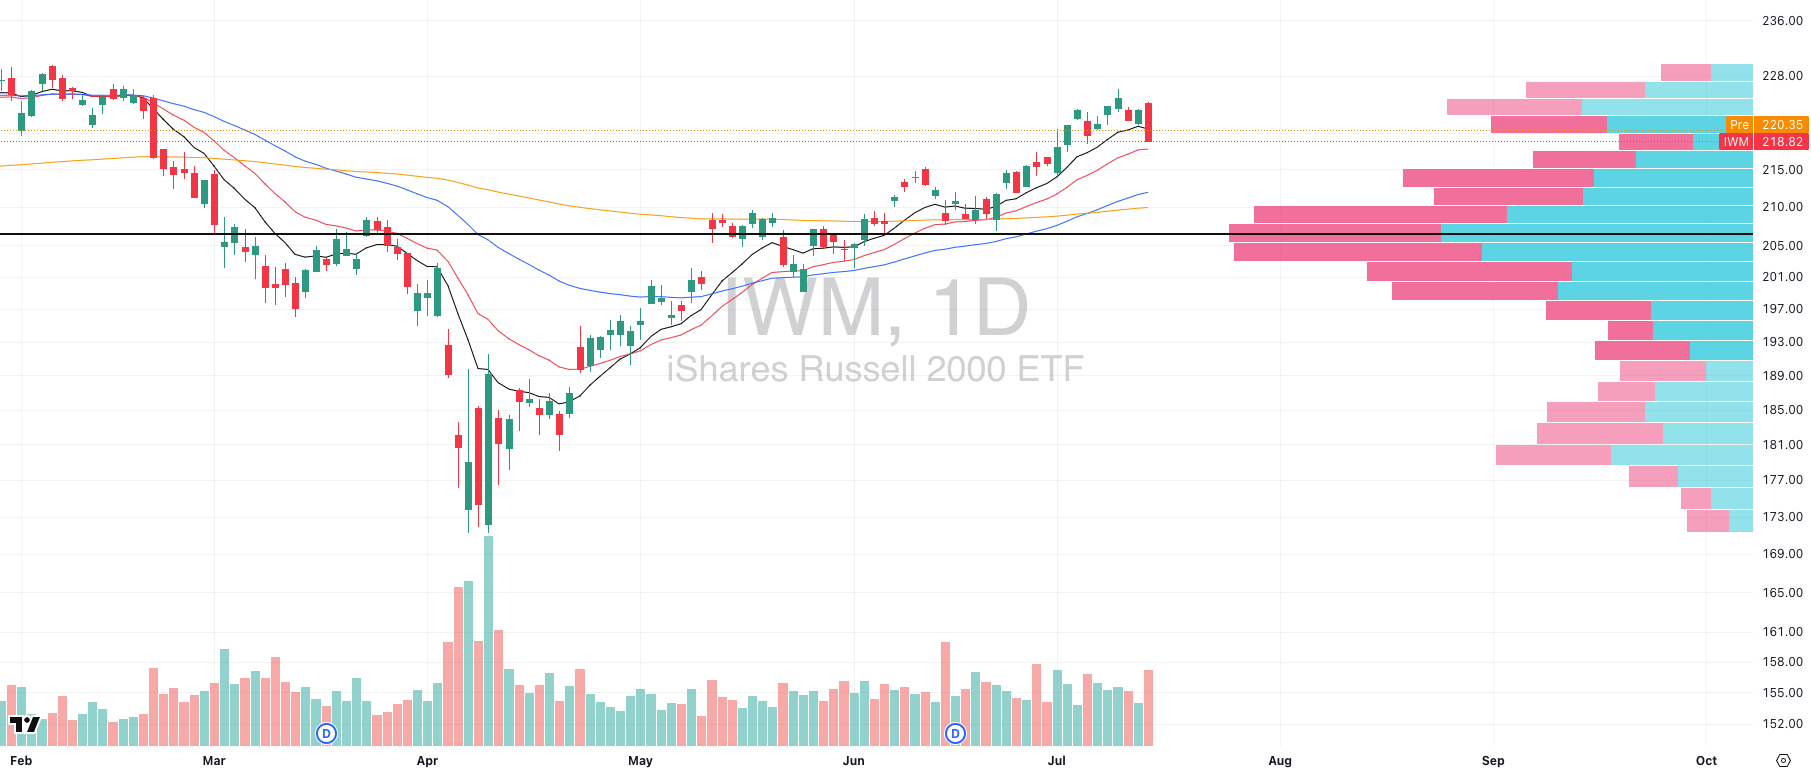
IWM VRVP Daily Chart
Small caps led to the downside yesterday, with IWM printing a decisive breakdown below its rising 10EMA on the highest relative volume in several weeks.
This wasn’t a slow fade as it was an accelerated flush into a thin liquidity zone, confirming the short-term exhaustion we’ve been flagging.
This move coincided with IWM climbing into dense overhead supply earlier this week which was a level we’ve repeatedly noted as vulnerable to rejection.
🔍 Key Technical Notes:
The move down was fast and heavy because the VRVP shows a low-volume pocket between the 10EMA and ~$215. Once 10EMA broke, there was nothing structurally to slow the drop until we approached that next major node.
$215 stands out as a high-volume shelf and prior control zone, aligning closely with the rising 20EMA, both likely to act as the next test area for demand.
The volume spike yesterday adds signal as it wasn’t passive weakness. It was a tactical unwind, and that typically means stepping back and reassessing, not forcing exposure.
🧠 Strategic Framing:
This isn’t about whether the Russell is “bearish.” It’s about recognizing when trend and structure are weakening, and adapting risk accordingly.
We’ve seen a healthy leg higher from mid-June, but this is now the first structural break since that rally began. The question now becomes:
Does the 20EMA + $215 shelf act as demand… or does it crack and open up a deeper retrace?
🧠 Mindset Check: Your Entire Job Is To Analyse Character
Price is data. Character is information.
You are not in the prediction business, you're in the pattern recognition business.
Character is the single most important concept in swing trading, and yet the least systematized.
Most traders obsess over entries, chart patterns, or catalysts. Professionals study how markets respond to stress. That’s character and it’s the diagnostic key to timing, sizing, and survival.
Example: This Week’s Behavioral Shift
In this morning’s Swingly PRO report, we walked through several clear divergences between narrative and behavior, the kind of misalignments that matter far more than any individual candle or headline.
Despite bullish catalysts (notably in semiconductors and AI-linked flows), the market delivered a decisive rejection at key inflection points:
SPY printed a high-volume fade off resistance, a stark shift from the clean trend continuation seen in prior weeks.
RSP breached its short-term demand shelf, breaking below the 10EMA and entering a low-volume zone, exposing structural vulnerability beneath.
VIX didn’t spike but it held trend for the first time in weeks, quietly reclaiming the 10EMA. A subtle but important signal of shifting volatility dynamics.
Gold reclaimed its Point of Control and sat atop the 50EMA, but caught no defensive bid during equity weakness, a sign that capital wasn’t actively repositioning into safety.
Bitcoin (BTCUSD) absorbed monster volume, shook out weak hands, and defended trend, a show of demand resilience rarely appreciated in real time.
This isn’t about being “bullish” or “bearish.”
This is about the market failing to respond in the way it should, given the backdrop.
That’s the essence of character analysis, and it’s often the earliest signal that something deeper is shifting.
The Professional Lens
Remember, as a trader you are analyzing response behavior at key stress points, not charts.
Your edge lies in identifying when the market begins failing at expectations:
A failed breakout on good news = degradation.
A bounce with no volume = lack of conviction.
A leader violating the 10EMA but reclaiming = strength-in-weakness.
A flush into support met with absorption = demand reasserting.
These are psychological disclosures about where risk is being repriced in real-time.
Practical Application
Every day, your journal should answer one question:
What character traits shifted today? What stayed the same?
This creates a feedback loop rooted not in prediction, but in calibration.
That’s the difference between a discretionary trader and a probabilistic operator.
ADVERTISEMENT - Monument Trader’s Alliance
Google’s Breakthrough Just Unlocked a New Class of AI Trades🧠

In a Google-owned lab in California, scientists just solved a problem that would’ve taken regular computers 10 septillion years — in just 5 minutes.
This breakthrough has opened the floodgates to a new wave of explosive AI trades, with moves like:
📈 713% in 14 days
📈 1,047% in 2 days
📈 2,105% in 8 days
Now, a Georgia trader who turned $37K into $2.7M using a strategy called “The Squeeze” is revealing how to target trades like these — for free.
FOCUSED STOCK
RGTI: Coiled Quantum Momentum
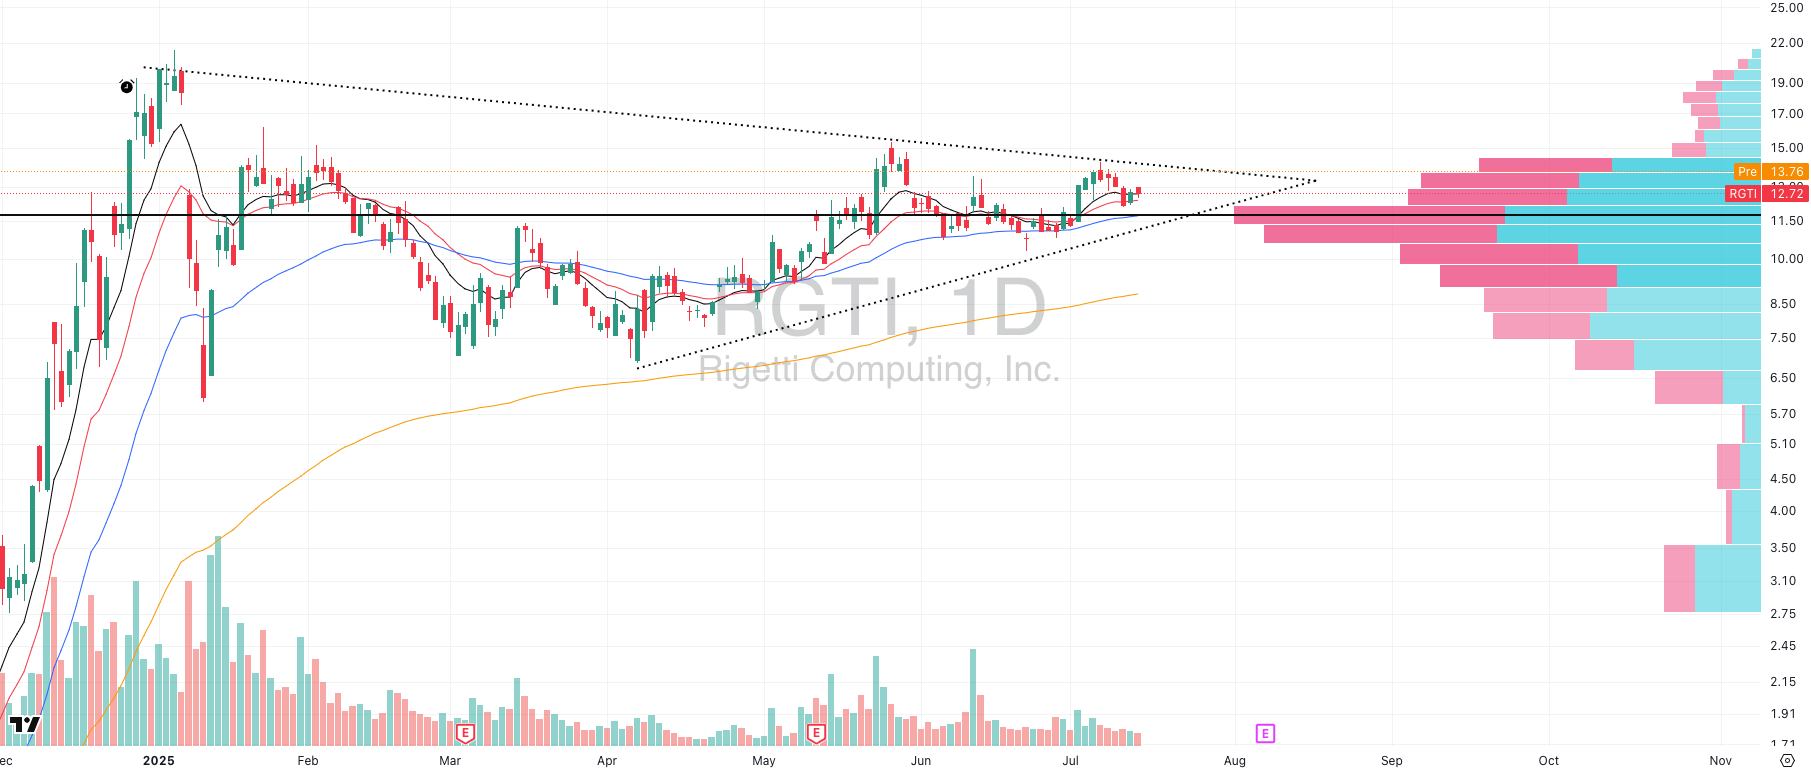
Breakout structure + real fundamental driver = high-risk, high-reward scenario
Rigetti just announced a 99.5% median two-qubit gate fidelity on its 36-qubit modular system, halving its error rate vs. Ankaa-3. This marks a major leap in quantum processing quality and sets the stage for a 100+ qubit system launch by August 15.
From a narrative standpoint, it's the kind of progress that institutional capital in deep-tech hunts for. But we’re traders. And the chart matters most.
📈 Technical Setup
RGTI broke above its Point of Control (POC) in late June but pulled back into the breakout zone, forming a compressed, bullish contraction especially clean on the weekly chart.
The Visible Range Volume Profile (VRVP) shows heavy overhanging supply up to ~$14.50. That’s the zone that must clear for any real momentum continuation.
Price is currently trading inside that resistance band, any high-volume expansion through this shelf would shift it from contraction → expansion phase.
This is a classic "tighten → test → absorb → go" setup.
⚠️ Context Matters
RGTI is a speculative, high-beta growth name, squarely within the risk-on tech basket. For this to work, broad market appetite for innovation and growth must stay intact.
If liquidity begins to rotate out of risk, setups like this get much harder.
FOCUSED GROUP
GDX: Miners Coil as Equities Wobble
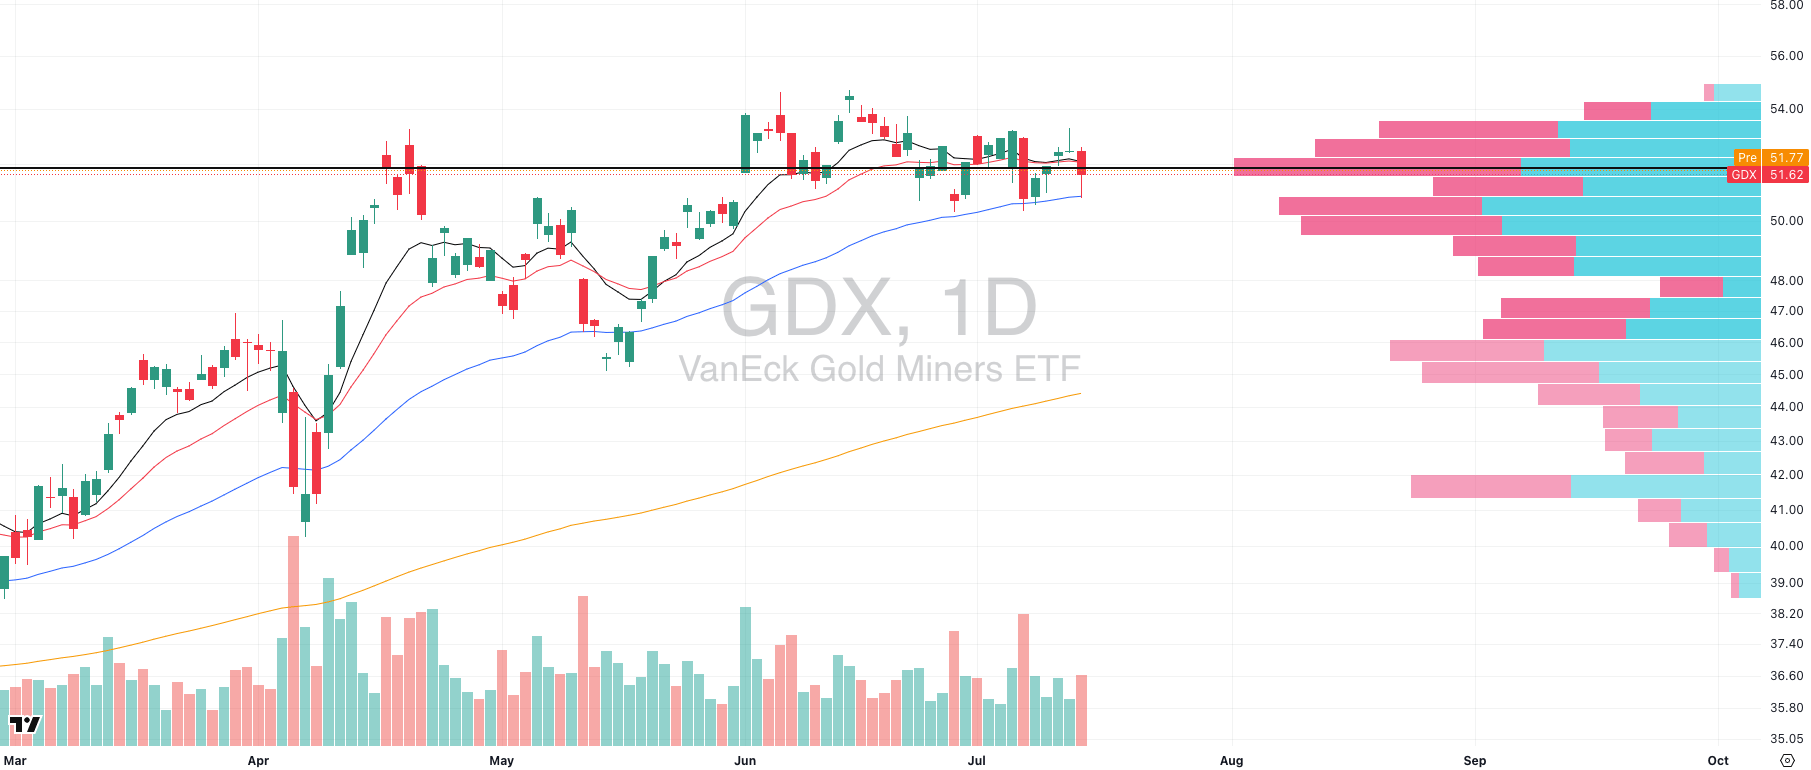
GDX VRVP Daily Chart
Almost every major sector pulled back yesterday, but one group quietly stood out: Gold Miners (GDX).
GDX printed a high relative volume bounce off its rising 50-day EMA, a level that has consistently attracted demand in recent months. If you look back, each time GDX has tested this moving average, it's responded with measured continuation to the upside.
Now, zoom out: since late May, GDX has been building a tight contraction pattern, sitting just beneath a multi-month breakout zone. This is happening as equities begin to show early signs of stress, and that matters.
Why? Because Gold and equities often move inversely in high-correlation regimes. If SPY or RSP rolls over, GDX may become one of the few actionable longs as a defensive rotation play.
🔍 What to Watch:
GDX holding above the 50EMA = bullish structure intact
Break above the May–July coil = momentum trigger
Confirmation comes if equities extend lower and VIX trends higher
This is not a breakout yet, but it's a low-correlation pocket of strength, coiled with volume, in a market that may be entering digestion. Keep it on radar.

Q&A
Got a trading question? Hit reply and ask!
Q: “Why dont you guys also day trade or look at futures/options?”
Great question. The short answer?
Because we K.I.S.S….Keep It Simple, Stupid.
The longer answer is this:
We believe mastery comes from narrowing the aperture, not widening it. Most traders burn out because they’re chasing edge in 10 places at once: stocks, options, futures, crypto, day trades, swings… all while checking Twitter every 12 minutes. That’s not trading, that’s just stimulus addiction.
Our system is built on high-conviction, repeatable execution of a small number of proven setups, within a well-defined timeframe, in liquid U.S. equities. No noise. No overcomplication. Just signal and structure.
The entire Swingly philosophy is built around one core idea:
Simplicity scales. Complexity breaks.
📊 The Data Backs It:
According to a 2020 study by Tradervue, traders who focused on just one or two setups outperformed those who rotated styles:
✅ 35% higher average win rates
✅ 43% better risk/reward profiles
✅ Nearly 2x higher expectancy per trade
In short:
Less variability = more consistency.
Fewer decisions = fewer errors.
More reps = deeper mastery.
Swing trading in one asset class gives you the conditions to develop true edge, habit-based execution, and emotional durability, the actual ingredients of long-term success.
We don’t trade everything.
We just trade what works, over and over again, for years on end.
Want the setups, trade logic, and execution playbook,all in real time?
That’s all inside Swingly Pro → see what’s included
Reply