- Swingly
- Posts
- Selectivity Matters More Than Ever Right Now
Selectivity Matters More Than Ever Right Now
In partnership with

OVERVIEW
A Very Mixed Bag
Macro: Government shutdown risk adds uncertainty into an already delicate backdrop (Fed policy, sticky inflation, stretched valuations). Strong Q3, but near-term digestion likely.
Nasdaq (QQQ): Strongest cap-weighted group, but rejected near $603 VRVP resistance. Last 3-day bounce came on declining relative volume → higher risk of failed attempt. Healthiest outcome is short-term consolidation above 10EMA.
Midcaps (MDY): Range-bound. Defended $595 POC/demand shelf, but breadth (S4TW) weakening. Lags leadership. Needs tightening under $600 for higher-probability breakout.
Small caps (IWM): Bounce on declining relative volume → risk of bull trap. Heavy supply up to $245. Next high-volume move will decide (breakout vs distribution). Weakest breadth of the group.
Focused Stock (PLTR): Secondary VCP forming. Low-volume pullbacks = constructive. August breakout over $156 POC reset trend. Still a clear leader vs group (CIBR). High R/R if volume expansion confirms.
Focused Group (XBI - Biotech): One of the cleanest trending groups. Strong defense at 10EMA on 130% relative volume. Now just 5.7% off 52W highs. High-priority sector for momentum traders.

MARKET ANALYSIS
Large Caps Lead, Small & Midcaps Struggle

Markets are navigating renewed uncertainty this week as the threat of a U.S. government shutdown looms. While such events don’t always rattle Wall Street, this one lands at a delicate moment as investors are already uneasy about a cooling labor market, sticky inflation pressures, and stretched equity valuations. A prolonged shutdown could also delay critical economic data, including Friday’s jobs report, adding another layer of uncertainty heading into the Federal Reserve’s October policy meeting.
Despite the near-term volatility, September has been an unusually strong month for equities. The S&P 500 has gained more than 3% so far, while the Nasdaq has jumped over 5%, powered by strength in technology leaders. The third quarter is also closing on a high note, with the S&P up more than 7% and the Nasdaq nearly 11% over the three-month period. Analysts note that if history is a guide, a strong first nine months of the year often sets the stage for additional gains into year-end.
Nasdaq
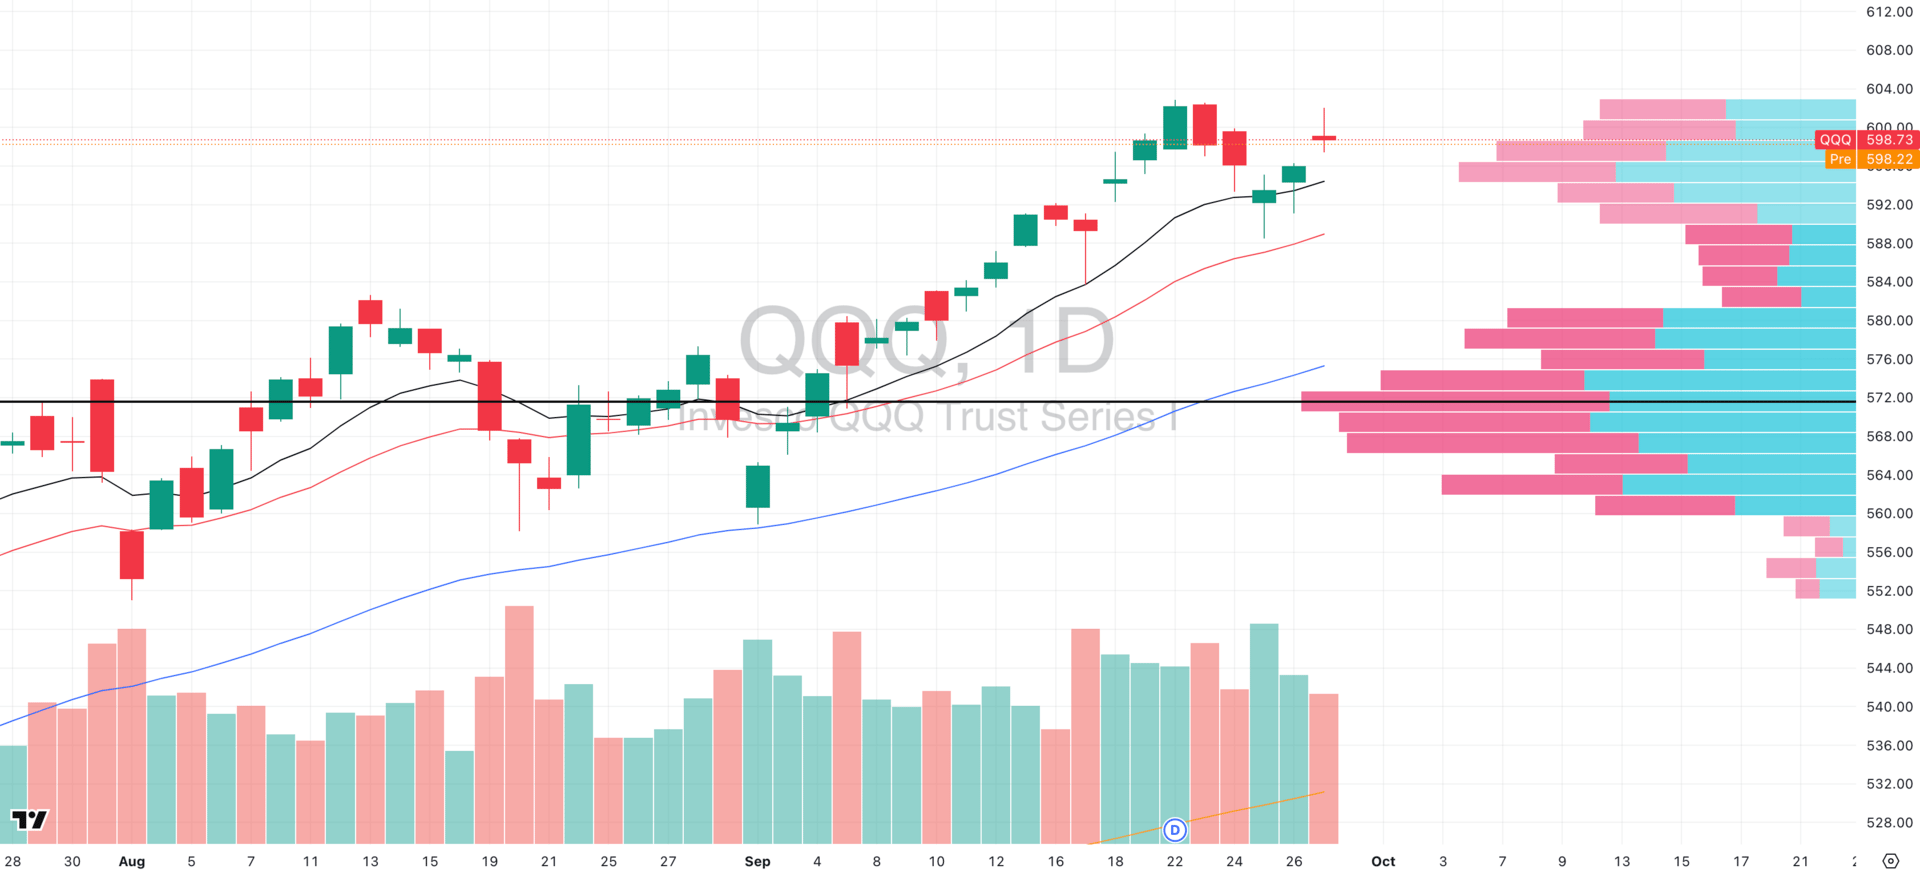
QQQ VRVP Daily Chart
% over 20 EMA: 58.41% | % over 50 EMA: 49.50% | % over 200 EMA: 61.38%
The Nasdaq remains the strongest of all cap-weighted groups, but yesterday’s action showed some supply. Price was rejected almost to the tick at the upper boundary of the visible range volume profile (VRVP) near $603, which has been a magnet for distribution dating back months.
The past three sessions of bounce have come on declining relative volume, which does raise the probability of a failure attempt at these highs. Yesterday’s inverted hammer candle confirms that sellers were present into strength.
Still, the big picture matters: QQQ is cap-weighted, not equal-weighted. That means a handful of megacaps (AAPL, MSFT, NVDA, AMZN, META) can inflate or deflate the index even if broader tech is diverging (all behaving well, fyi).
This is why we always treat the index as a proxy as the real edge comes from isolating the leading stocks within the leading groups.
Base case:
A short-term consolidation or retest of yesterday’s lows is the healthiest outcome.
The rising 10EMA sits just below and continues to act as a logical demand shelf.
A decisive breakout above $603 on rising volume would force shorts to cover, but until then, digestion is the higher probability scenario.
S&P 400 Midcap
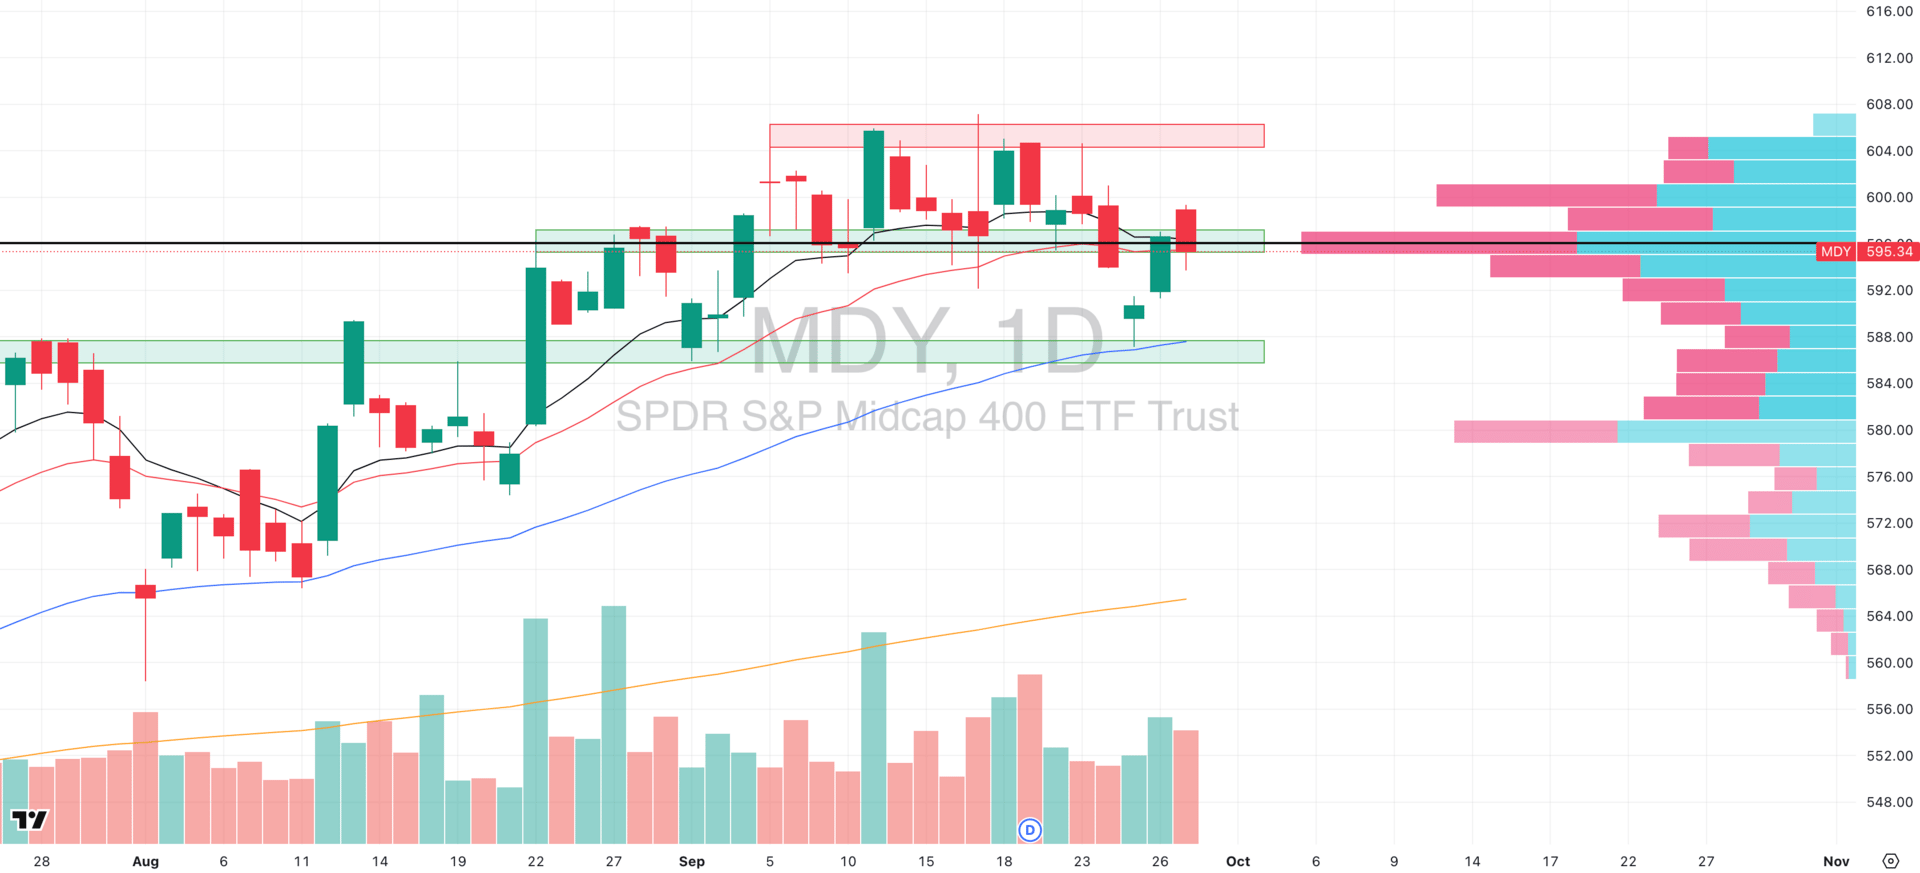
MDY VRVP Daily Chart
% over 20 EMA: 38.09% | % over 50 EMA: 50.12% | % over 200 EMA: 59.14%
Midcaps remain range-bound, bouncing but not breaking out. The constructive detail from the past three sessions is the defense of the $595 demand zone, which aligns with both the point of control (POC) and the pivot level we’ve been chopping around since Aug 22. That shelf continues to act as the key balance point.
Technically, the bounce three days ago off the rising 50-day EMA reaffirms that the medium-term trend is still pushing higher, even if momentum is choppy.
Between $595 and $600 sits a low-volume pocket on the profile and ideally, we’d like to see price tighten and consolidate here, setting the stage for a cleaner expansion attempt.
The issue lies in breadth as the S4TW (short-term midcap breadth, % > 20EMA) has been declining, a sign of weakening participation beneath the surface. That deterioration suggests leadership is thin, and midcaps as a group continue to lag relative to large/megacap tech.
Russell 2000
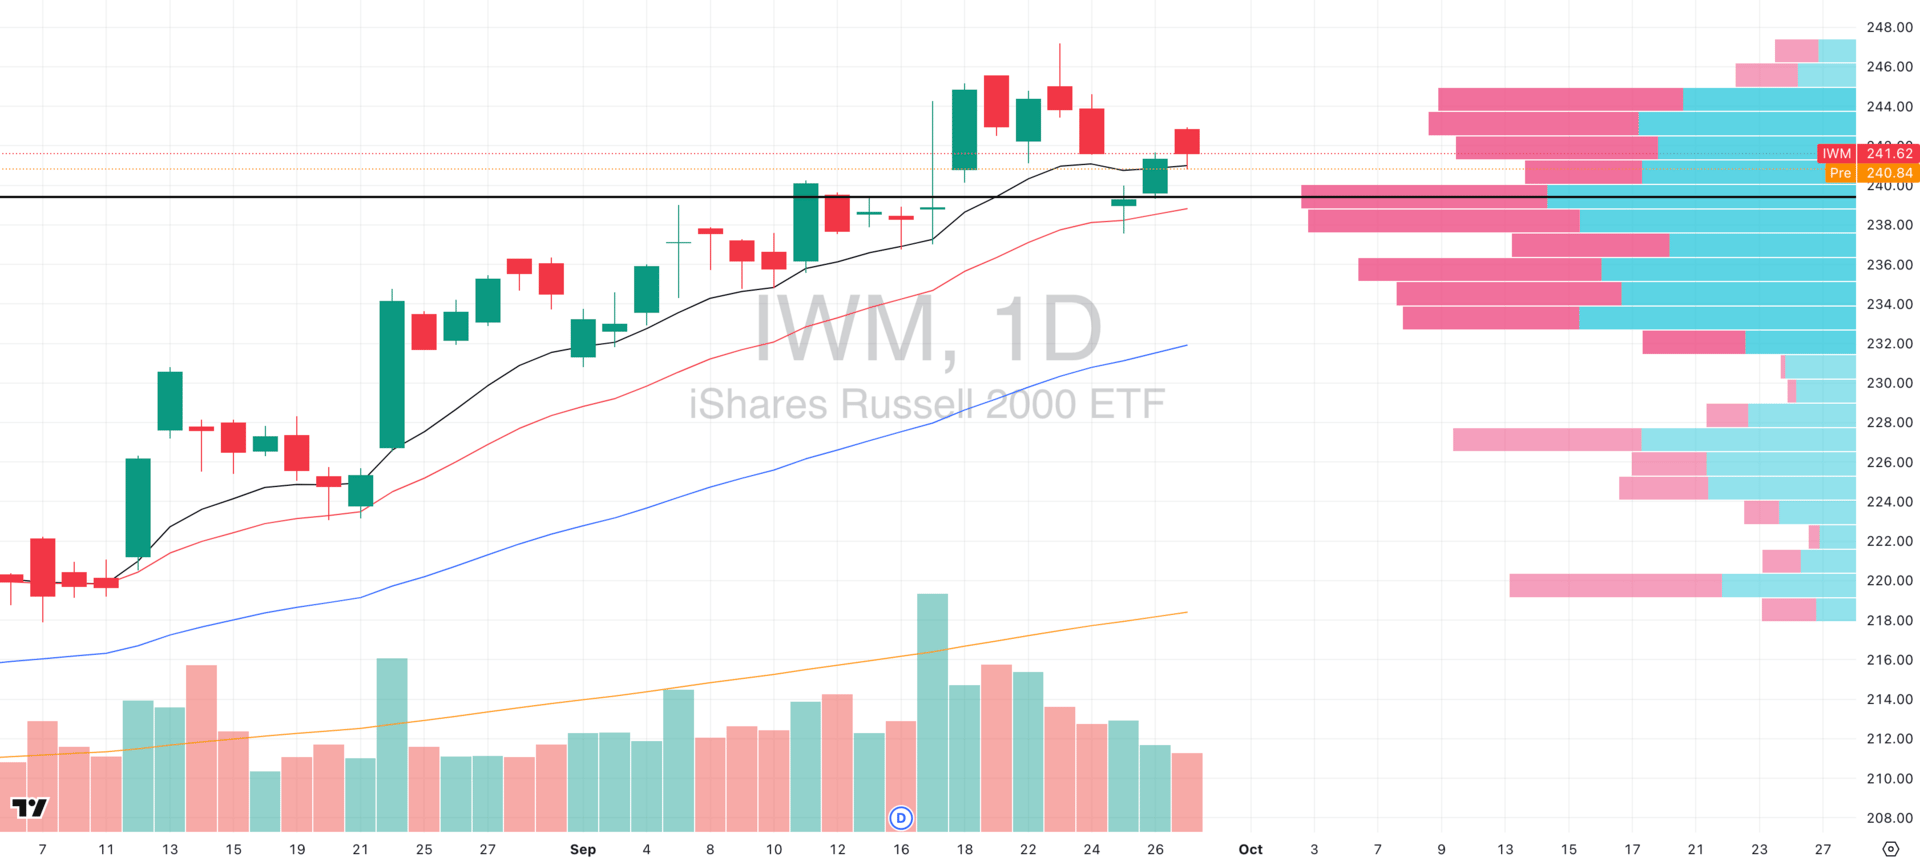
IWM VRVP Daily Chart
% over 20 EMA: 42.19% | % over 50 EMA: 56.51% | % over 200 EMA: 60.42%
The Russell continues to lag large caps, with breadth deterioration becoming increasingly visible. Over the past three sessions, the bounce has come on declining relative volume and just like the MDY, that raises the probability of a bull trap, especially given the heavy supply overhead up to $245.
The key here is not so much the chop itself, but where the next relative volume expansion shows up:
A decisive push above $245 on high relative volume = clear long signal and evidence of rotation into small caps.
A breakdown lower on high relative volume = screams distribution and would confirm this bounce as a trap.
The Real Traders Aren't on CNBC

Your current options for finding stock trades:
Option 1: Spend 4 hours daily reading everything online
Option 2: Pay $500/month for paywalled newsletters and pray
Option 3: Get yesterday's news from mainstream financial media
All three keep you broke.
Here's where the actual edge lives:
Twitter traders sharing real setups (not TV personalities)
Crowdfunding opportunities before they go mainstream
IPO alerts with actual timing
Reddit communities spotting trends early
Crypto insider takes (not corporate PR)
The problem? You'd need to be terminally online to track it all.
Stocks & Income monitors every corner where real money gets made. We send you only the actionable opportunities. No fluff, no yesterday's headlines.
Five minutes daily. Walk away with stock insights you can actually act on every time.
Stocks & Income is for informational purposes only and is not intended to be used as investment advice. Do your own research.
FOCUSED STOCK
PLTR: A Very Strong Secondary Contraction
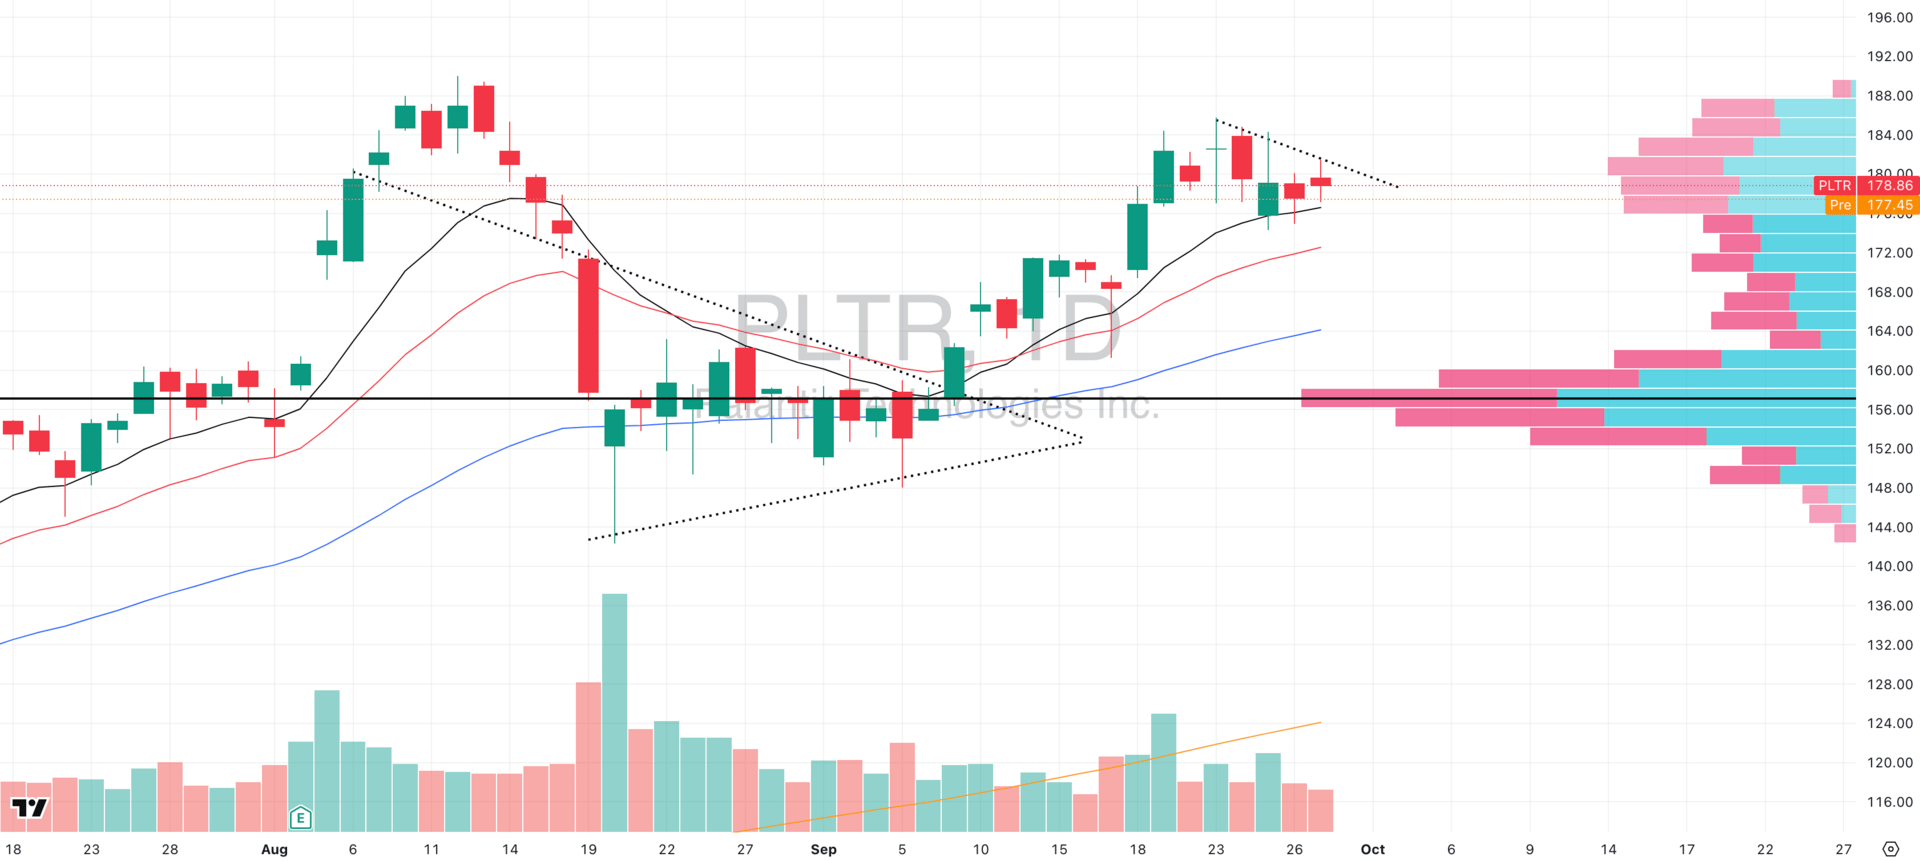
PLTR VRVP Daily Chart
ADR%: 3.98% | Off 52-week high: -5.9% | Above 52-week low: +396.1%
PLTR is shaping up beautifully here. Yesterday’s session was quiet with only 57% of its 20-day relative volume, but that’s constructive as the low-volume pullbacks into support are exactly what you want to see in a volatility contraction pattern (VCP).
Support Test: Buyers defended the rising 10EMA, rejecting downside and holding structure. That’s a healthy sign that demand is waiting under the surface.
Bigger Picture: The dominant trend remains very strong after August’s decisive breakout over the $156 POC. That breakout reset the entire supply/demand dynamic, and PLTR has been riding a Stage 2 trend ever since.
Current Action: What we’re seeing now is a secondary contraction — essentially a natural pause where volatility tightens, supply dries up, and the stock builds energy for its next move.
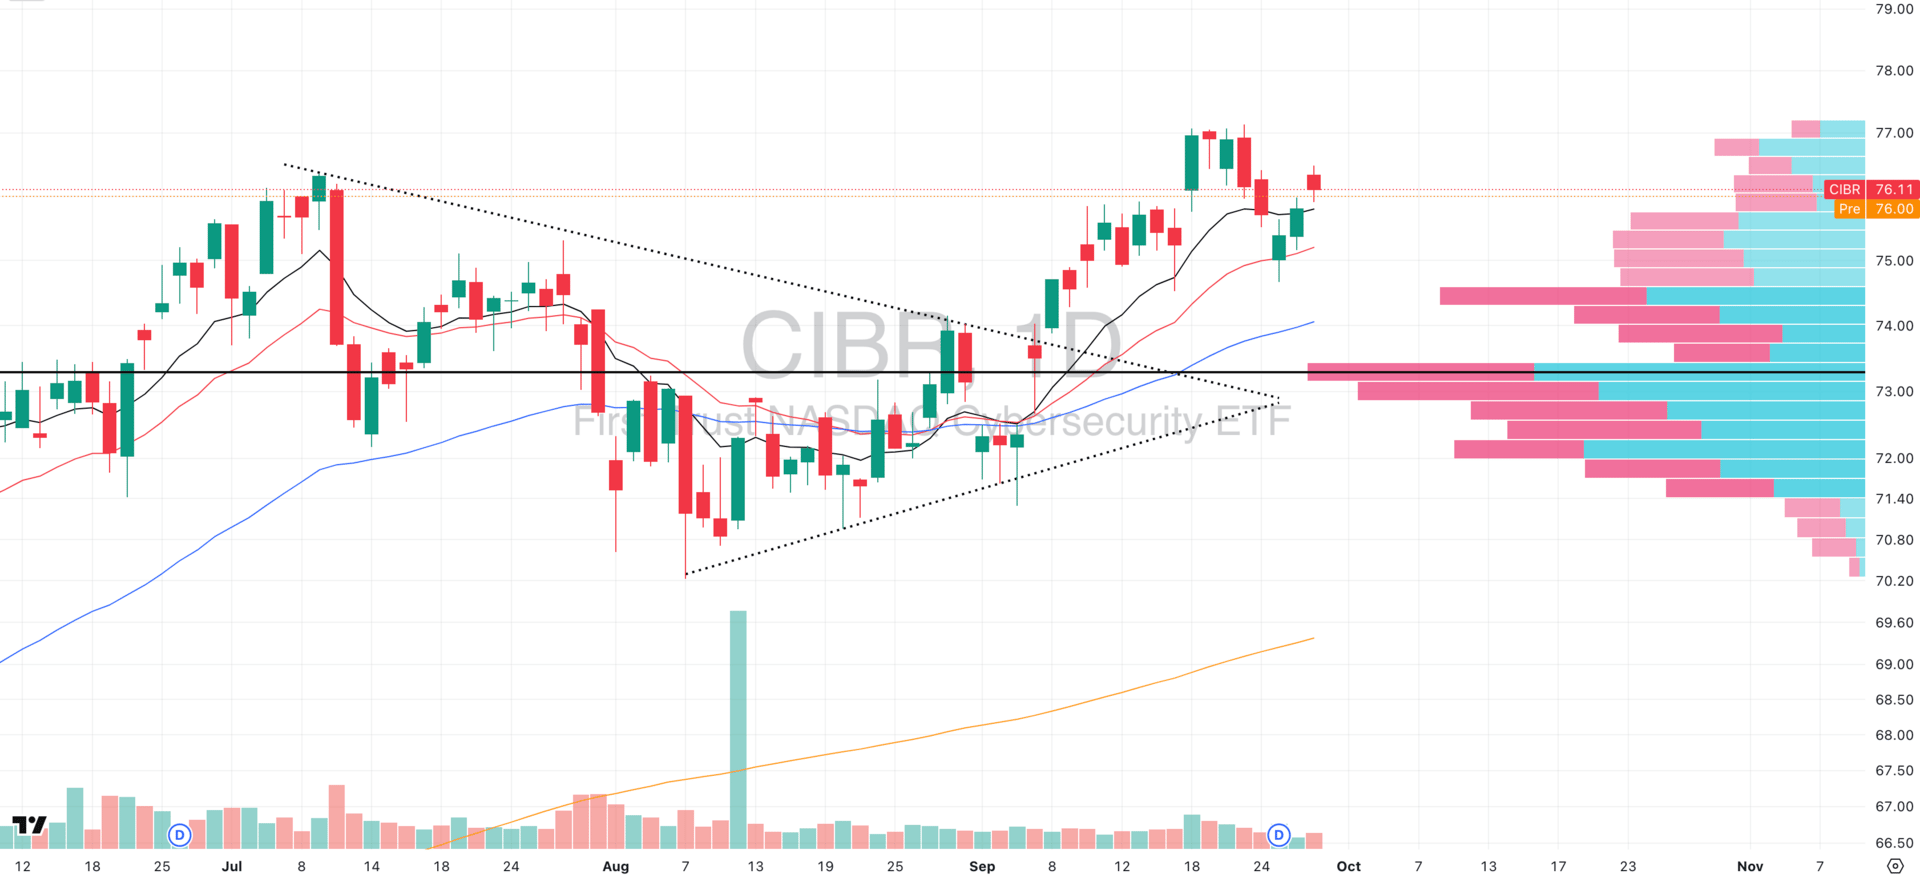
CIBR VRVP Daily Chart
CIBR, the cybersecurity ETF, is also tracing out a secondary VCP, showing that the group structure itself is healthy.
But the key is relative strength: PLTR is clearly outperforming its group ETF. That leadership is critical. When a stock is outpacing its group, it often becomes the institutional preference within that theme.
Remember, you don’t just want “good setups.” You want leaders inside leading groups. PLTR fits that bill: a fresh Stage 2 leader, holding higher lows, contracting on low relative volume, and leading its sector ETF.
FOCUSED GROUP
XBI: Biotechs Trending Cleanly
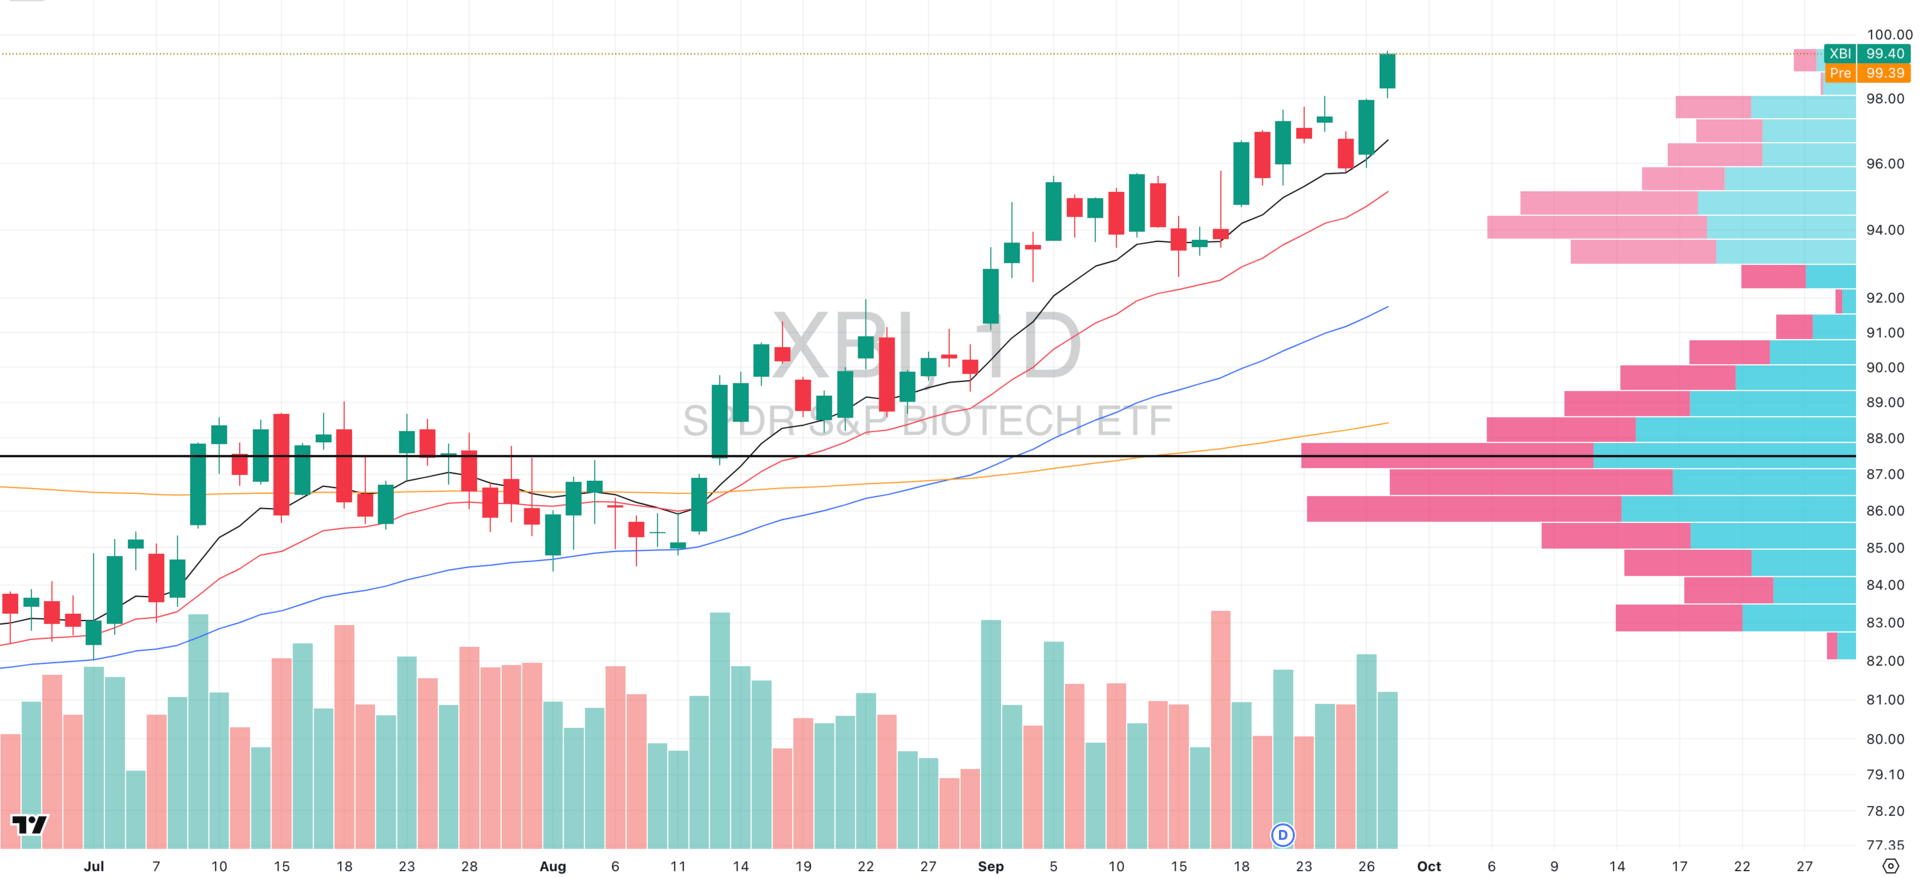
XBI VRVP Daily Chart
XBI (Biotech ETF) has quietly been one of the strongest group tapes over the past month, and yesterday added real conviction.
The ETF pushed higher on 106% relative volume, and what stood out most was the intraband defense of the rising 10EMA where buyers stepped in hard with 130% relative volume.
That’s the exact kind of signature you want to see in a trending group: demand showing up at rising support.
Structurally, XBI is now just 5.7% away from its 52-week highs and you ideally want to be in groups that are approaching their highs with rising relative volume as these tend to attract momentum flows, especially when the broader tape is digesting elsewhere.
Momentum traders should have biotech leaders on scan right now. Look for individual names showing clean Stage 2 structures with accelerating relative strength vs both SPX and XBI.
This is a group to watch for rotation flows, especially if we see the SPY and QQQ pause today.

Q&A
Got a trading question? Hit reply and ask!
Q: “How does sector rotation actually work? When/how do you know where to rotate your money?”
Sector rotation is one of those concepts that sounds simple (“just follow the strong groups”), but in practice it’s an art form that takes years of screen time to do with confidence.
Here’s how we personally break it down for swing trading in a way you can actually use:
1) What “rotation” really is
Money rarely leaves the market all at once; it moves. Leadership migrates from one group to another (e.g., semis → software → energy).
Your job is not to predict narratives but to measure where capital is concentrating and position in the strongest stocks inside the strongest groups.
Rotation has three ingredients:
Relative strength (RS) vs a benchmark (we use SPX/SPY).
Trend quality of the sector itself (EMAs, structure, volume).
Breadth inside the sector (how many components are participating).
When those three line up, you have a high-probability “fertile field” to plant new trades.
2) How to measure it (without guessing)
A) Build a simple RS scoreboard
Universe: sector & industry ETFs (XLK, XLE, XLF, XLI, XLY, XLP, XLV, XLB, XLRE, XLU, XLC, plus SMH, SOXX, PBW, XME, etc.).
RS line: Plot a ratio chart (e.g. XLK/SPX. If the line is above its rising 20/50-day MAs and making higher highs, XLK is outperforming the broad equities market.
RS momentum rank: Rank sectors by 1-, 4-, and 13-week total return vs SPY.
Weight recent periods more heavily:
RS Score = 0.5 × (1-week rank) + 0.3 × (4-week rank) + 0.2 × (13-week rank). Higher score = stronger momentum now.
B) Confirm breadth (participation)
For each sector, track:
% of components above 20/50-day EMA.
New 20-day highs minus 20-day lows (internal thrust).
Equal-weight vs cap-weight check (e.g., RSPT vs XLK for tech). If both are rising, leadership is broad; if only cap-weighted is rising, a few megacaps may be masking weakness.
C) Inspect structure (stage & extension)
Stage analysis: Is the sector ETF emerging from Stage 1 (base/accumulation), in Stage 2 (healthy uptrend), or late-Stage 2 (extended, wedging, repeated failed breakouts)?
Extension controls: Compare price vs its 10/21/50 EMA stack and optionally an ATR-based extension (e.g., >2–3× ATR above the 50-EMA = mean-reversion risk).
Volume & VRVP: Rising on up days, drying on pullbacks; heavy volume nodes beneath price act as demand shelves.
3) Deciding when to rotate (objective triggers)
You add to a sector when most of these are true:
RS ratio (sector/SPY) has been rising for 2–3 weeks and is above a rising 20/50-day MA.
Breadth expands (e.g., % >20EMA climbs from the 40s → 60s, new highs > new lows).
Cap-weight and equal-weight variants both break out (broad confirmation).
Sector ETF breaks out from a Stage-1/volatility contraction on above-average volume.
Leading sub-industries inside the sector show the same behavior (e.g., in Tech: SMH (semis) confirming XLK).
You scale down / rotate out when 3+ of these degrade:
RS ratio rolls over (breaks its RS 20-day and makes a lower low).
Breadth narrows (leaders diverge; % >20EMA falls week-over-week).
Distribution (multiple high-volume down days) appears near extension.
Failed breakouts/“round-trip” behavior increases across leaders.
Equal-weight lags badly while cap-weight grinds (narrow leadership = fragility).
4) Stock selection inside the selected sector
Once a sector makes the list, you still need the fast horses:
Relative strength vs sector: Plot e.g. META/XLK or META/XLC. Favor names with rising RS lines making HH/HL.
Setup quality: Look for volatility contractions, base-on-base, Stage-2 pullbacks to the 10/21EMA with drying volume.
Liquidity & ADR: Ensure spreads and ADR fit your risk; know if you’re trading a 2–3% ADR megacap or a 8–12% ADR midcap.
Alignment: Prefer when market → sector → industry → stock all point the same way.
5) A weekly & daily workflow you can actually follow
Weekly (60–90 minutes, weekend)
Rank sectors by RS score vs SPY.
Breadth dashboard: % >20/50EMA and new highs-lows per sector.
Structure check: Which sectors are emerging from Stage 1? Which are late-Stage 2 and stretched?
Build watchlists: 5–10 tickers per top 3 sectors with clean contractions/bases.
Daily (10–15 minutes, pre-market)
Re-check RS ratio slopes (did any flip?).
Note overnight volume/earnings in your watchlist.
Mark triggers (breakout levels, pullback zones) and invalidation (stops).
6) Position sizing & portfolio construction
Concentration with diversification: 60–70% of risk in the top 2–3 sectors; avoid scattering tiny bets across 9 sectors.
Stagger entries: Don’t rotate the whole book in one day. Build tiers as confirmation accrues.
Risk per trade: Keep it small and constant (e.g., 0.25–1.0% of equity); sector rotation changes where you place risk, not how much risk you take.
7) Tells of late leadership (time to lighten up)
RS ratio makes lower high while price makes marginal new high.
Wedges/megaphones, climactic runs with 3–5 wide-range up days, then a high-volume reversal.
Breadth peaks weeks earlier and fades while index still grinds up.
Equal-weight diverges (cap-weight only).
(Think: precious-metal miners after fast runs, or any “too obvious” theme showing exhaustion.)
Remember!
This process is discretionary and systematic: you’re scoring RS, auditing breadth, and judging structure. It’s time-consuming at first, but it compounds and after a few months, you’ll recognize the tells quickly and your watchlists will do half the work.
You don’t need to predict which story wins. You need to measure who’s winning now, rotate into it with tight risk, and keep rotating as the tape evolves. Do that, and your book will naturally flow toward where the market is paying.
If you want a head start, we share our weekly sector scorecard, RS ranks, and ready-to-trade watchlists in Swingly PRO—so you can spend more time executing and less time stitching the data together.
Did you find value in today's publication?This helps us better design our content for our readers |
Reply