- Swingly
- Posts
- Risk On: Why We Are So Bullish
Risk On: Why We Are So Bullish
In partnership with


MARKET ANALYSIS
Here’s All You Need To Know

At the macro level, there is a lot of noise right now, but importantly, there is also a lot of strength underneath the surface. Futures are marginally softer this morning as markets digest a mix of inflation data risk, ongoing Fed-related headlines, and geopolitical uncertainty, but the broader takeaway remains unchanged: capital is not leaving equities, it is rotating.
Recent sessions have reinforced this point. Despite heightened headlines around Federal Reserve independence and political pressure on Chair Powell, U.S. equities have continued to print record closes.
That alone is a strong signal. Markets are acknowledging the uncertainty, but they are not treating it as a reason to de-risk aggressively. Instead, price action continues to suggest selective risk-taking rather than wholesale risk aversion.
Today’s CPI release is the immediate macro catalyst, particularly given how disrupted recent data has been. Expectations call for stable inflation, and when combined with last week’s cooling labor market data, the broader macro backdrop still supports the current rate path being priced by the market.
For traders, this matters less in isolation and more in how price responds. So far, inflation and rates remain a background variable rather than a dominant headwind.
Where many market participants are getting this wrong is by focusing almost exclusively on headline indices like the SPY and QQQ. When people say “the market is consolidating” or “momentum is fading,” what they often mean is that large and mega-cap technology is struggling.
That is only one part of the market. When you look deeper across capitalization tiers and sector groupings, the picture looks very different.
We continue to see strength in smaller and mid-cap areas, alongside leadership emerging in specific industry groups. Our scans are consistently flagging multiple sectors pushing higher at the same time, even as the major indices chop. That is not a weak market.
This is why broad index narratives are increasingly misleading. The opportunity set right now is not found in chasing index-level momentum, but in identifying where relative strength is building beneath the surface.
When capital is willing to move down the risk curve and into more selective areas, it is rarely a sign of a market preparing to roll over.
Strength is present, just not evenly distributed. Traders who are willing to look beyond the indices and focus on relative strength, group leadership, and individual stock behavior are still finding plenty of opportunity in this tape.
Nasdaq
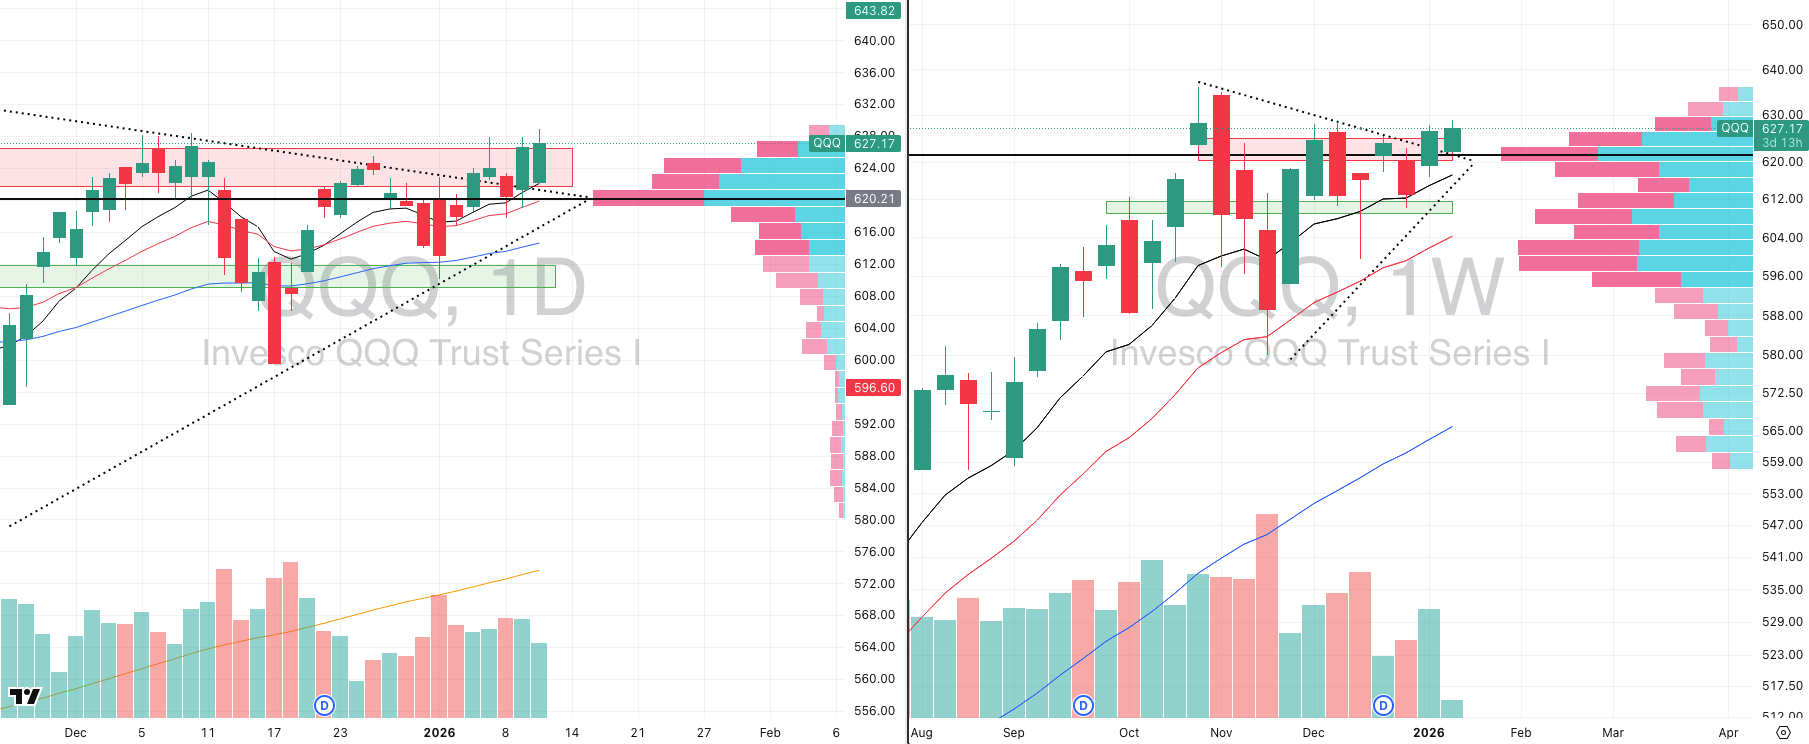
QQQ VRVP Daily & Weekly Chart
54.90%: over 20 EMA | 54.90%: over 50 EMA | 59.80%: over 200 EMA
Starting with the NASDAQ, QQQ experienced a meaningful gap lower yesterday, falling roughly 0.8% at the open. That downside pressure was most pronounced in the NASDAQ relative to other market segments, which is consistent with what we have been highlighting for some time.
Mega-cap technology continues to lag, and the relative weakness in that cohort has become increasingly apparent over the past few weeks.
That said, despite the gap lower, we did see constructive price action develop intraday. QQQ found demand near the 10-day EMA and staged a strong bounce, rallying from roughly 621.90 back toward and slightly above both Friday’s and Wednesday’s closes, which had previously acted as rejection points.
This does represent a tentative sign of life and suggests buyers are still willing to defend key short-term support.
From a broader perspective, we do believe the NASDAQ is coiling for a breakout at some point. Whether that resolves immediately or requires additional time is less important than recognizing the structure that is forming.
On the weekly chart, QQQ remains in a well-defined contraction on the intermediary trend, which is typically resolved through expansion. The challenge right now is that internal conditions remain uneven. Breadth within the NASDAQ is the weakest among the major segments, and leadership is narrow, meaning selectivity is critical.
For traders looking to engage the NASDAQ directly, the ETF itself makes more sense than stock selection at this stage. Using shorter-term charts for entries while targeting a move that resolves on the weekly timeframe is, in our view, the cleanest way to approach this index.
S&P 400 Midcap

MDY VRVP Daily & Weekly Chart
69.42%: over 20 EMA | 77.19%: over 50 EMA | 69.67%: over 200 EMA
Turning to the mid-caps, this remains the strongest capitalization group in the market. While the January 5 breakout was decisive, relative outperformance actually began earlier, around late November, and has continued uninterrupted since then.
Yesterday’s session was particularly telling. MDY briefly dipped on the open, retracing roughly 0.7%, but importantly did not break below Friday’s lows near 626.11.
Buyers stepped in quickly, and price went on to make fresh all-time highs, effectively ignoring the broader market’s headline-driven volatility. Relative volume came in around 85%, which, at all-time highs, continues to confirm institutional participation.
One note of caution is breadth. Roughly 70% of mid-cap stocks are now above their 20-day EMA, with close to 80% above the 50-day EMA. This is characteristic of a power trend, but it does increase the probability of short-term chop or consolidation.
That does not invalidate the trend, but it does mean that new exposure should be sized appropriately and expectations should be calibrated for potential digestion rather than immediate continuation.
Russell 2000

IWM VRVP Daily & Weekly Chart
61.50%: over 20 EMA | 70.04%: over 50 EMA | 66.85%: over 200 EMA
Small caps continue to impress and, from a momentum standpoint, may actually offer better asymmetry than mid-caps at current levels. While they have broadly mirrored the mid-cap move, they are less extended and remain firmly in a leadership role.
Yesterday’s gap down in IWM was minimal, roughly 0.3%, and price never breached Friday’s lows. Like the mid-caps, small caps went on to print new all-time highs, reinforcing the idea that risk appetite remains intact beneath the surface. When viewed relative to the NASDAQ, the divergence is stark. Capital is clearly rotating down the cap curve.
From a macro and market-structure perspective, this matters. Sustained strength in small and mid-cap stocks is rarely a feature of environments that are about to roll over. T
hese are the areas of the market that typically absorb higher-risk capital, and institutions do not allocate aggressively to these segments unless they believe broader conditions will remain supportive.
The Year-End Moves No One’s Watching

Markets don’t wait — and year-end waits even less.
In the final stretch, money rotates, funds window-dress, tax-loss selling meets bottom-fishing, and “Santa Rally” chatter turns into real tape. Most people notice after the move.
Elite Trade Club is your morning shortcut: a curated selection of the setups that still matter this year — the headlines that move stocks, catalysts on deck, and where smart money is positioning before New Year’s. One read. Five minutes. Actionable clarity.
If you want to start 2026 from a stronger spot, finish 2025 prepared. Join 200K+ traders who open our premarket briefing, place their plan, and let the open come to them.
By joining, you’ll receive Elite Trade Club emails and select partner insights. See Privacy Policy.
FOCUSED STOCK
SHOP: A Big Move is Coming

ADR%: 3.58% | Off 52-week high: -7.8% | Above 52-week low: +140.4%
Shopify delivered a notably strong session yesterday despite a challenging open. The stock gapped down by roughly 1.4%, briefly undercutting the rising 50-day EMA.
That move represented just under half of Shopify’s average daily range and, on the surface, appeared vulnerable. What stood out, however, was how decisively buyers stepped in.
The rising 50-day EMA ultimately held, effectively keeping price afloat throughout the session. While Shopify had been contracting on declining momentum in recent weeks, which can sometimes precede weakness, yesterday’s volume profile shifted that narrative.
Relative volume expanded to roughly 74% of the 20-day average, the highest level seen since early January. Given how elevated Shopify’s baseline volume has been, that expansion is meaningful.
On the weekly chart, Shopify continues to build a constructive contraction pattern with higher lows intact. Demand is repeatedly appearing at key moving averages, reinforcing the integrity of the intermediary trend.
From a broader perspective, Shopify sits at an interesting intersection. While often classified under Industrials, it effectively functions as critical infrastructure for global e-commerce. As artificial intelligence continues to integrate more deeply into online retail and logistics, Shopify remains structurally well-positioned within that ecosystem.
From a trading standpoint, yesterday’s response strengthens the case that demand is unlikely to allow sustained acceptance below the 50-day EMA near 161. With price
also sitting close to the rising 10-week EMA, Shopify stands out as a pullback candidate rather than a breakout vehicle. Breakouts, particularly from opening range highs, have continued to struggle across the market, making pullback structures far more attractive in the current environment.
FOCUSED GROUP
XSD: Still Very Bullish on Semiconductors

XSD VRVP Daily & Weekly Chart
Recently, sentiment around the group has turned increasingly cautious, largely driven by weakness in Nvidia. That framing is incomplete. Nvidia is not the semiconductor market, and focusing solely on mega-cap names risks missing where the actual strength resides.
Semiconductors as a group have been acting well, particularly down the risk curve. Several meaningful breakouts have occurred over the past one to two weeks, and the strongest individual stock in the market right now is a semiconductor name: Micron, ticker MU. Micron has emerged as the clear momentum leader within the space.
From an ETF perspective, XSD, the S&P Semiconductor ETF, continues to trade constructively. Following its breakout on January 2nd, XSD posted a strong advance into January 6th on elevated relative volume and has since transitioned into a tight flag.
Price is holding the rising 10-day EMA cleanly, and volatility continues to compress. Relative strength sits near 91 versus the S&P 500, placing it firmly among the leading groups.
SMH, the VanEck Semiconductor ETF, shows an even stronger relative strength reading near 94. SMH has greater exposure to smaller and mid-cap semiconductor names, and its outperformance reinforces a theme we continue to emphasize.
The strength within semiconductors is not concentrated in the mega-cap complex. It is occurring further down the capitalization spectrum.
We highlighted Broadcom (AVGO) yesterday as a focus stock, and it remains a name to monitor closely. More broadly, semiconductors continue to exhibit strong trend structure, healthy consolidation behavior, and clear relative strength.

Did you find value in today's publication?This helps us better design our content for our readers |
Reply