- Swingly
- Posts
- Risk-On? Not Yet.
Risk-On? Not Yet.
In partnership with
OVERVIEW
Trend-Following Danger Zone
Gold’s Shock Phase → Tariff news on 1-kilo & 100-oz bars — Switzerland’s largest gold export to the U.S. — sent futures to a record $3,534.10/oz.
Equity Breadth Weakness → Nasdaq is still the relative strength leader, but breadth under 50% means it’s flying on one engine. Midcaps are pinned at $569 support, and small caps are clinging to short-term EMAs. Without a breadth + volume alignment, sustainable uptrends remain statistically unlikely.
Cash as a Weapon → Traders who banked big gains in April–July risk giving it all back in August–Sept chop. Sitting in cash now isn’t passive — it’s strike power for when the right setups reappear.
What to Watch Tomorrow
Breadth triggers for gold’s Shock → Discovery transition
Nasdaq 10-EMA hold vs. breadth deterioration
Midcap $569 and Russell 2000 EMA defense
System win rates hitting “pause” thresholds

MARKET ANALYSIS
Protect Your Profits: Defense Is King

The tape remains one of the most dangerous environments for trend-following systems which are struggling, and most earnings-driven setups are failing to establish follow-through. In conditions like this, every day you avoid a low-quality trade is capital preservation at work.
The Gold Shock
Gold futures spiked to a record $3,534.10/oz after reports that Washington will impose tariffs on one-kilo bars — the most traded bullion form on Comex — as well as 100-ounce bars. This matters because kilo bars make up the bulk of Switzerland’s gold exports to the U.S.
Historically, sudden policy shifts of this magnitude in the gold market tend to produce a two-phase reaction:
Shock Phase → Volatility spike with illiquid gaps and emotional flows.
Discovery Phase → Market digests the policy’s real supply/demand impact before forming a durable trend.
Right now, we’re still in the shock phase, which means tradable moves as volatility causes sharp rallies.
Beyond Gold
Equities remain in breadth fragmentation mode — high-beta growth is chopping sideways, and the few pockets of relative strength have narrow participation.
Without alignment between breadth, leadership, and volume, sustainable trend development is statistically low.
In Swingly Pro, we break down the last gold tariff shocks, the exact breadth triggers that mark the end of Phase 1, and how to position for the discovery phase.
Tomorrow, we’ll update whether those triggers are starting to appear.
Nasdaq

QQQ VRVP Daily Chart
% over 20 EMA: 41.58% | % over 50 EMA: 47.52% | % over 200 EMA: 56.43%
The Nasdaq remains the relative strength leader — but leadership is increasingly narrow. Yesterday’s open saw immediate selling pressure, erasing early gains and forcing QQQ back to its 10-EMA, where buyers stepped in.
With ~55% of the S&P 500 in tech, mega-cap strength is keeping QQQ afloat even as midcaps and small caps falter. Historically, when Nasdaq breadth sits below 50% but price holds above the 10-EMA, we see one of two scenarios:
Breakout Continuation (low probability) → Tech mega-caps drag QQQ to marginal new highs before failing.
Leadership Crack (higher probability) → Breadth deterioration bleeds into mega-caps, triggering a swift 3–5% pullback.
If/Then Levels:
Bullish Path: Hold the 10-EMA and reclaim yesterday’s high → opens room to all time highs at around $575
Bearish Path: Lose 10-EMA on volume → targets the 20-EMA near $561
S&P 400 Midcap

MDY VRVP Daily Chart
% over 20 EMA: 38.90% | % over 50 EMA: 50.62% | % over 200 EMA: 47.63%
Midcaps were aggressively rejected at $578 on the open — right at the Point of Control (POC) — with sellers immediately forcing a full loss of the 10-EMA and 20-EMA. That rejection drove price -1.61% from the open to intraday lows near $569.
Why $569 Matters
This zone lines up with a visible volume profile demand shelf.
Historically, when MDY loses both short-term EMAs in one session, this shelf is either the springboard for a 2–3 day recovery or the trap door into a deeper pullback.
If/Then Roadmap
Bullish Path (lower probability) → Hold $569 and reclaim $575 (10 and 20 day EMAs) → sets up a retest of $578.
Bearish Path (higher probability) → Break below $569 with expanding volume → opens the door to the rising 200-EMA near $550 (~2.24% lower).
Russell 2000

IWM VRVP Daily Chart
% over 20 EMA: 34.89% | % over 50 EMA: 44.96% | % over 200 EMA: 41.86%
Small caps mirrored midcap price action yesterday with a high relative volume rejection off the Point of Control (~$223). The sell-off was sharp, but less aggressive than MDY — IWM is still hovering just -0.36% below both its 10 and 20-EMAs.
Premarket shows a gap-up attempt above these EMAs, but the tape remains choppy and low conviction, with no sustained leadership emerging from the small-cap space.
If/Then Roadmap
Bullish Path (lower probability) → Hold above 10/20-EMA and clear $224.20 on volume → opens path toward $226–$227 resistance zone.
Bearish Path (higher probability) → Fail to hold EMAs and lose $221.80 → increases odds of a retest of $219 demand shelf.
Historical Context
When IWM rejects its POC but holds short-term EMAs, the next 3–5 sessions tend to resolve with an abrupt directional break — often in sync with midcap confirmation.
The current setup is a classic “coiling under uncertainty” pattern, where volatility compression can lead to an outsized move once leadership emerges.
🧠 Mindset Check: Cash Is a Position
Most traders suffer from action bias — the urge to always be in a trade. Others know the opposite: cash is an active, alpha-generating decision.
It has risk/reward, opportunity cost, and — in today’s rate environment — positive return.
Why Cash Is a Weapon
Capital Preservation = Compounding Power
If your account is +50% from April–July 2025, defending that gain through August–September chop compounds wealth as effectively as a winning trade — but without the downside risk.Positive Carry
In 2025, USD cash yields ~4%. A $250K account parked for 2 months earns ~$1,667 risk-free, while staying fully liquid.Flexibility & Strike Power
Cash-rich traders can hit high-conviction setups instantly instead of clawing out of drawdowns.
Historical Cash Triggers
After 3–4 month surges (Aug–Nov 2020, Mar–Jun 2023), broad market win rates dropped 25–40% in the next 4–8 weeks.
Our breakout model (42% baseline win rate) typically falls below 30% win rate after such aggressive market runs. That’s our personal signal to shift defensive.
Your Cash Checklist:
Market breadth narrowing?
System win rate <30%?
High prior gains to protect?
If yes to 2+ — cash is the highest-ROI position.
Your Daily Edge in the Markets
Want to stay ahead of the markets without spending hours reading?
Elite Trade Club gives you the top stories, trends, and insights — all in one quick daily email.
It’s everything you need to know before the bell in under 5 minutes.
Join for free and get smarter about the markets every morning.
FOCUSED STOCK
TSLA: Our Top AI Play

TSLA VRVP Daily Chart
ADR%: 3.41% | Off 52-week high: -34% | Above 52-week low: +77.1%
Among the Magnificent 7, TSLA currently shows the cleanest technical structure — a multi-month flag since its June 2025 peak near $370, with a linear contraction that screams controlled supply and steady institutional accumulation.
Why This Pattern Matters
Linear contraction means volatility compresses in a predictable way — historically, this favors explosive resolution when demand returns because sellers have been absorbed in an orderly fashion.
Key Technical Map
Accumulation Signal → Volume has been drying through consolidation, a classic pre-breakout tell.
Trigger Zone → $325 marks the top of the flag and a high-volume VRVP node.
If/Then Roadmap
Break >$325 on +50% relative volume in first 60 min candle → Expect a fast momentum push toward $340–$345+
Reject at $325 & lose $315 → Opens door for full flag retest near $304 (priors support & 200 day EMA).
Why it matters now: With many MAGS names extended or breaking trend, TSLA’s tight flag offers one of the few large-cap growth setups still showing textbook structure.
FOCUSED GROUP
XLP: Defensives On The Rise

XLP VRVP Daily Chart
ADR%: 0.96% | Off 52-week high: -13% | Above 52-week low: +9.8%
XLP cleared its Point of Control (~$80.90) on Wednesday, breaking above both the 10-EMA and 20-EMA and stepping into a low-volume VRVP zone — historically, this is where moves can accelerate because fewer resting orders slow the tape.
But there’s a key test ahead: $82.50 — a level that’s rejected price multiple times since Feb 2025 and now sits near premarket highs.
Technical Map
Institutional Footprint → Relative volume rising 4 straight sessions, capped by yesterday’s +107% surge — a clear sign of aggressive institutional participation.
Upside Path → Once through $82.50, resistance thins until $83–$83.50 — a +0.6–1.2% window before the next supply zone.
Downside Check → Failure at $82.50 sets up a likely retest of the $81–$81.20 volume shelf for support.
Macro Context
With growth sectors in cleanup mode, defensives often catch a bid. If market breadth keeps fragmenting, staples like XLP will act as a capital shelter by attracting flows from higher-beta sectors.

Q&A
Got a trading question? Hit reply and ask!
Q: “I understand you can’t always trade, but how do you know when to stop and pause?”
The difference between a consistent trader and a churn-and-burn gambler?
The ability to slam the brakes before the market takes your edge and your capital.
This isn’t about “feeling off.” It’s about hard data showing the environment — or your execution — has degraded. Two biases kill traders here: sunk cost fallacy (trying to win back losses) and illusion of control (thinking skill can override bad tape).
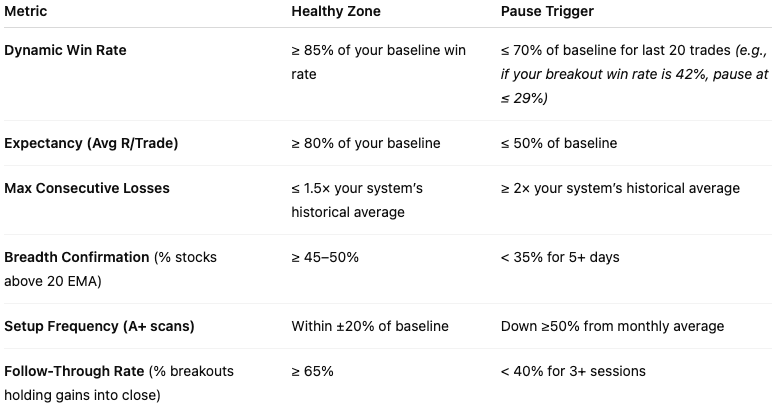
Step 1: Peg Your Metrics to Your System
Track a rolling last-20-trades window against your 12-month baseline. Track these hard stats daily, weekly, and rolling-20 trades
Below is just an example of how you can set this up for yourself:
Step 2: Recognize Regime Shifts
Breadth Divergence → QQQ at highs while QQQE, MDY, IWM lag under 10 & 20 EMA.
Failed Follow-Through Days → Breakouts reversing in 1–2 days on heavy volume.
Volatility Compression → ATR% down 20–30% from 60-day average.
Crowded Tape → 50%+ of index gains from top 5–10 names.
Step 3: Protect the House
In Feb–Mar 2022, growth breakout win rates fell from 43% to 28%. Those who paused avoided a -12% system drawdown. Those who pushed through lost capital and confidence — taking months to recover.
It’s the same discipline a casino uses when it shuts down a table with too many card counters: protect the house, protect the capital.
This is the same discipline a casino uses when they shut a table with too many card counters: protect the house, protect the capital.
In Swingly Pro, we talk about how to build these exact systems so no member has to guess. We all know exactly when the market is ours to attack, and when it’s time to step aside and raise cash
This is the power of trading alongside a team → see what’s included
Reply