- Swingly
- Posts
- Rate Cut Playbook: How to Trade the Next 24 Hours
Rate Cut Playbook: How to Trade the Next 24 Hours
OVERVIEW
Stay Safe: No Need To Gamble The Reaction
QQQ leads: Consolidating constructively, no major extension risk yet.
QQQE confirming breadth: Equal-weight Nasdaq holding strong despite supply overhead.
MDY: Faded into rising 20-EMA, but $595 demand zone holding — key support to watch.
IWM: Stronger than midcaps, but may need a $237 retest before confirming small-cap leadership.
Mindset: Rate cuts near highs historically skew bullish (+9.8% avg. 12m forward), but volatility always re-rates higher. Survival > prediction.
Focused Stock: SY: Textbook VCP setup, riding 50-EMA support, pressing against POC.
Focused Group: QTUM: Strongest growth theme in the market, broad participation, but near-term pullback wouldn’t surprise.

MARKET ANALYSIS
A Big Day For Stocks

Markets are steady this morning as investors wait for the Fed’s big policy decision later today. A rate cut is all but guaranteed as traders are pricing in a 96% chance of a quarter-point move, but the real question isn’t whether the Fed cuts, it’s how markets respond once the decision is out.
Stocks have been grinding sideways ahead of the announcement. The S&P 500 and Nasdaq ended yesterday nearly flat, while Nvidia slipped after reports China is blocking some chip purchases. Traders are bracing for Chair Powell’s comments and the updated “dot plot,” which will offer clues on just how many cuts could follow.
That reaction is what really matters. A cut that’s already priced in could spark a “sell the news” moment, while signs of a more dovish path could fuel another leg higher into year end.
In today’s report we will break down exactly what you can expect moving forward.
Nasdaq
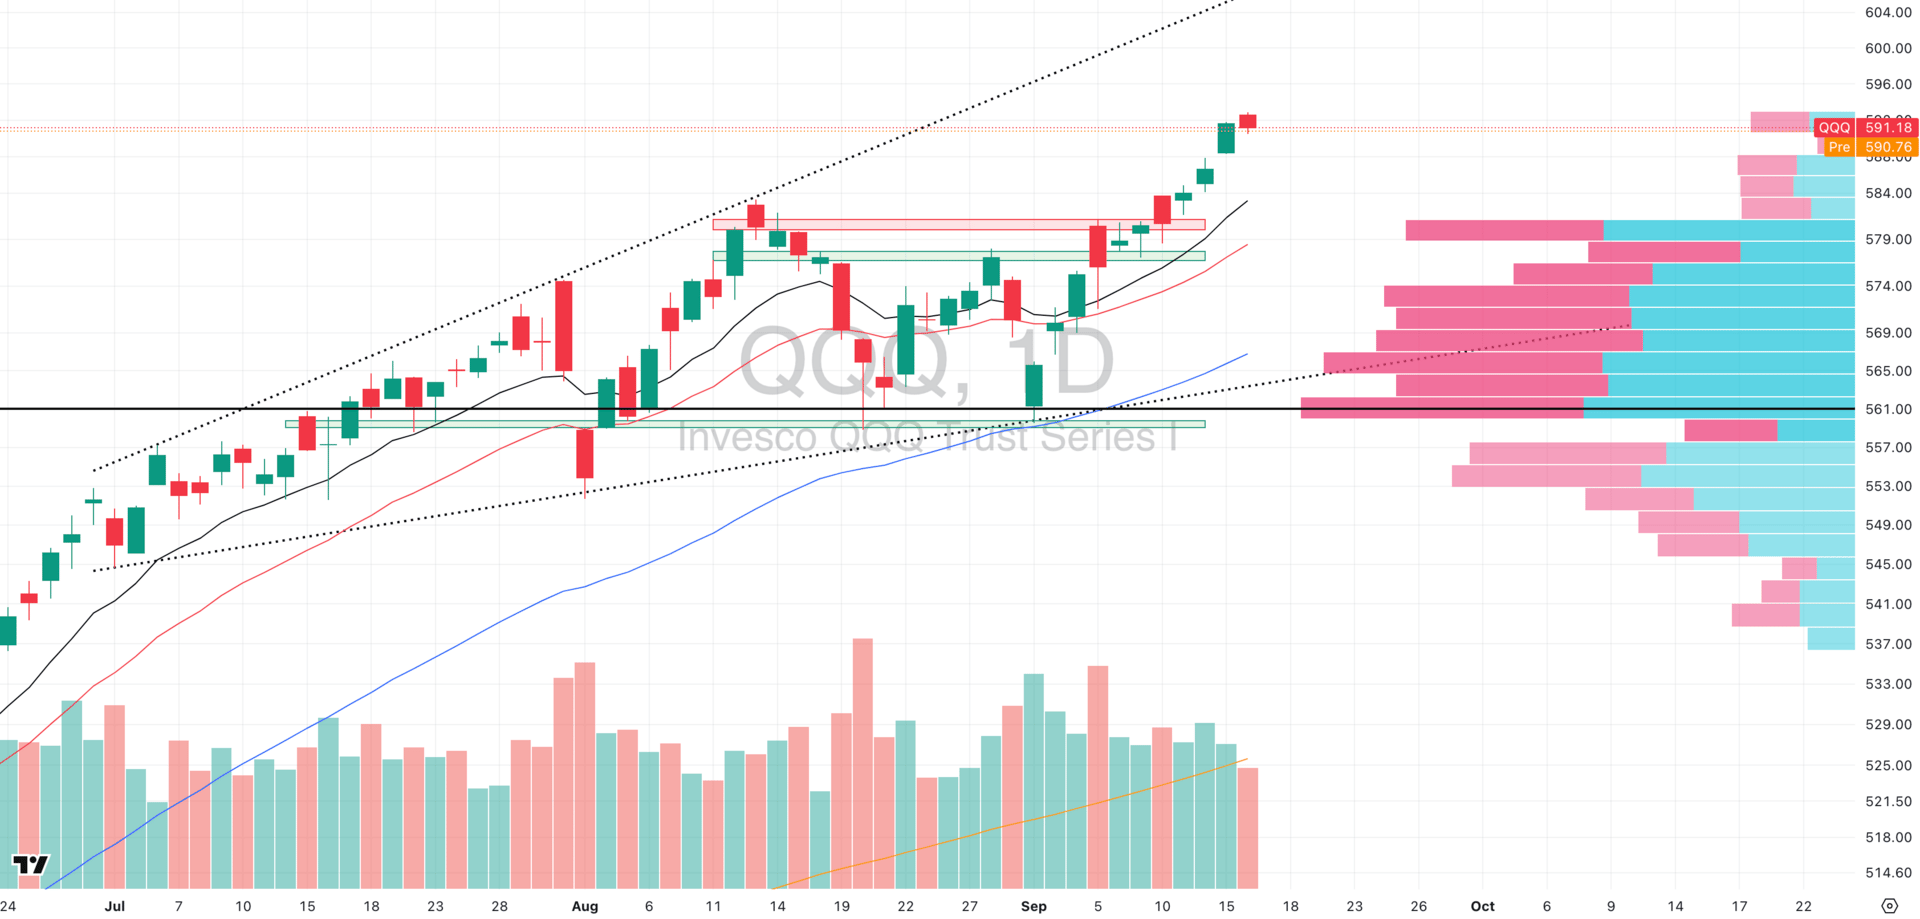
QQQ VRVP Daily Chart
% over 20 EMA: 45.54% | % over 50 EMA: 40.59% | % over 200 EMA: 59.40%
QQQ printed a low-volume consolidation day yesterday with a small red candle that found intraday support at Monday’s highs.
Relative volume came in at just 81% of its 20-day average, a sign supply wasn’t aggressive. That makes this pause look healthy and constructive. With price sitting only ~1.4% above the rising 10-EMA, we don’t see concerning extension levels yet.
Heading into today’s rate cut, intraday swings could be sharp.
Even though a cut is well priced, the first reaction often runs disorderly, and it’s simply not worth trying to predict where things go. Our position is never to try to front run the fed.
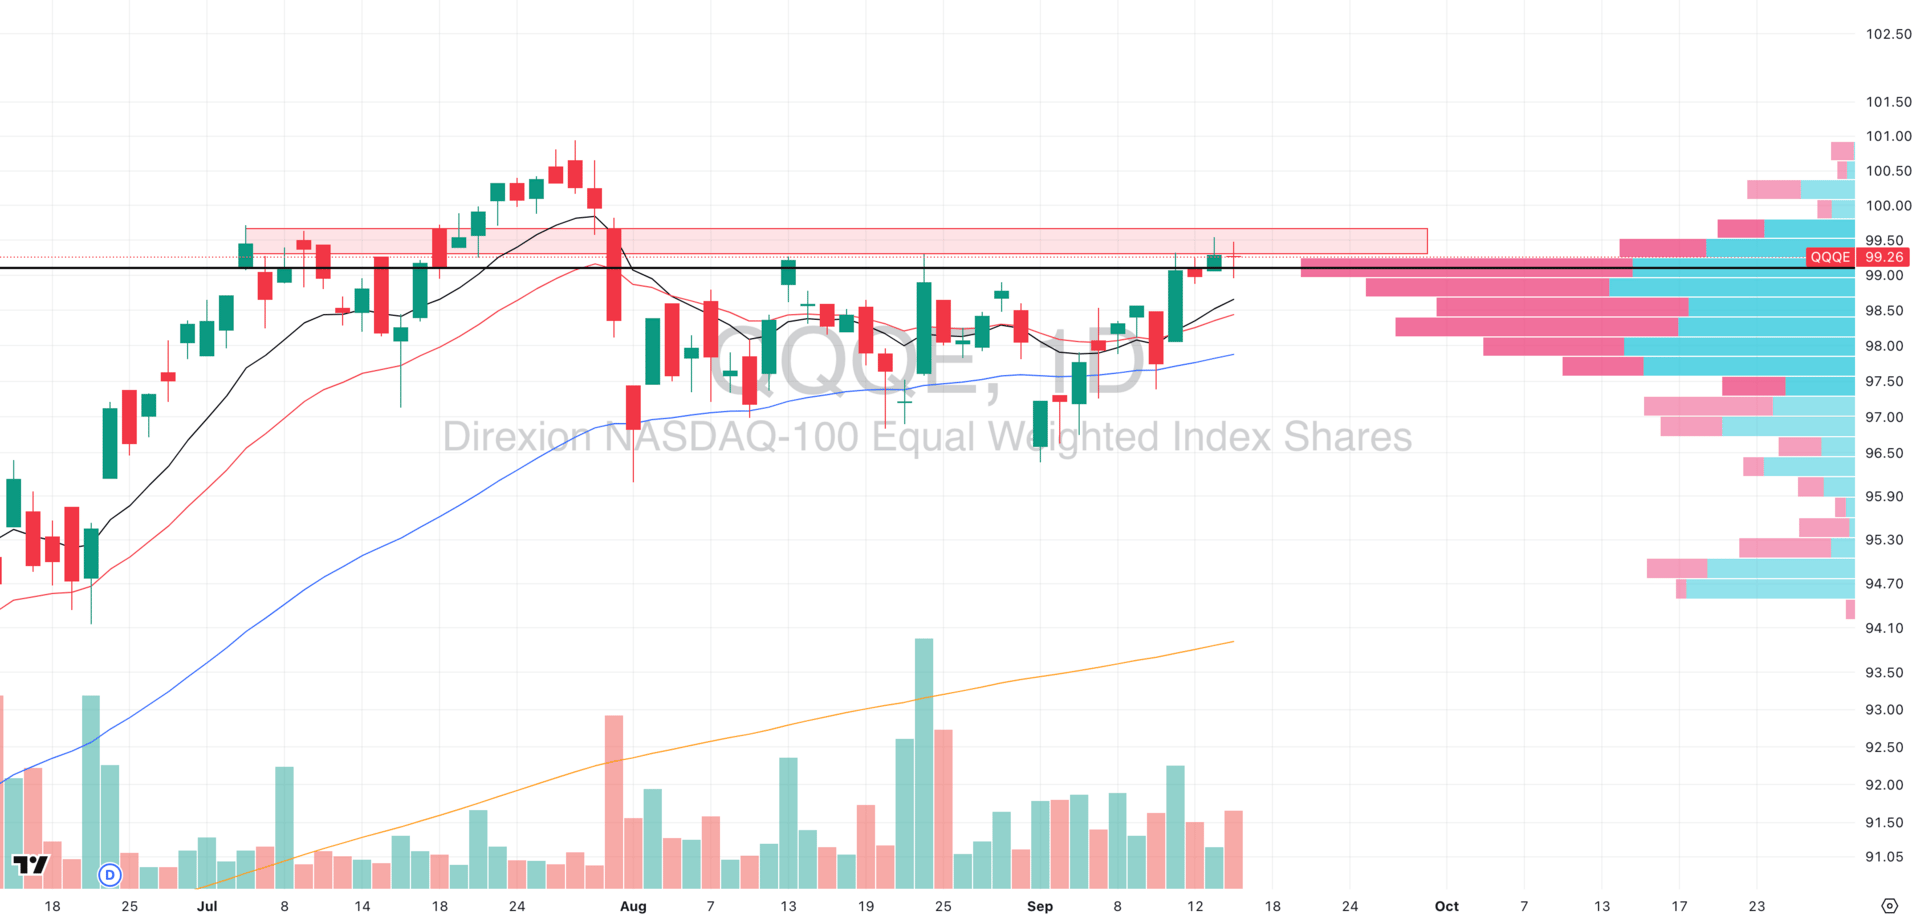
QQQE VRVP Daily Chart
Meanwhile, QQQE continues to act impressively. Supply overhead near $99 has triggered short-term rejection, but these rejections haven’t carried heavy relative volume.
Yesterday we saw demand step in after a quick dip below $99, producing a strong intraday VCP-type recovery. The equal-weight is confirming that breadth within the Nasdaq 100 is holding up well, and taken together, QQQ remains the strongest of the major groups.
S&P 400 Midcap
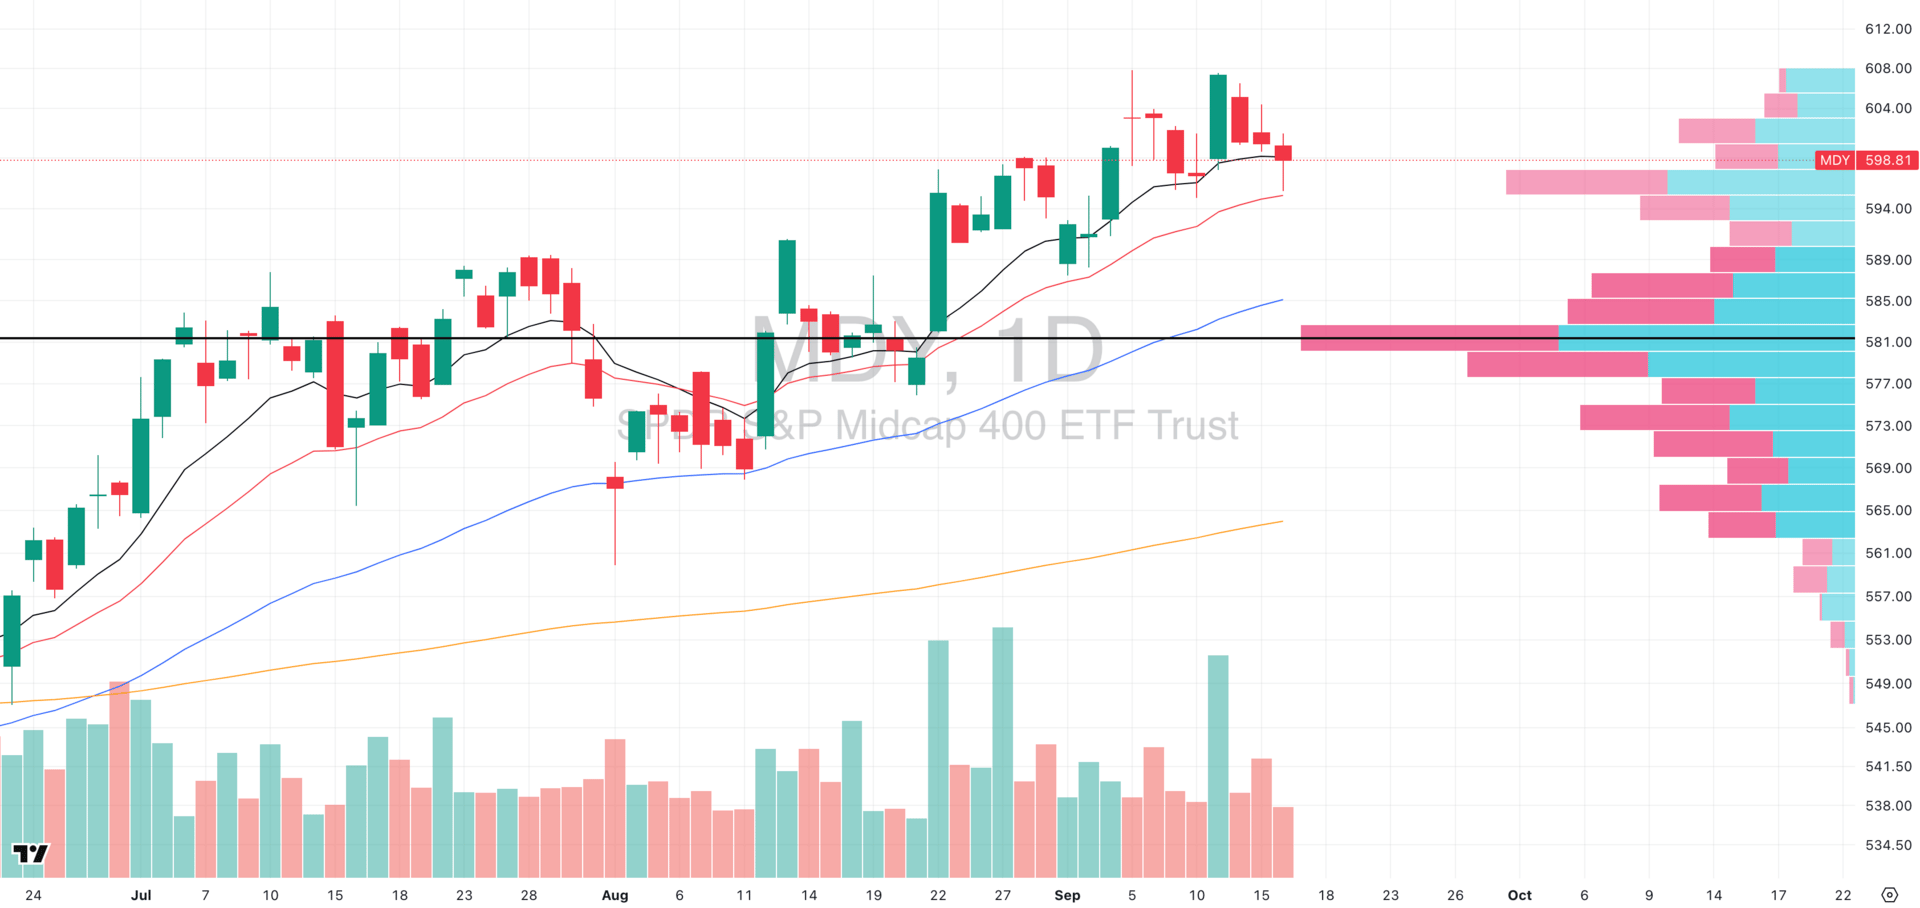
MDY VRVP Daily Chart
% over 20 EMA: 42.10% | % over 50 EMA: 59.14% | % over 200 EMA: 61.40%
Midcaps are playing out almost exactly as we mapped. The daily red doji looks like weakness at first glance, but context is everything: it came on low relative volume, right at the rising 20-day EMA.
That’s the demand zone we flagged in premarket in our earlier reports and price respected it cleanly.
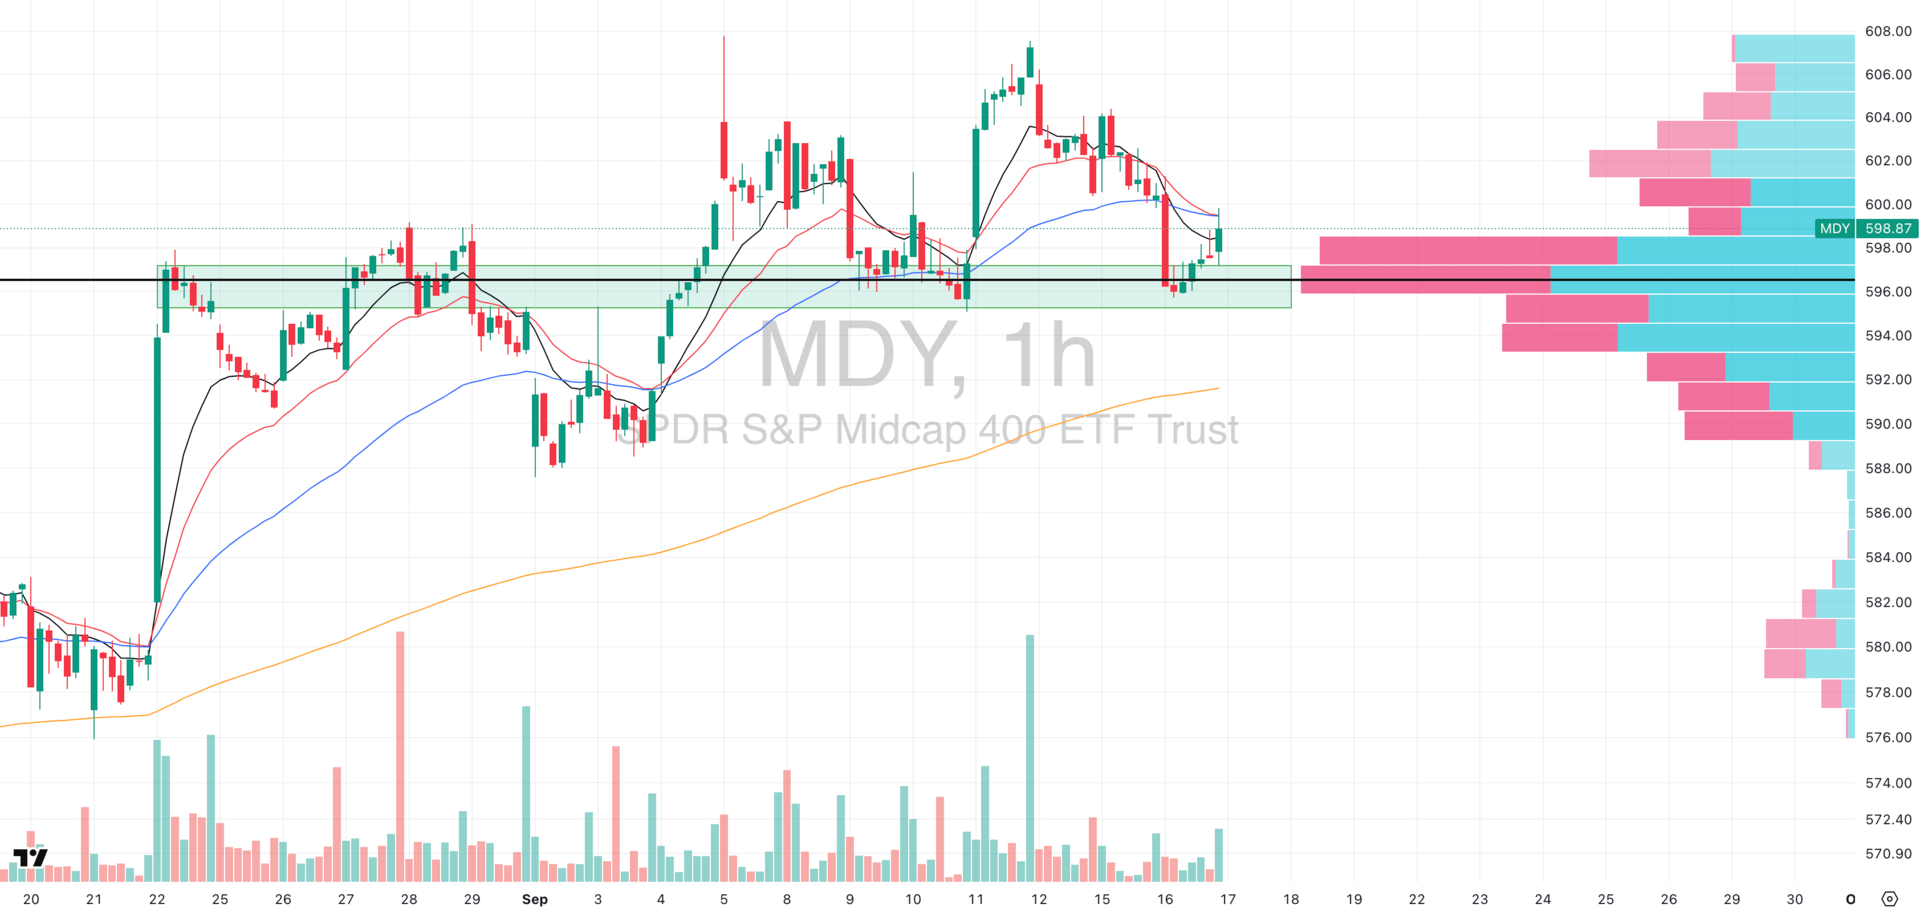
MDY VRVP Hourly Chart
Zooming into the hourly, you can see why this matters: the same $595–596 zone that acted as a brick wall in late August has now flipped into a buyable floor. That kind of resistance-to-support rotation is what defines whether a move has institutional sponsorship behind it. The repeated touches without breakdown confirm that big money is stepping in.
From a game-theory perspective, this sets up asymmetrically. The supply overhead thins out dramatically above $599 on the VRVP. That means buyers don’t need to do much to push higher, but shorts leaning on yesterday’s doji are in a poor risk/reward position. If the tape confirms with follow-through, their covering provides fuel.
Volume profile on the hourly also works in favor of bulls as there’s very little overhead supply sitting above $599. With the demand zone below confirmed and limited resistance above, MDY’s technical setup tilts bullish into the rate decision backdrop.
This must be taken with a grain of salt as Powell on hawkish comments can flip this.
Russell 2000
IWM VRVP Daily Chart
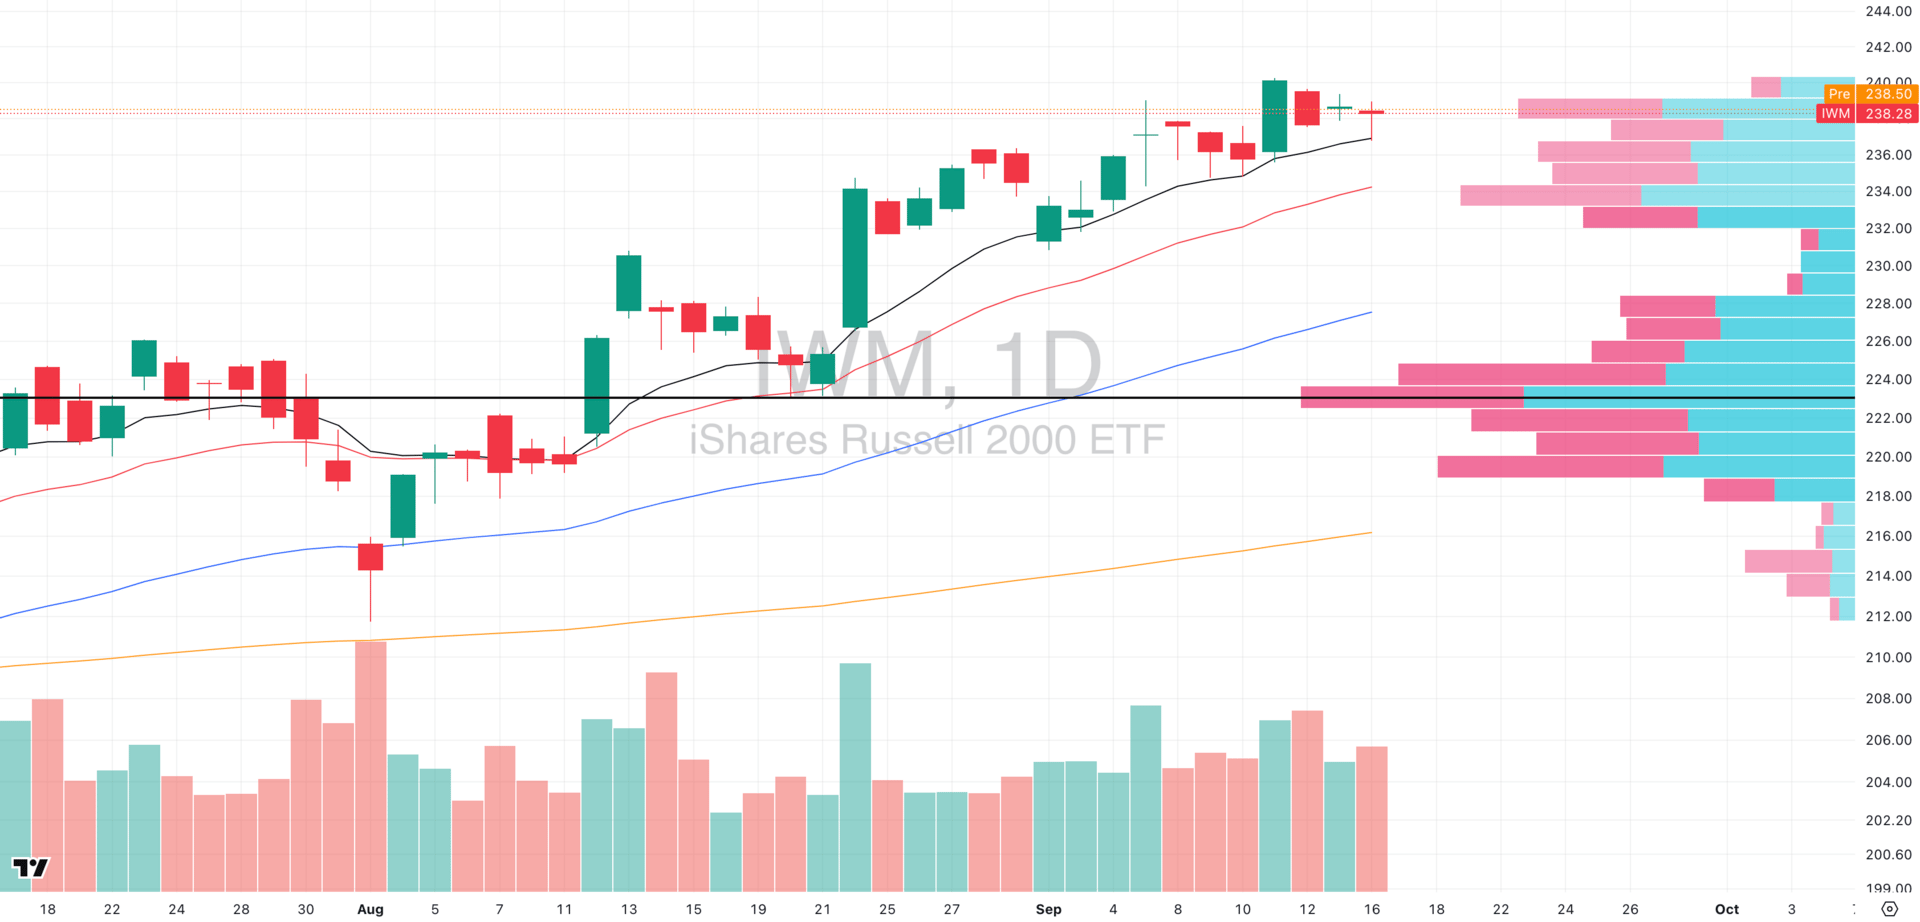
% over 20 EMA: 51.69% | % over 50 EMA: 62.34% | % over 200 EMA: 59.78%
Compared to midcaps, IWM is carrying more momentum. On the daily, the bounce off the rising 10-EMA looked powerful because of the high relative volume confirmation.
But the micro-structure tells a more nuanced story: the move was partly a low-volume drift off the hourly 50-EMA, capped by a high-rel volume green doji rejecting off the $238.50 POC zone.
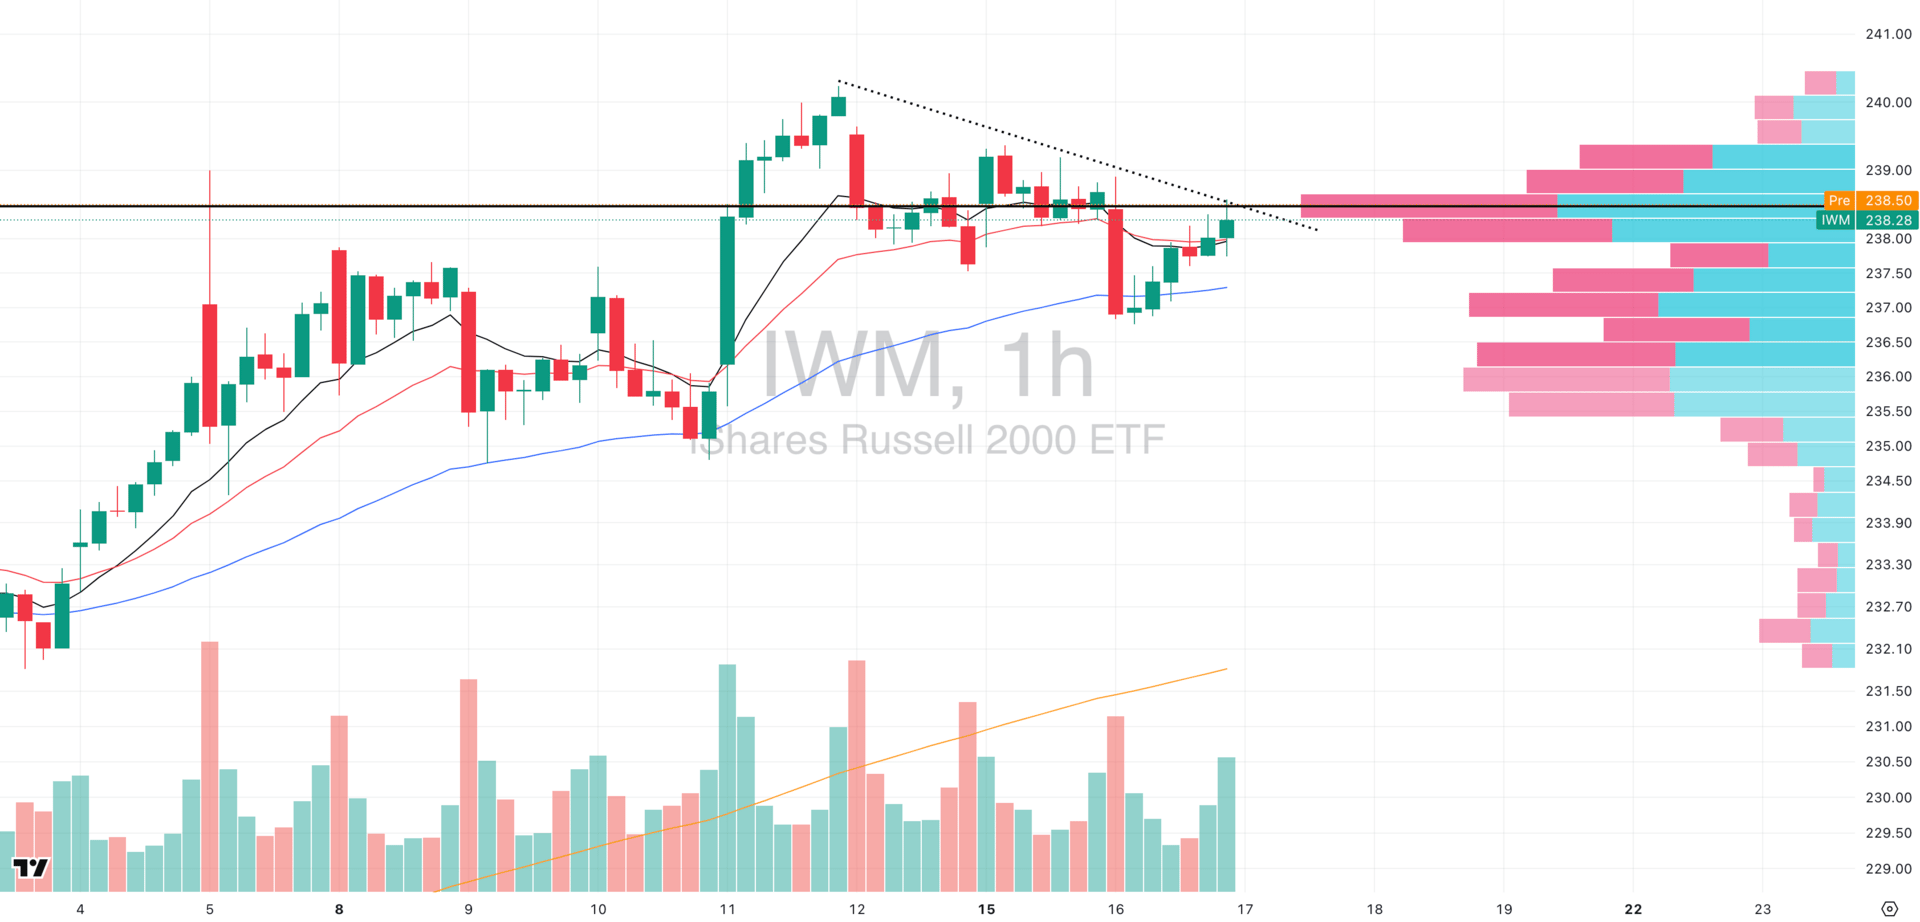
IWM VRVP Hourly Chart
That combo suggests supply is still present, and it raises the probability we see a secondary drift lower into $237. If that plays out, the setup would create a clean double-bottom retest at demand, where the hourly 50-EMA continues to provide structural support.
The takeaway: IWM looks stronger than MDY in terms of sponsorship, but it may need one more flush into $237 before offering the asymmetric long entry.
If buyers step in again at that pocket, it would confirm small caps as the higher-conviction breadth play.
🧠 Mindset Check: Rate Cuts Near Highs
The instinctive retail narrative is that a rate cut near highs is “too late.” History says otherwise. Since 1980, there have been 22 instances of Fed cuts within 2% of ATHs and 11 full rate-cut cycles. The forward return profile is strikingly asymmetric:
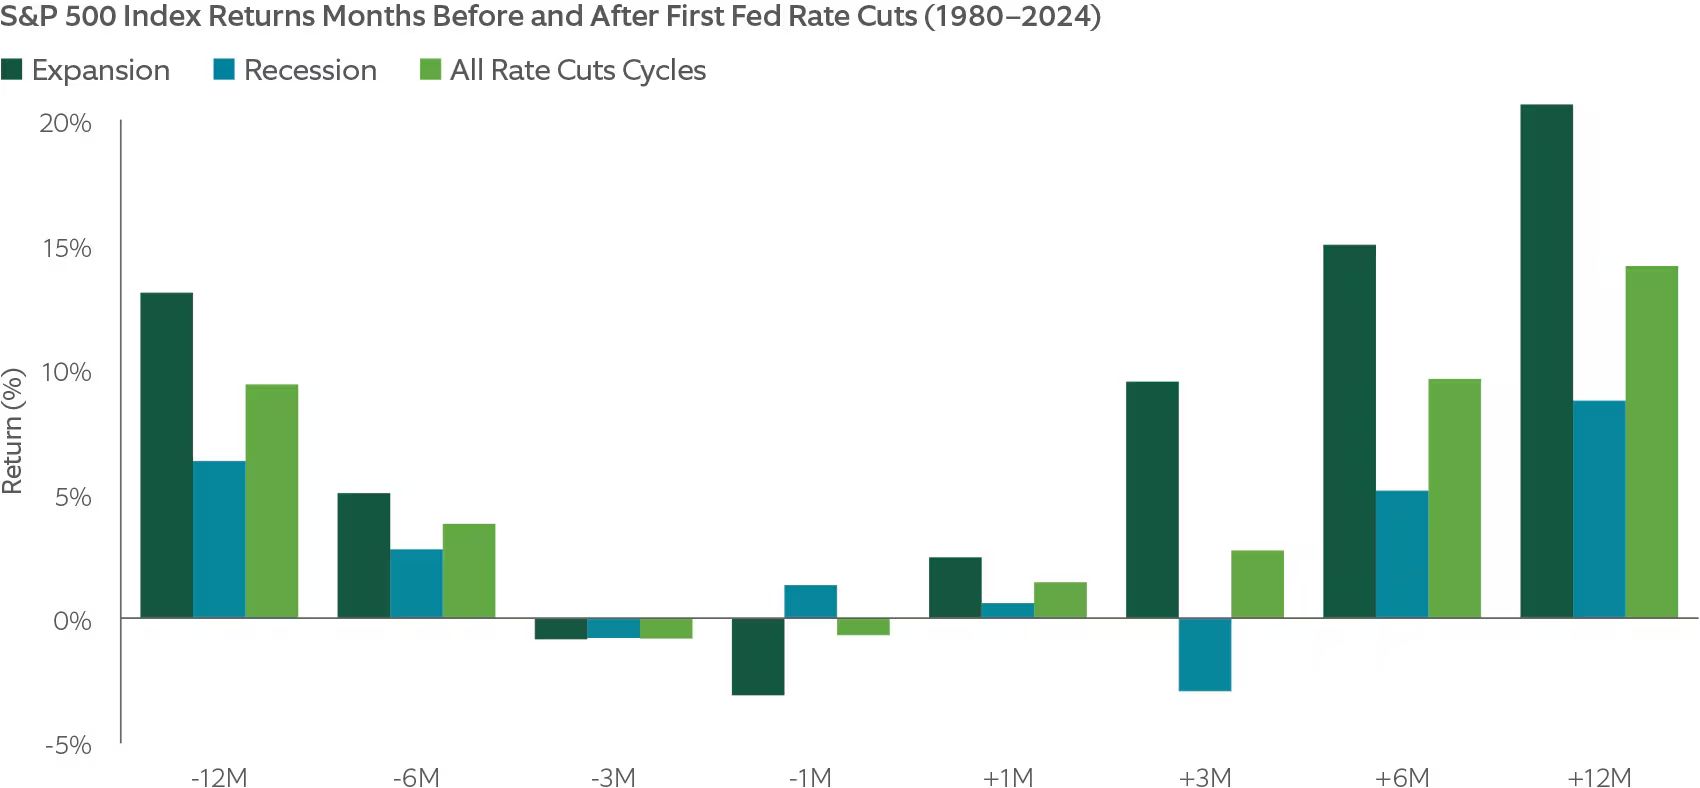
Credit: Northern Trust Asset Management
S&P 500: +9.8% avg. 12m forward when cuts occur near highs, positive in 100% of cases.
Across full cycles: +14.1% avg. 12m forward.
Non-recessionary cuts: +20.6% avg. 12m forward, positive in every instance.
Even recessionary cycles ultimately skew positive, with gains in 3 of 6 scenarios.
The structural implication is that rate cuts have historically always been pro-cyclical, not late-cycle exhaustion signals.
Credit: Northern Trust Asset Management
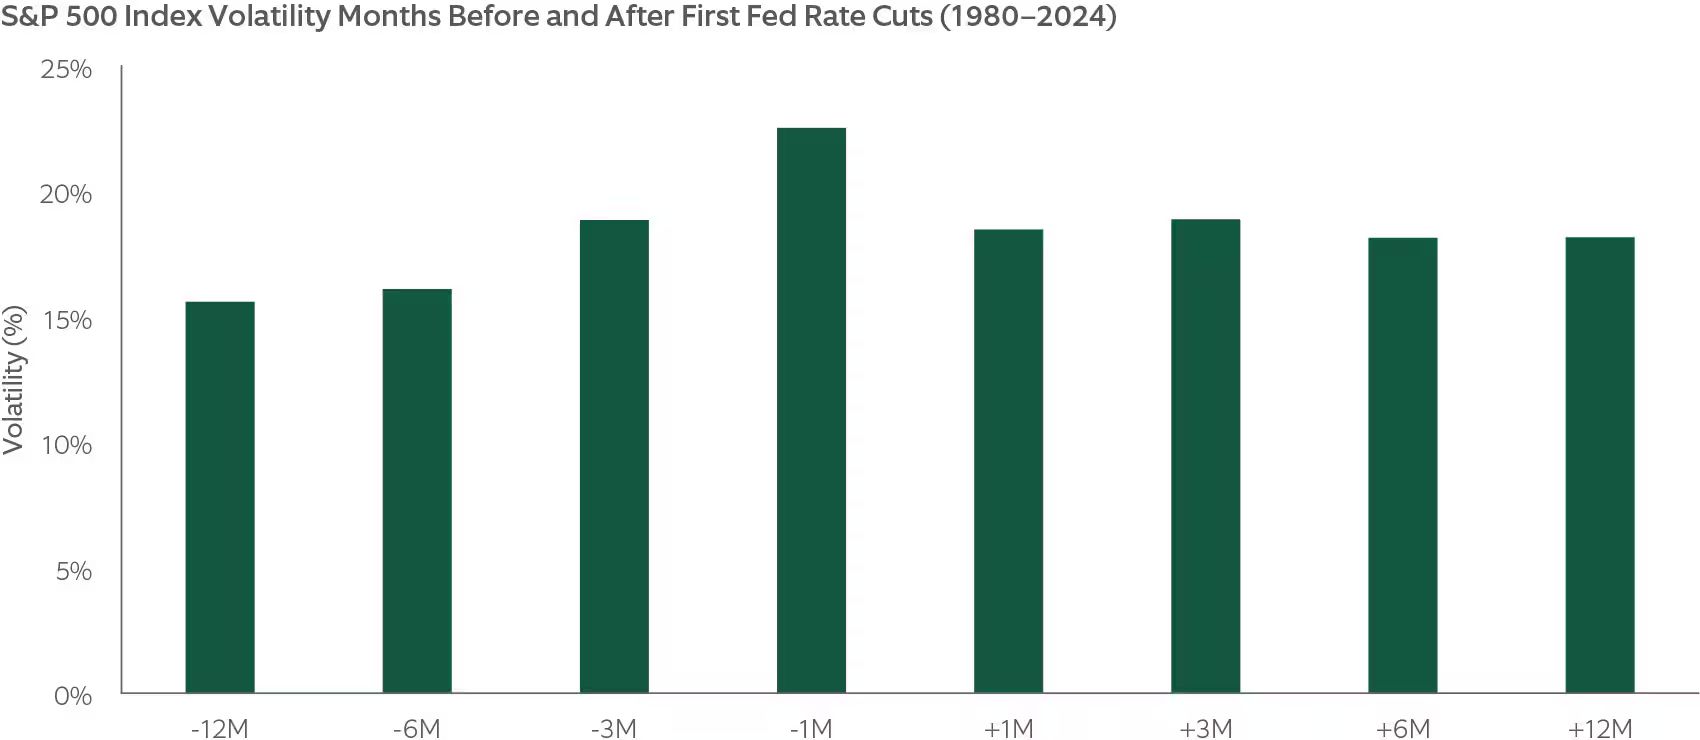
The constraint lies in the path, not the destination. Volatility has consistently re-rated higher around inflection points: realized vol averaged 22.5% in the month preceding first cuts vs ~15% long-term trend, and remained elevated a full year post-initiation.
This reflects regime transition rather than trend reversal as liquidity conditions evolve, sector leadership rotates, and factor performance disperses.
Credit: Northern Trust Asset Management
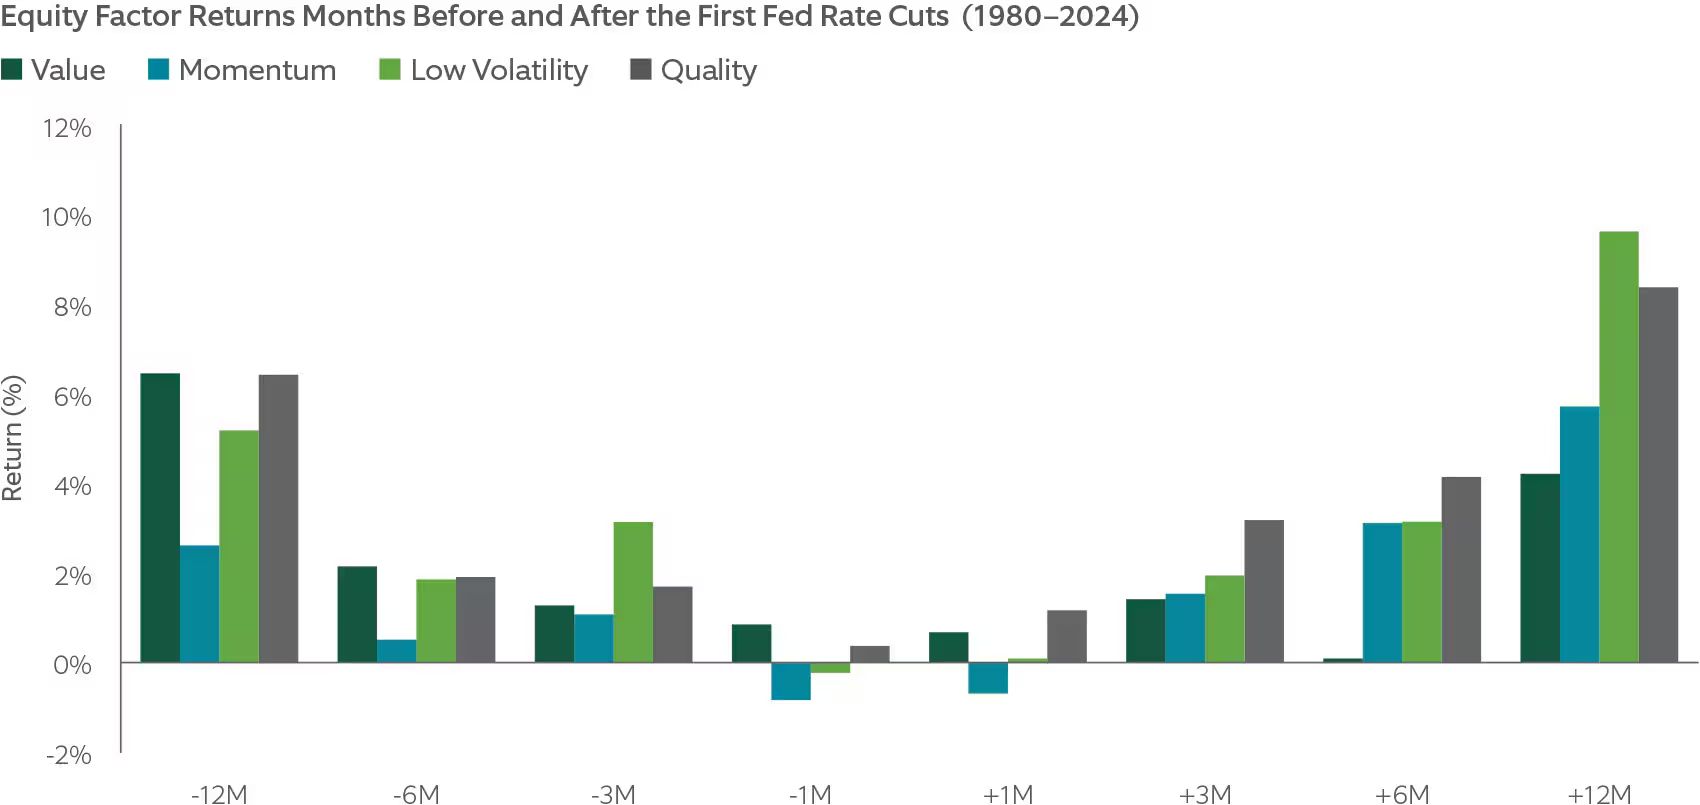
Factor history is equally instructive. Quality (strong earnings & revenue growth stocks) is the most reliable outperformer across cut cycles. Momentum and value stocks tend to follow, though dispersion rises sharply depending on whether the cycle resolves in expansion (1998) or contraction (2001).
Notably, low-volatility factors can materially underperform in bubble inflations before reverting strongly in unwind phases.
Expect noise to expand: whipsaws, false breakdowns, and outsized factor dispersion are not anomalies; they are the regime.
Survival > prediction: edge accrues not to timing the first 2% swing, but to maintaining positioning through the 12m structural drift that is likely to occur.
Factor discipline matters: in cut regimes, owning quality and momentum leadership has been the consistent asymmetry
Questions You Should Be Asking
1. Leadership Alignment
Am I concentrated in the true generals of this tape (mega-cap tech, semis, quality growth), or wasting risk on second-tier laggards that rarely lead post-cut?
If sponsorship is committing capital, is it flowing into my book or past me?
2. Breadth Reality Check
Which sectors are not just breaking out, but holding gains on volume?
Where have reversals exposed weak hands, and am I positioned in those traps?
3. Factor Exposure
Do I own names with balance sheets and secular growth strong enough to carry through a higher-vol regime?
Am I exposed to thinly traded names that will get punished when vol spikes and liquidity disappears?
4. Risk Discipline
If realized vol jumps 25–30% after the Fed, where do my stops trigger, and can my P&L absorb it?
Is my size set for pre-event chop, or am I effectively gambling on the headline?
5. Positioning
Where is the crowd already maxed out (the obvious growth darlings)?
If positioning rotates, which groups stand to benefit (industrials, small caps, cyclicals), and do I have a plan to pivot?
Where the smartest investors start their day
The Alternative Investing Report (A.I.R.) helps you get smarter on alternative assets from crypto treasury companies to Pre-IPO venture secondaries to private credit and more.
Join 100,000+ investors to get the latest insights and trends driving private markets, a weekly investment pick from a notable investor, and bonus offers to join top private market platforms and managers. And it’s totally free.
FOCUSED STOCK
SY: A Big Move Is Brewing
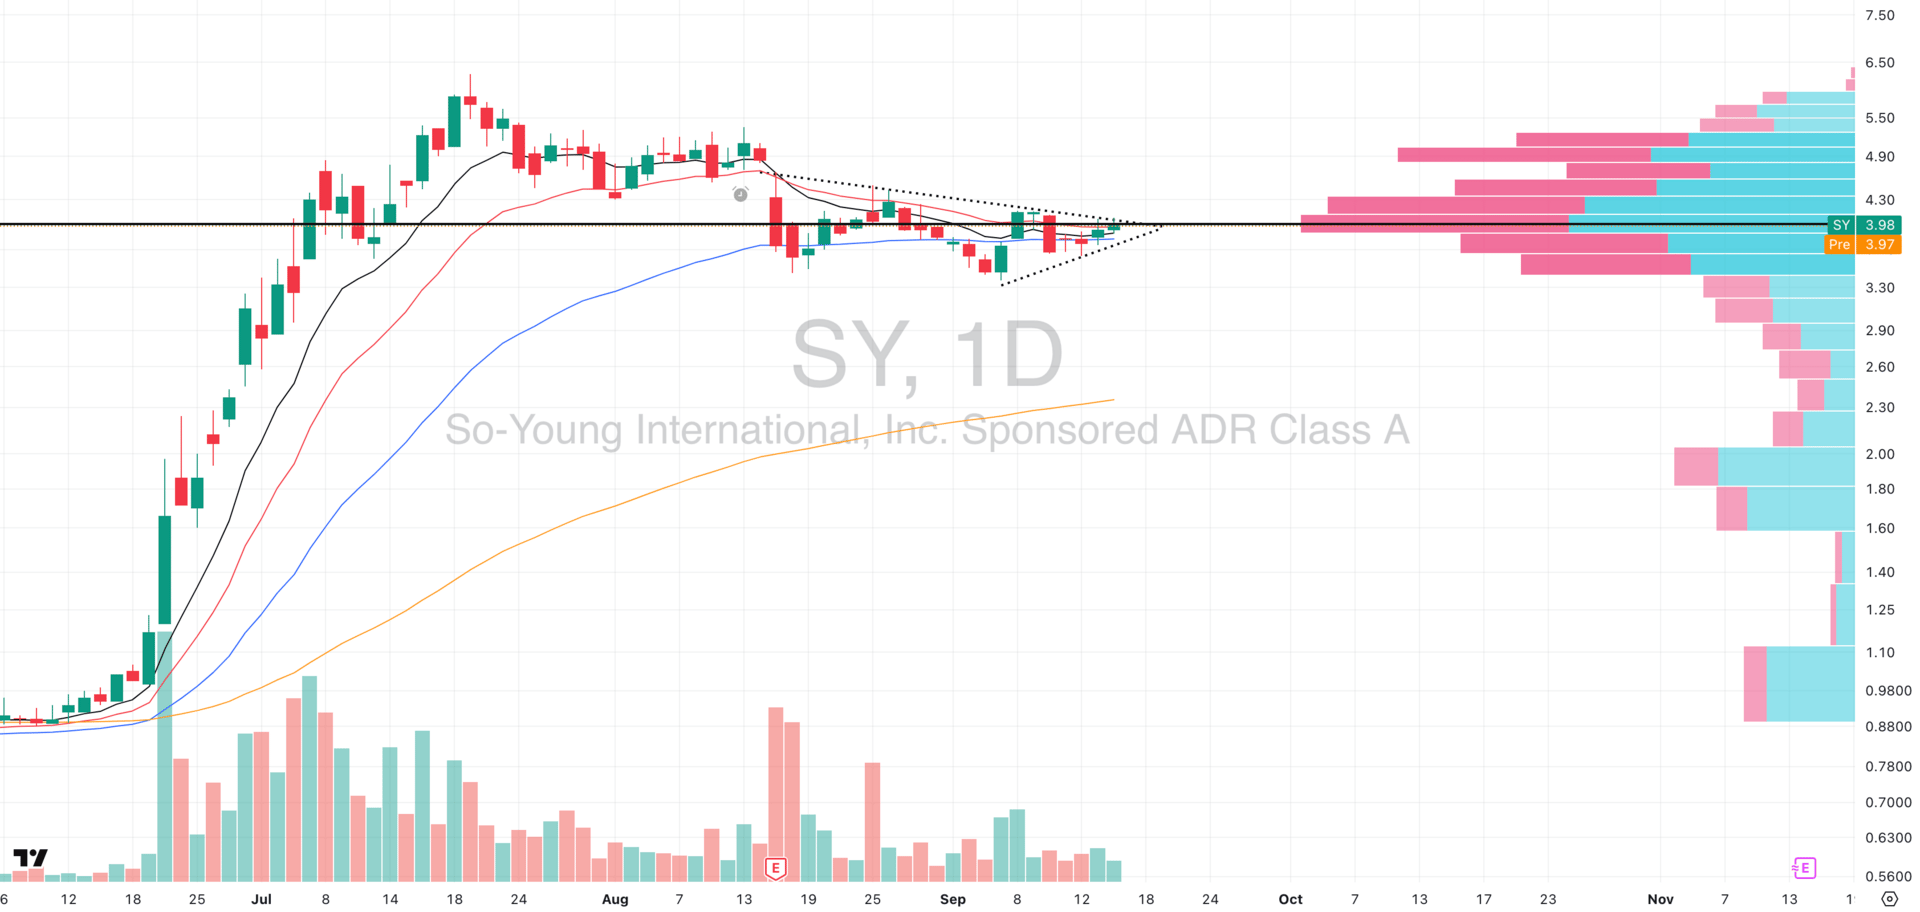
SY VRVP Daily Chart
ADR%: 8.06% | Off 52-week high: -36.6% | Above 52-week low: +516.2%
SY is showing exceptional relative strength, sitting at 99% vs the S&P 500, and the chart structure backs it up.
Over the last two months, price has been coiling into a powerful Volatility Contraction Pattern (VCP).
Each pullback has been shallower than the last, with the latest two weeks carving out a series of higher lows on low relative volume which is exactly what you want to see during constructive digestion.
Price is now pressing tight against the daily Point of Control (POC) around $4, while also riding support from the 50-day EMA. This combination with higher lows, low-volume contractions, and proximity to a major volume shelf creates the type of asymmetric setup where expansion can happen violently once supply clears.
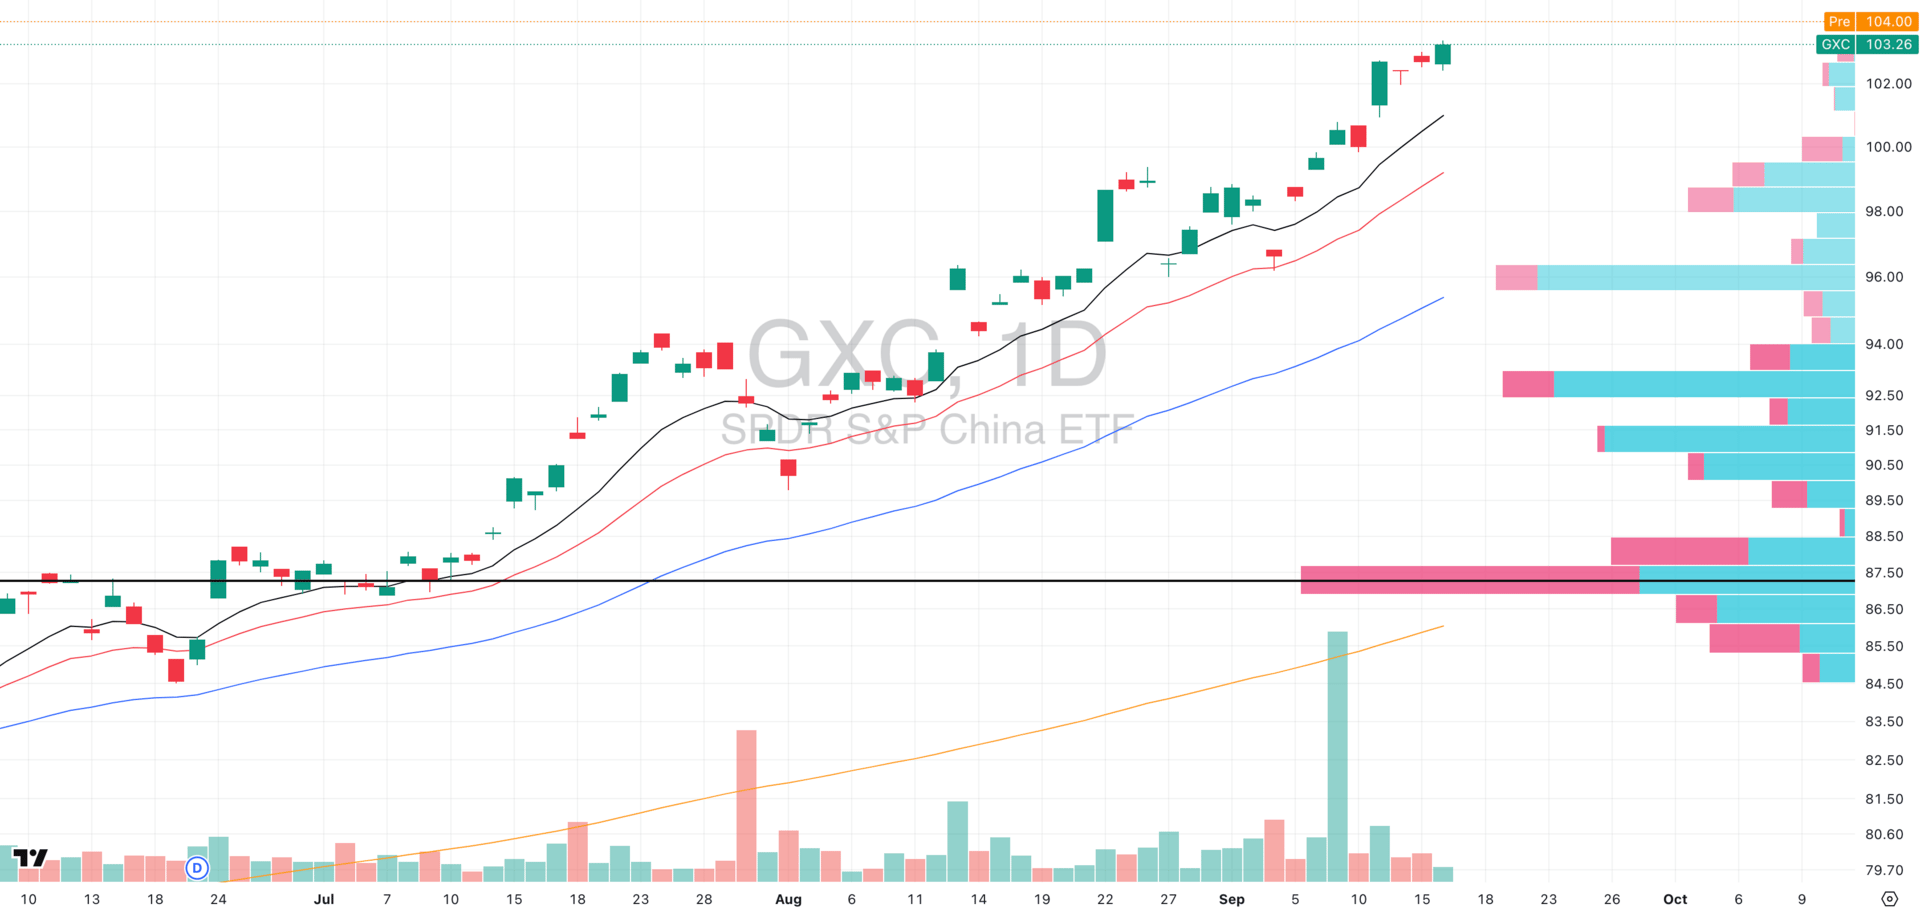
GXC VRVP Daily Chart
It’s not just the chart. SY belongs to the China equities group, which has been one of the strongest global segments in 2025.
With GXC and other China-related plays (think stocks like XPEV, BABA, etc) are already extended in trend, SY looks like one of the more attractive second-leg opportunities, sitting right under resistance with clear structural support below.
FOCUSED GROUP
QTUM: The Strongest Growth Segment
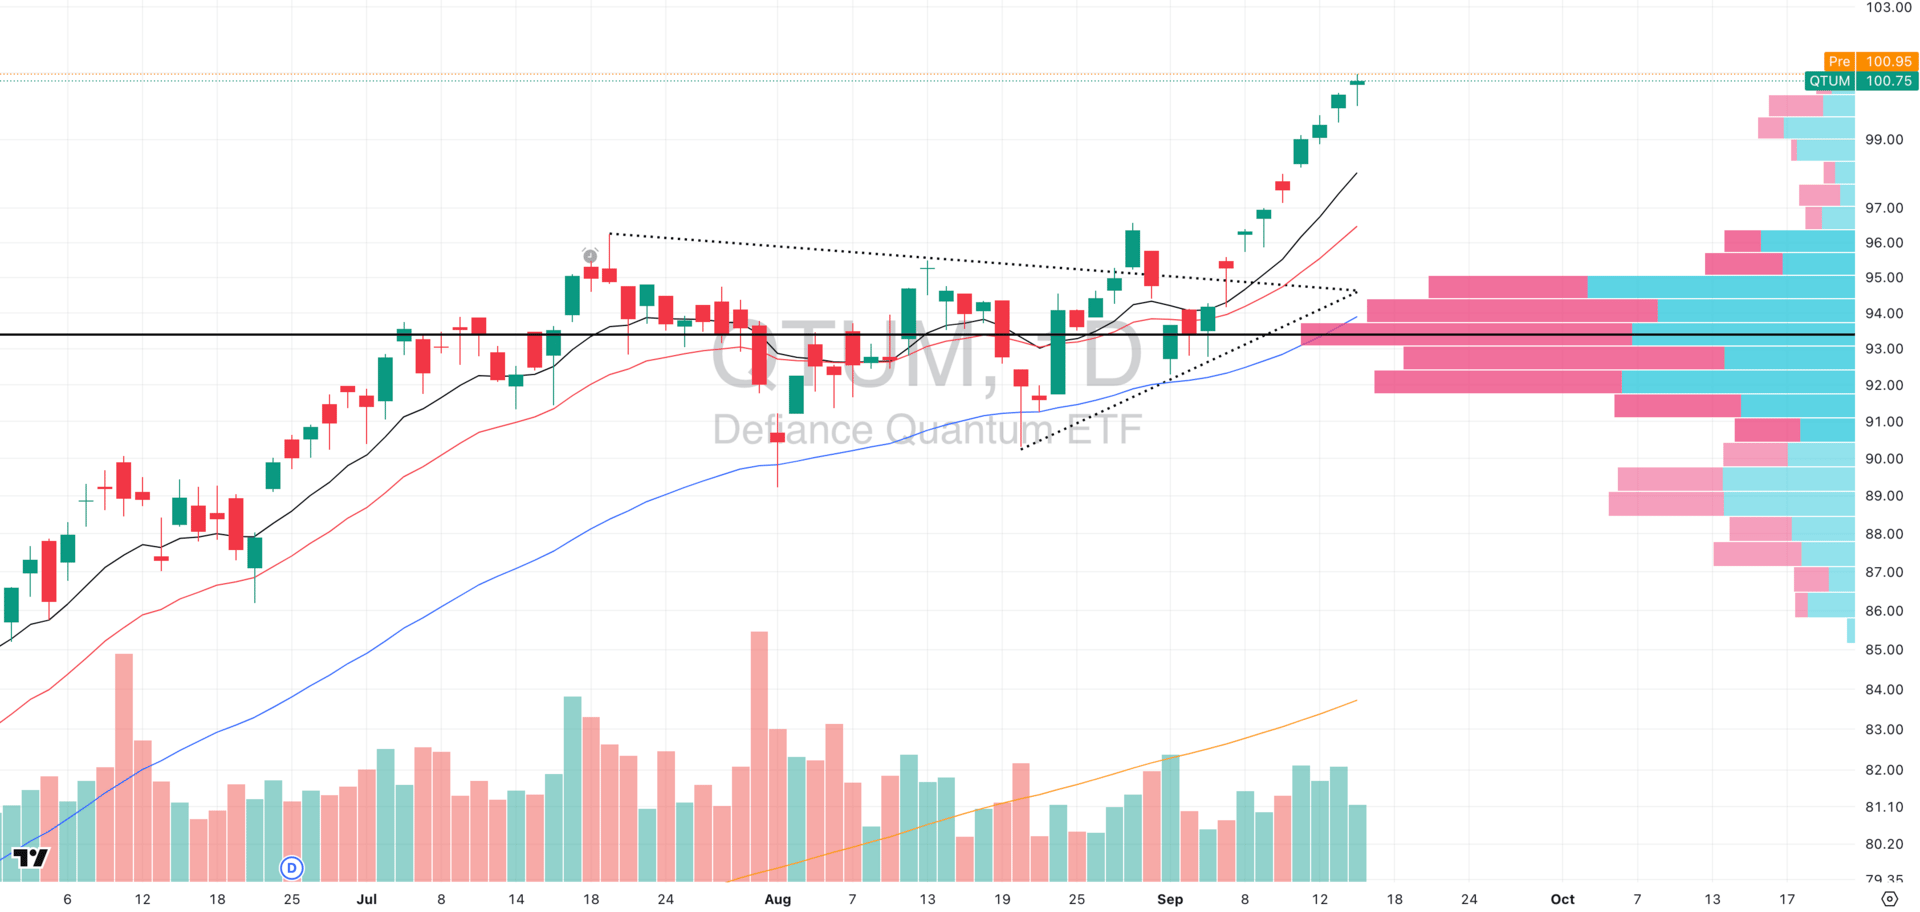
QTUM VRVP Daily Chart
We’ve been pounding the table on QTUM for weeks, and it’s now clear:
This is the #1 group in U.S. equities right now.
For those who’ve been following our reports consistently, you know we’ve been tracking the breadth and accumulation across this theme closely. The last week has validated that work as QTUM has gone almost straight up, and the move has been nothing short of impressive.
That said, let’s be clear about near-term dynamics. Yesterday’s session came on low relative volume, which means it wouldn’t take much selling pressure to trigger a short-term pullback. No asset goes vertical forever without some mean reversion, so don’t be surprised if you see some cooling in the next few sessions. That’s not bearish — it’s just the natural rhythm of trend.
The real reason QTUM is our highest-conviction call is breadth. Leadership isn’t about one or two names dragging a group higher, it’s about participation. And in QTUM, we’ve seen broad, powerful follow-through across multiple stocks, confirming this isn’t a narrow story.
We’re highlighting below our top 3 names within the segment to illustrate just how widespread this strength has become:
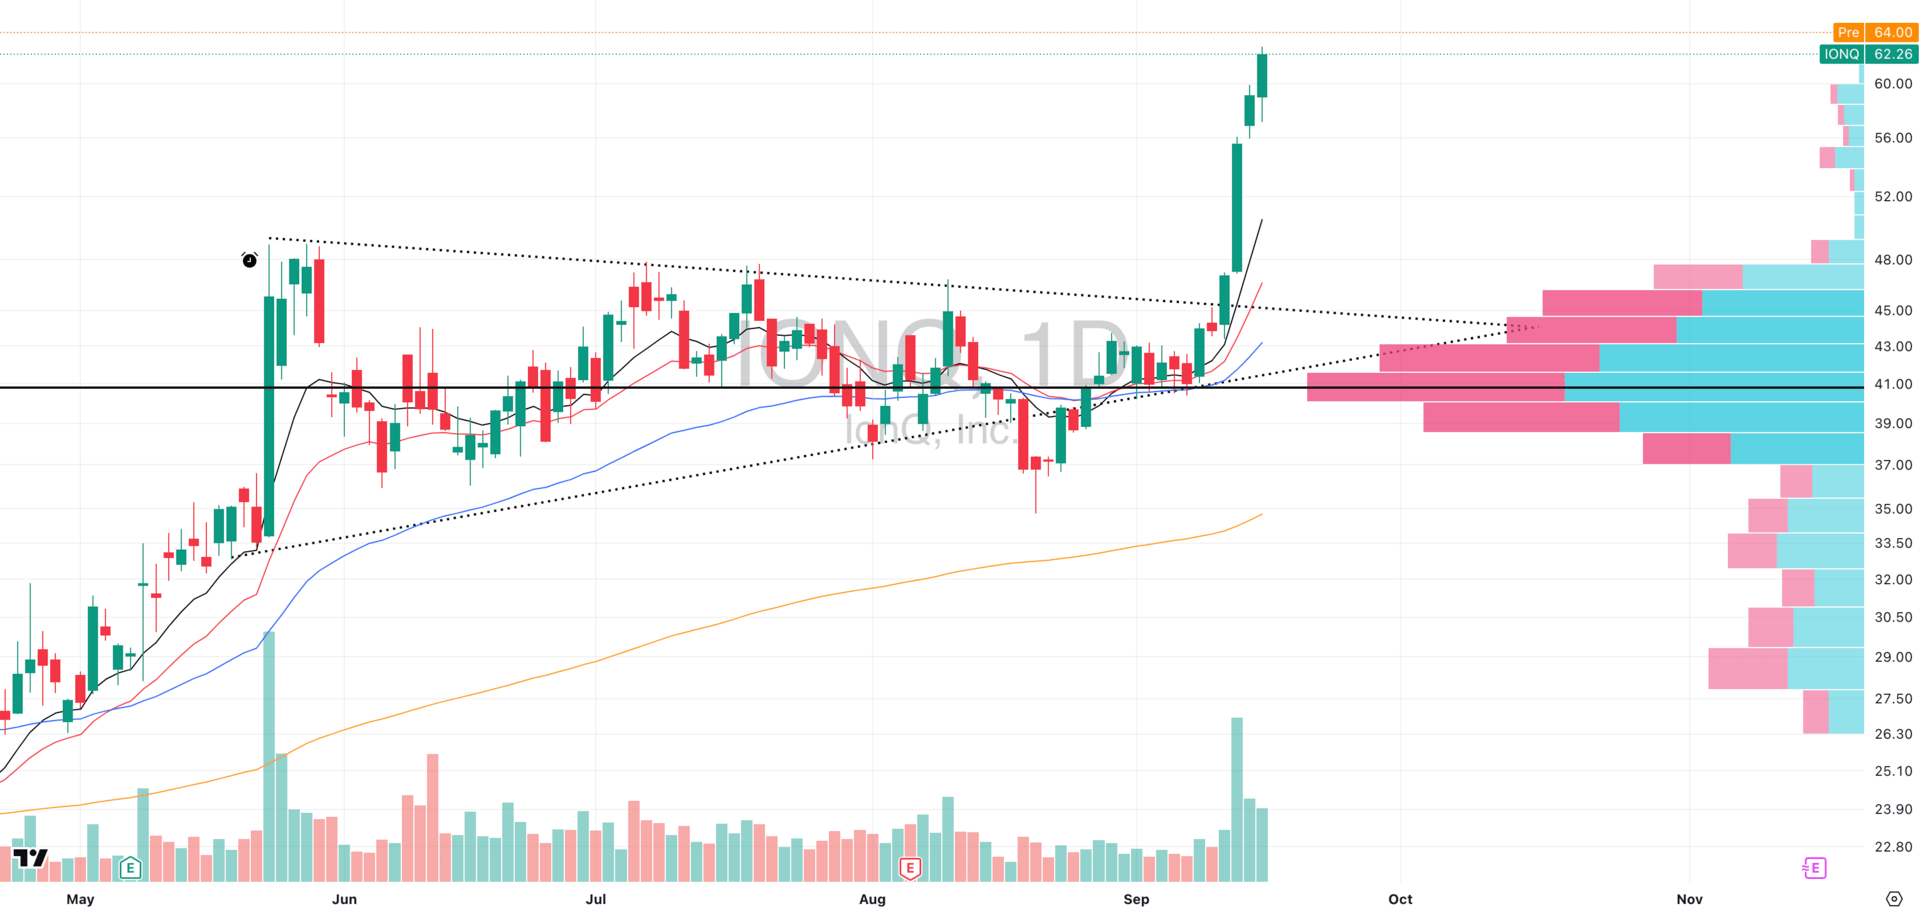
IONQ VRVP Daily Chart
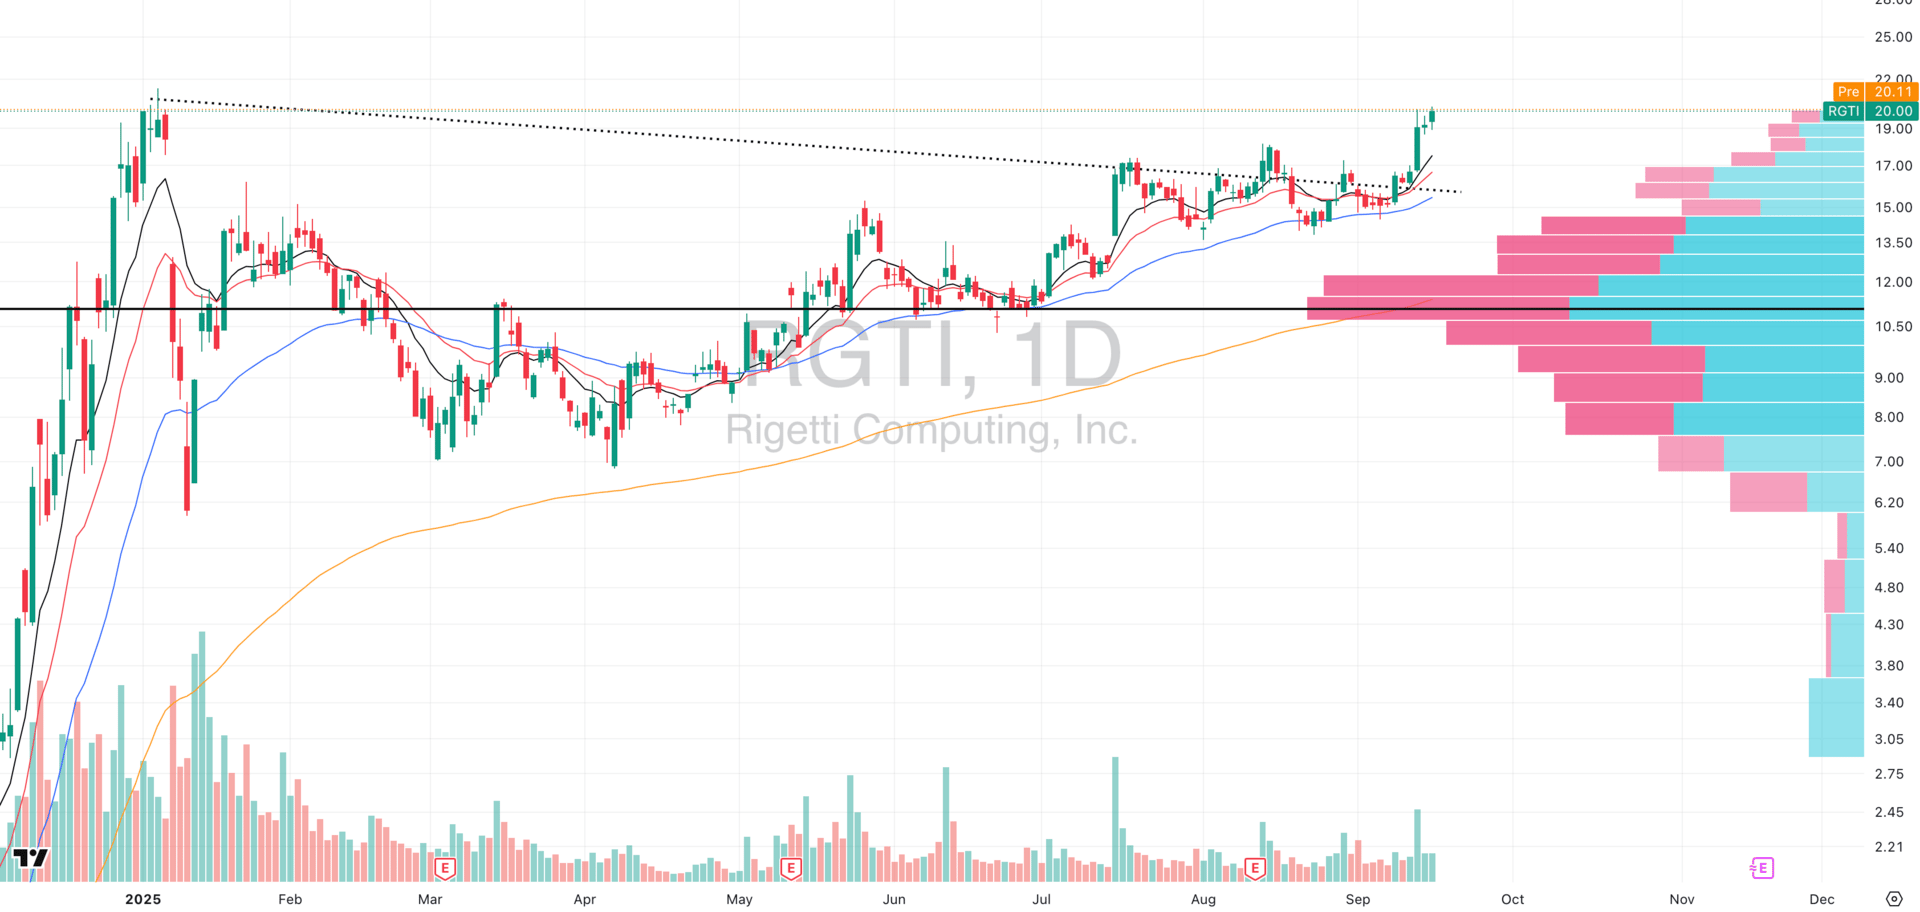
RGTI VRVP Daily Chart
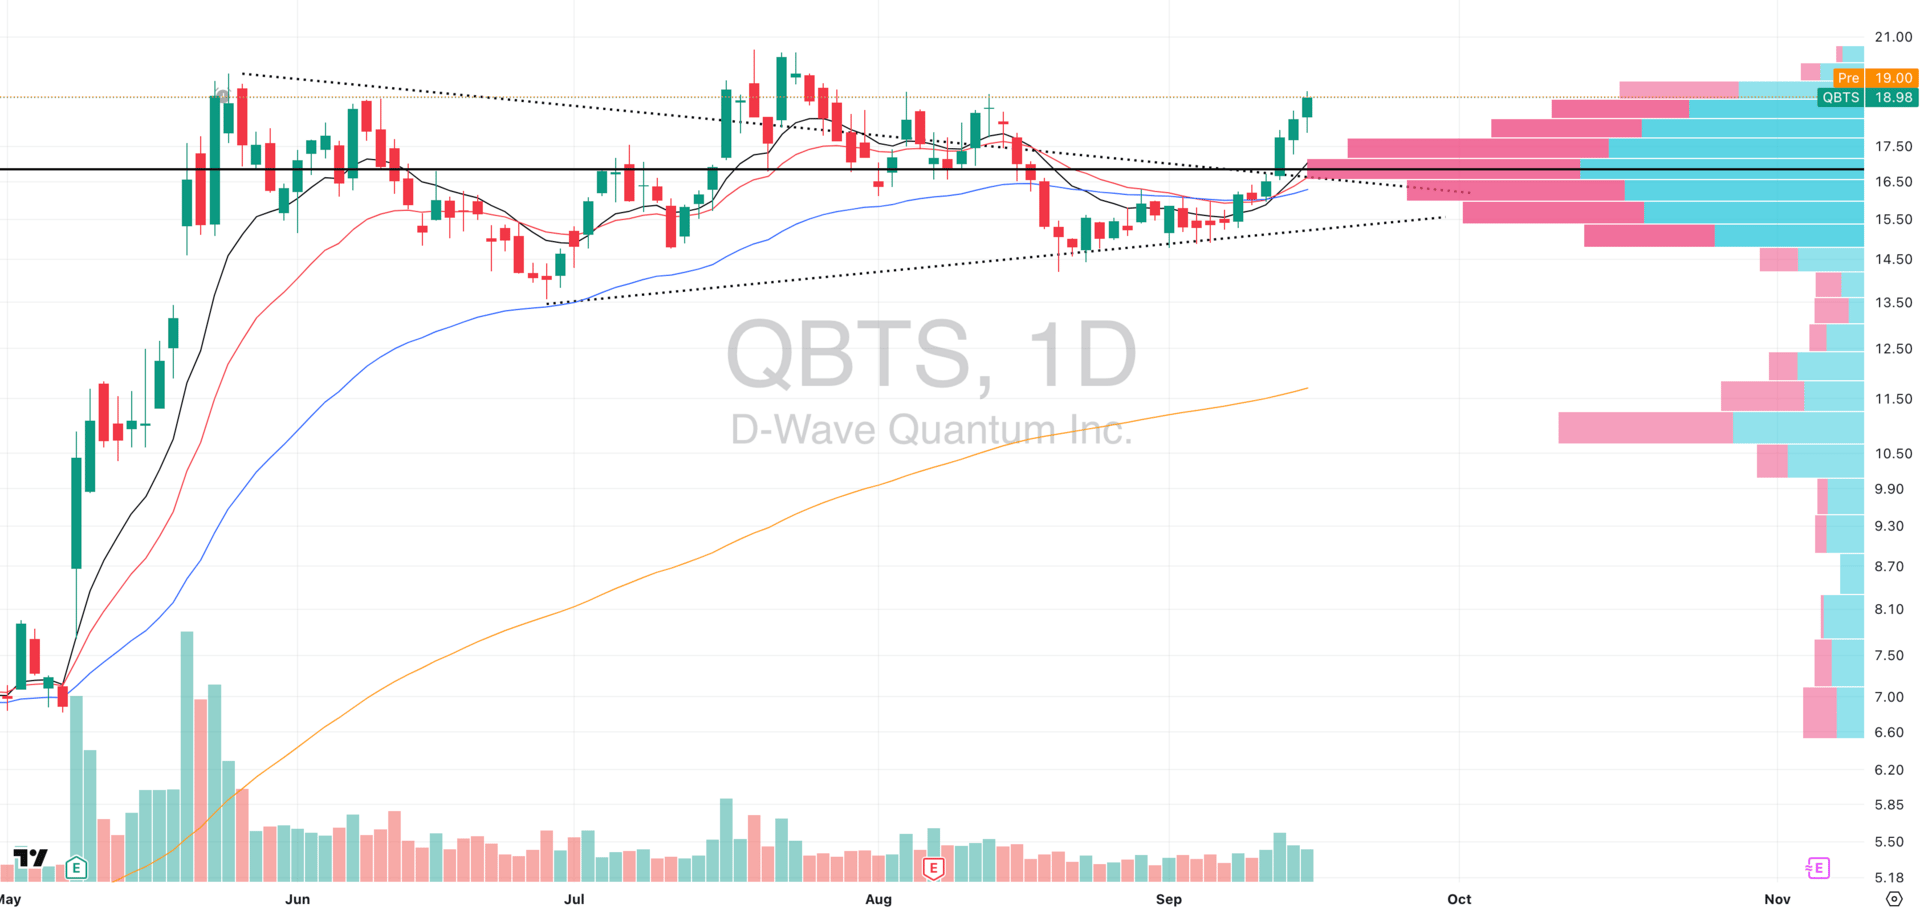
QBTS VRVP Daily Chart
This is the edge Swingly Pro gives you every single day. While most traders are reacting after the fact, our members already know the leading stocks and leading groups before the big moves happen.
That’s why they’re positioned with conviction when breakouts like this hit.
And the best part is you can try Swingly Pro completely risk-free for 2 weeks.
If it’s not the most valuable trading resource you’ve ever used, you’ll get a full refund…no questions asked.

Did you find value in today's publication?This helps us better design our content for our readers |
Reply