- Swingly
- Posts
- Oil Back Above $100. Markets Face Another Key Test Today
Oil Back Above $100. Markets Face Another Key Test Today

MARKET ANALYSIS
Here’s All You Need To Know

U.S. equity futures are softer this morning after Monday’s relief rally, with markets pausing as investors reassess whether the latest Middle East headlines genuinely represent de-escalation or simply another short-lived repricing of geopolitical risk.
Yesterday’s move higher was driven by President Trump’s comments suggesting “productive” communication with Iran, which triggered an aggressive reversal in risk assets as traders quickly priced a lower immediate probability of disruption through the Strait of Hormuz.
That optimism has already moderated. Iranian officials publicly denied direct negotiations, while military activity in the region continues, leaving markets caught between diplomatic headlines and unresolved battlefield realities.
The key macro variable remains oil. Brent has moved back above $100 and WTI is again trading north of $90, reinforcing that energy markets still assign meaningful probability to further supply disruption despite Monday’s sharp retracement.
At this stage, equities are effectively trading as a derivative of crude volatility: when oil cools, index futures stabilize; when oil reaccelerates, inflation sensitivity immediately returns to the surface.
Treasury yields are edging higher again, with the U.S. 10-year back above 4.36%, reflecting renewed concern that any prolonged energy shock could complicate the Federal Reserve’s path, particularly with inflation still not fully normalized.
Powell’s latest communication suggests the Fed is not reacting mechanically to oil, but duration of the shock matters. A temporary geopolitical spike can be absorbed; a sustained move higher in energy would risk feeding directly into inflation expectations and consumer behavior.
Gold’s continued weakness is notable. In a textbook geopolitical panic, bullion would normally attract defensive inflows, yet instead we are seeing liquidation pressure as investors prioritize dollar liquidity and rate-sensitive positioning.
That divergence matters because it suggests this is not a broad systemic fear trade yet — it is a highly concentrated repricing around energy, inflation, and near-term policy uncertainty.
Underneath the index level, leadership continues to narrow toward hard AI infrastructure. Memory and storage names remain structurally strong as hyperscaler capex continues to flow into physical data center buildout rather than software-heavy beta.
This reinforces an important shift inside technology leadership: capital is rotating toward companies with pricing power tied to physical AI bottlenecks, where demand remains less cyclical and less vulnerable to valuation compression than the larger mega-cap complex.
Meanwhile, renewed instability in the Gulf is beginning to alter infrastructure expectations globally, with fresh concerns emerging around data center deployment across the Middle East after operational disruptions in Bahrain.
That may increasingly support U.S.-based infrastructure beneficiaries if hyperscale buildout is forced back toward politically stable regions.
Credit markets also deserve attention this morning after Apollo limited withdrawals in one of its private credit vehicles, a reminder that liquidity mismatches inside alternative credit remain a latent macro vulnerability if volatility persists.
For now, the broader market is still behaving like a tactical correction rather than a structural breakdown, but the path forward remains highly dependent on whether oil stabilizes or starts forcing a second wave of inflation repricing.
The immediate focus today shifts toward U.S. manufacturing data, where investors will look for confirmation that underlying growth remains resilient enough to absorb tighter financial conditions without reigniting inflation fears.
Nasdaq
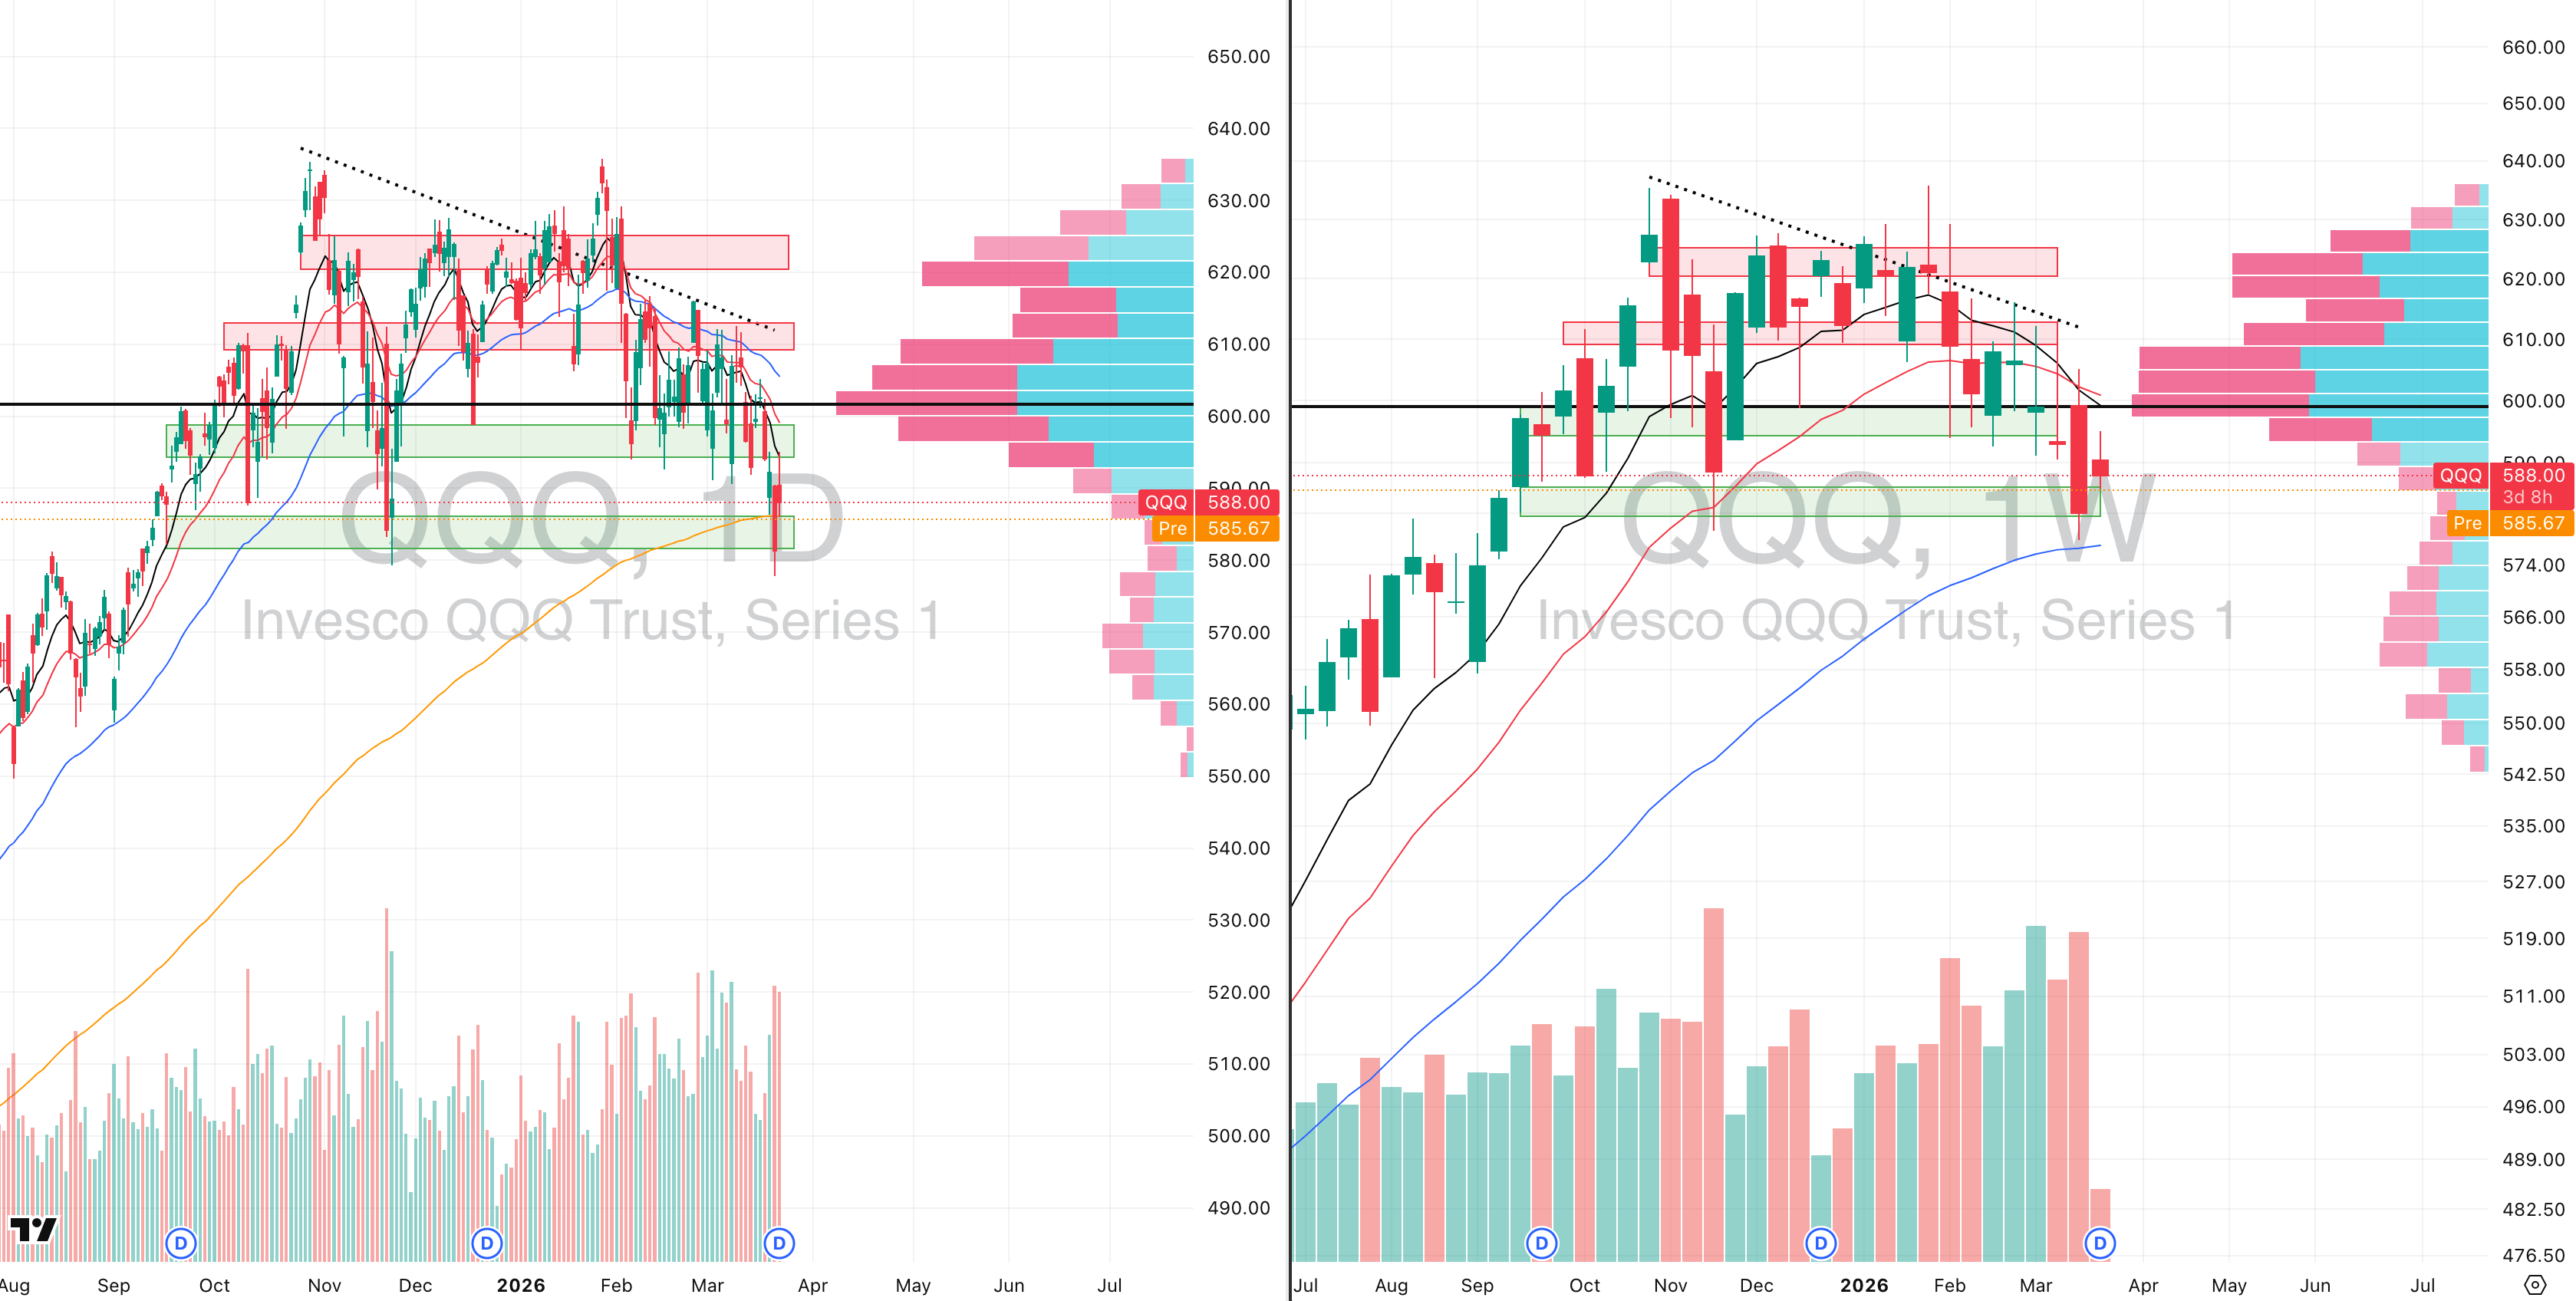
QQQ VRVP Daily & Weekly Chart
23.76%: over 20 EMA | 20.79%: over 50 EMA | 40.59%: over 200 EMA
We outlined this in detail yesterday, but the gap-up open was never something to trust. It had all the characteristics of a low-quality relief bounce rather than the start of a sustainable reversal, particularly given the broader market backdrop and the location of the move within the current structure.
That is exactly what played out. Price pushed back up into the prior demand zone around $595, but that level had already lost its supportive character. What had previously acted as demand now turned into supply, especially with the declining 10-day EMA reinforcing the same area as overhead resistance.
The rejection from that zone was meaningful. It came on roughly 135% of already elevated 20-day average volume, which tells you this was not just random drift lower intraday. There was real participation behind the failure, and that matters when you are trying to judge whether a move is just noise or the beginning of another impulse leg down.
From a tactical perspective, yesterday delivered the exact trade we expected: a failed gap-up, rejection into overhead supply, and a downside move that began working to fill the opening gap almost immediately. That kind of behavior is typically not what you see when institutions are using weakness to build fresh exposure.
Pre-market, we are once again seeing renewed weakness, and at this point we largely view that as the likely start of the next impulse lower rather than a standalone dip. The next key downside objective sits near $577, which lines up with the rising 50-week EMA and would also represent an undercut of the 200-day EMA.
From yesterday’s highs, that implies roughly -1.97% downside, and structurally that would make sense as the next logical test area if this rejection sequence continues to develop.
Unless QQQ can quickly reclaim the failed breakout area and prove that yesterday’s rejection was a false move, the path of least resistance here still looks lower in the near term.
S&P 400 Midcap

MDY VRVP Daily & Weekly Chart
22.00%: over 20 EMA | 23.25%: over 50 EMA | 44.50%: over 200 EMA
MDY delivered an even more aggressive failure yesterday, which is exactly what we were looking for. Rather than holding the gap and building constructively, price reversed lower with real force and confirmed that the prior bounce lacked durability.
The rejection came on roughly 200% relative volume, which is significant in its own right, but even more so when paired with the size of the move. MDY closed down more than 2.05% on the session, which is materially larger than its 1.72% 20-day ADR. That is important because when an ETF is moving well beyond its normal daily travel range on heavy volume, it is usually telling you that the move is being driven by meaningful institutional activity rather than routine back-and-fill.
In other words, this was not just a weak close. It was a proper downside expansion day, and it strongly supports the view that yesterday’s expected continuation lower is now actively underway.
Structurally, the bigger picture is still interesting because the weekly chart continues to resemble an inverse head-and-shoulders formation. But in the short term, that pattern is not actionable unless price can actually reclaim the key moving averages and begin building above them.
Instead, what we saw yesterday was a rejection directly into the declining 10-week and 20-week EMAs on the weekly chart. That is not what you want to see if the market is preparing for a clean upside resolution. It is what you expect to see when overhead resistance is still firmly in control.
At this point, we suspect MDY is likely heading for a deeper retracement, with the most immediate downside level around $602, where the rising 200-day EMA sits. That level also broadly aligns with the 50-week EMA, making it a technically important confluence zone.
From current structure, that would imply at least another -1.81% move lower, and given the character of yesterday’s breakdown, that target looks entirely reasonable unless the ETF can quickly reverse and invalidate the rejection.
Russell 2000

IWM VRVP Daily & Weekly Chart
29.69%: over 20 EMA | 27.03%: over 50 EMA | 47.86%: over 200 EMA
IWM showed essentially the same behavior as both QQQ and MDY, which is exactly what you want to pay attention to from a market character perspective. When weakness is expressing itself across growth, mid-caps, and small-caps simultaneously, that is usually a sign that this is more than just isolated rotation.
Yesterday’s move was another textbook gap-fill short setup, which we had already outlined. Price opened with intraday strength, pushed higher, and then reversed cleanly once it ran into the key resistance cluster near $252.
That area mattered because it marked a rejection into the declining 10-week EMA on the higher timeframe, while also overlapping with the 20-day EMA on the daily chart. Just like in QQQ, that created a highly logical zone for prior support to flip into resistance.
Once that push failed, the intraday reversal became very clear. Rather than holding the opening strength and building above resistance, IWM gave back the move and confirmed that the gap-up was more likely an exhaustion bounce than the start of a real recovery leg.
From here, we continue to expect a move down toward $242, which is where the 200-day EMA and 50-week EMA come into alignment. That makes it the next obvious downside magnet if this rejection continues to follow through.
For now, the burden of proof remains on the bulls. Until IWM can reclaim the failed resistance zone and hold above it, the structure still argues for lower prices rather than immediate stabilization.

Did you find value in today's publication?This helps us better design our content for our readers |
Reply