- Swingly
- Posts
- 🚨 $9T of Earnings Come Today
🚨 $9T of Earnings Come Today
In partnership with
OVERVIEW
What You Need To Know
Macro
S&P 500 and Nasdaq extended higher with NVDA +5% on fresh AI deals; markets await Fed tone and mega-cap earnings.
Powell’s guidance > rate cut itself — traders watching for December cut hints amid limited data flow (shutdown impact).
Nasdaq (QQQ)
Leadership remains dominant: aligned EMAs, strong structure, but crowding risk rising into event-heavy week.
Historical analogues (Aug 2020, Jul 2023) show short-term fatigue often follows overextension into catalysts; trim or tighten stops.
S&P 400 Midcap (MDY)
Filled last week’s gap, confirming mean reversion amid relative weakness vs Nasdaq.
Still structurally constructive above $595 POC, but best play = patience ahead of $9T earnings cluster + FOMC + macro data.
Russell 2000 (IWM)
Range-bound and extended — hasn’t closed below 10W EMA since April, signaling strength but fragility.
Breadth flattening + falling volume = fragile equilibrium; risk of short-term cooling phase, not trend break.
Focused Stock: CRWV (CoreWeave)
Building a six-month IPO base (~35% deep); volatility contraction + flattening EMAs = classic Stage 1 setup.
Watch $145 for breakout trigger — Stage 2 transition likely, but avoid holding large exposure into earnings.
Focused Group: URA (Uranium ETF)
Clean breakout above $52 pivot, defended 10EMA twice with strong institutional demand.
Backed by U.S. nuclear industrial policy expansion (EO May 2025) — turning uranium into a strategic, multi-year asset class.

MARKET ANALYSIS
Stocks Holding Their Breath

Stocks extended their rally on Tuesday, with the S&P 500 and Nasdaq both closing at new highs as optimism around the Fed’s upcoming rate decision and continued AI momentum fueled risk appetite. Nvidia led the charge, jumping 5% after CEO Jensen Huang said the AI industry has “turned a corner” while unveiling new partnerships with Uber, Nokia, and the U.S. Department of Energy.
All eyes on the Fed’s policy statement later today, where a second consecutive rate cut is widely expected. With economic data still limited due to the government shutdown, markets will be paying close attention to Jerome Powell’s tone for any hints of another cut in December.
On the macro side, consumer confidence slipped for a third straight month, reflecting growing concerns about inflation and job stability. Meanwhile, gold continued to decline, falling below $4,000 as easing U.S.-China trade tensions reduced demand for safe havens.
Nasdaq
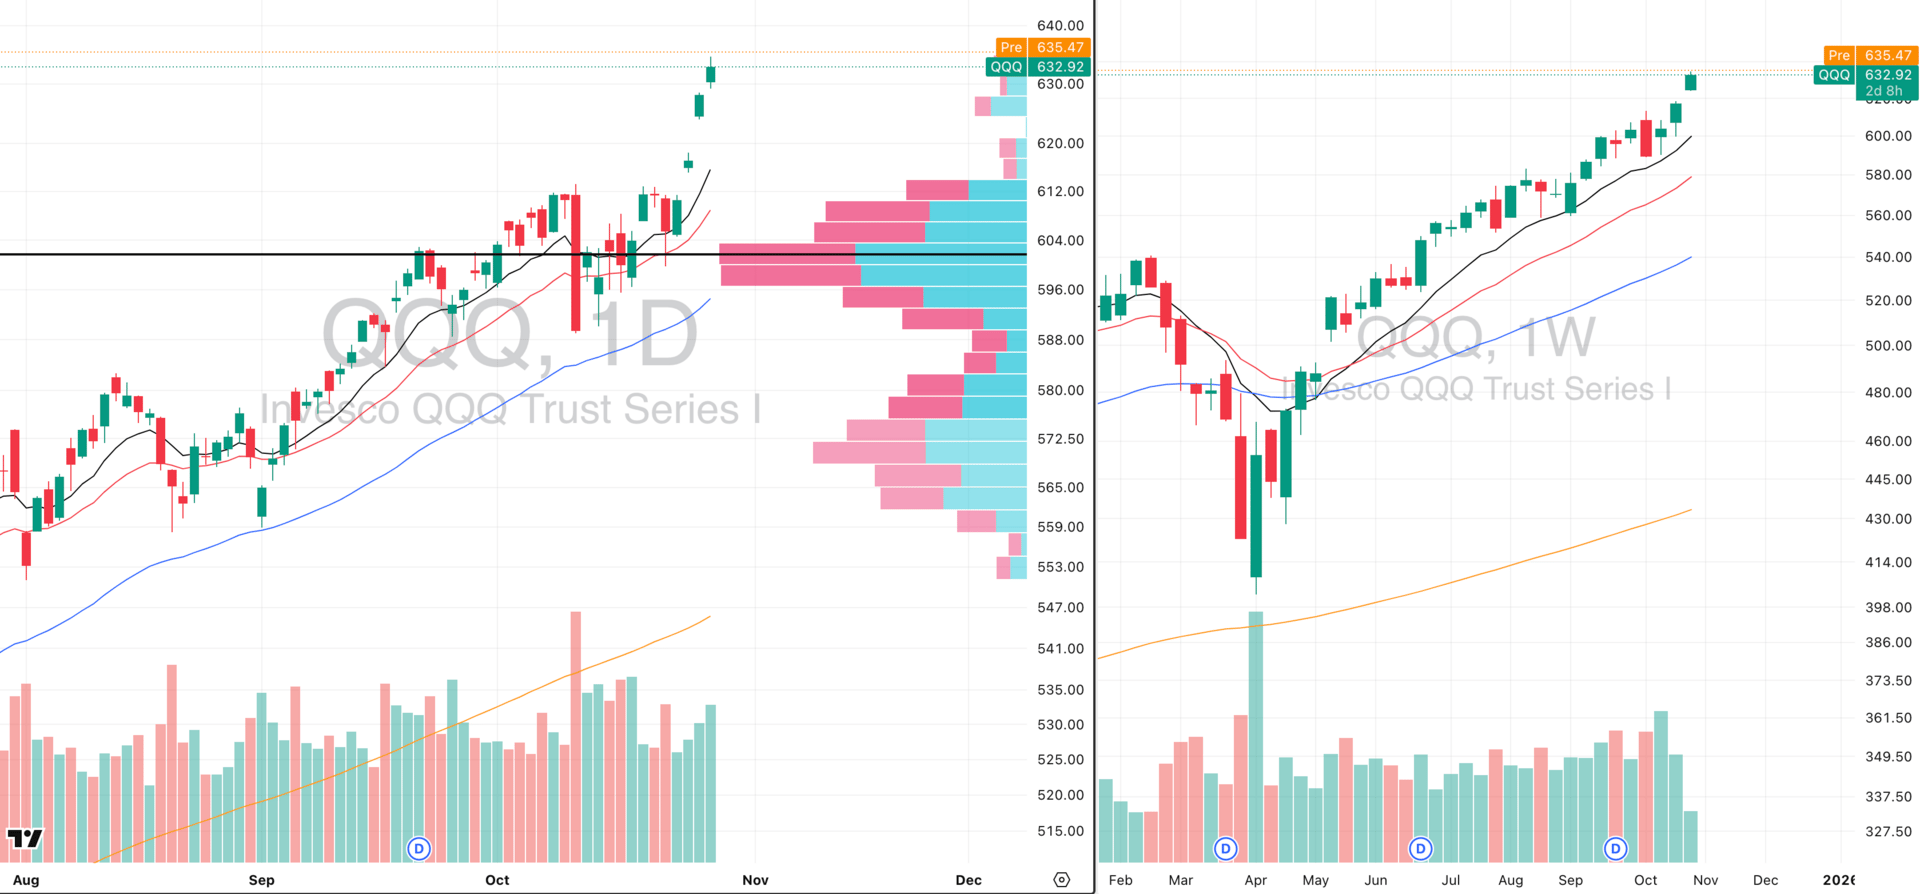
QQQ VRVP Daily Chart
% over 20 EMA: 63.36% | % over 50 EMA: 64.35% | % over 200 EMA: 62.37%
No surprise here as the QQQ remains the dominant leadership group, absorbing the bulk of market liquidity while broader indices like RSP, MDY and IWM tread water.
Structurally, both daily and weekly trends remain firmly intact with higher highs, higher lows, and clean alignment across the 10-, 20-, and 50-day EMAs. Price is extended but still technically sound.
However, this kind of liquidity crowding — where Nasdaq leadership vastly outpaces equal-weight and small/mid-cap breadth — has historically coincided with short-term fatigue zones before a volatility reset. Examples include:
August 2020: Mega-cap concentration peaked before a 10% pullback in QQQ while RSP lagged sharply.
July 2023: Similar conditions, with Nasdaq outperforming by ~8% over 3 weeks before a “cool-off” phase that rotated back into cyclicals.
We now enter a critical three-day window of catalysts:
Earnings from META, GOOG, and MSFT later today.
FOMC rate decision tomorrow.
Key macro data Friday (PCE, employment).
While short-term trends remain bullish, it’s typically not ideal to see vertical extensions into major event clusters as this setup historically increases “sell-the-news” risk due to crowded expectations and over-positioning.
For traders still holding core exposure, this is an ideal area to trim into strength or trail stops tighter, letting the next few sessions dictate direction.
S&P 400 Midcap
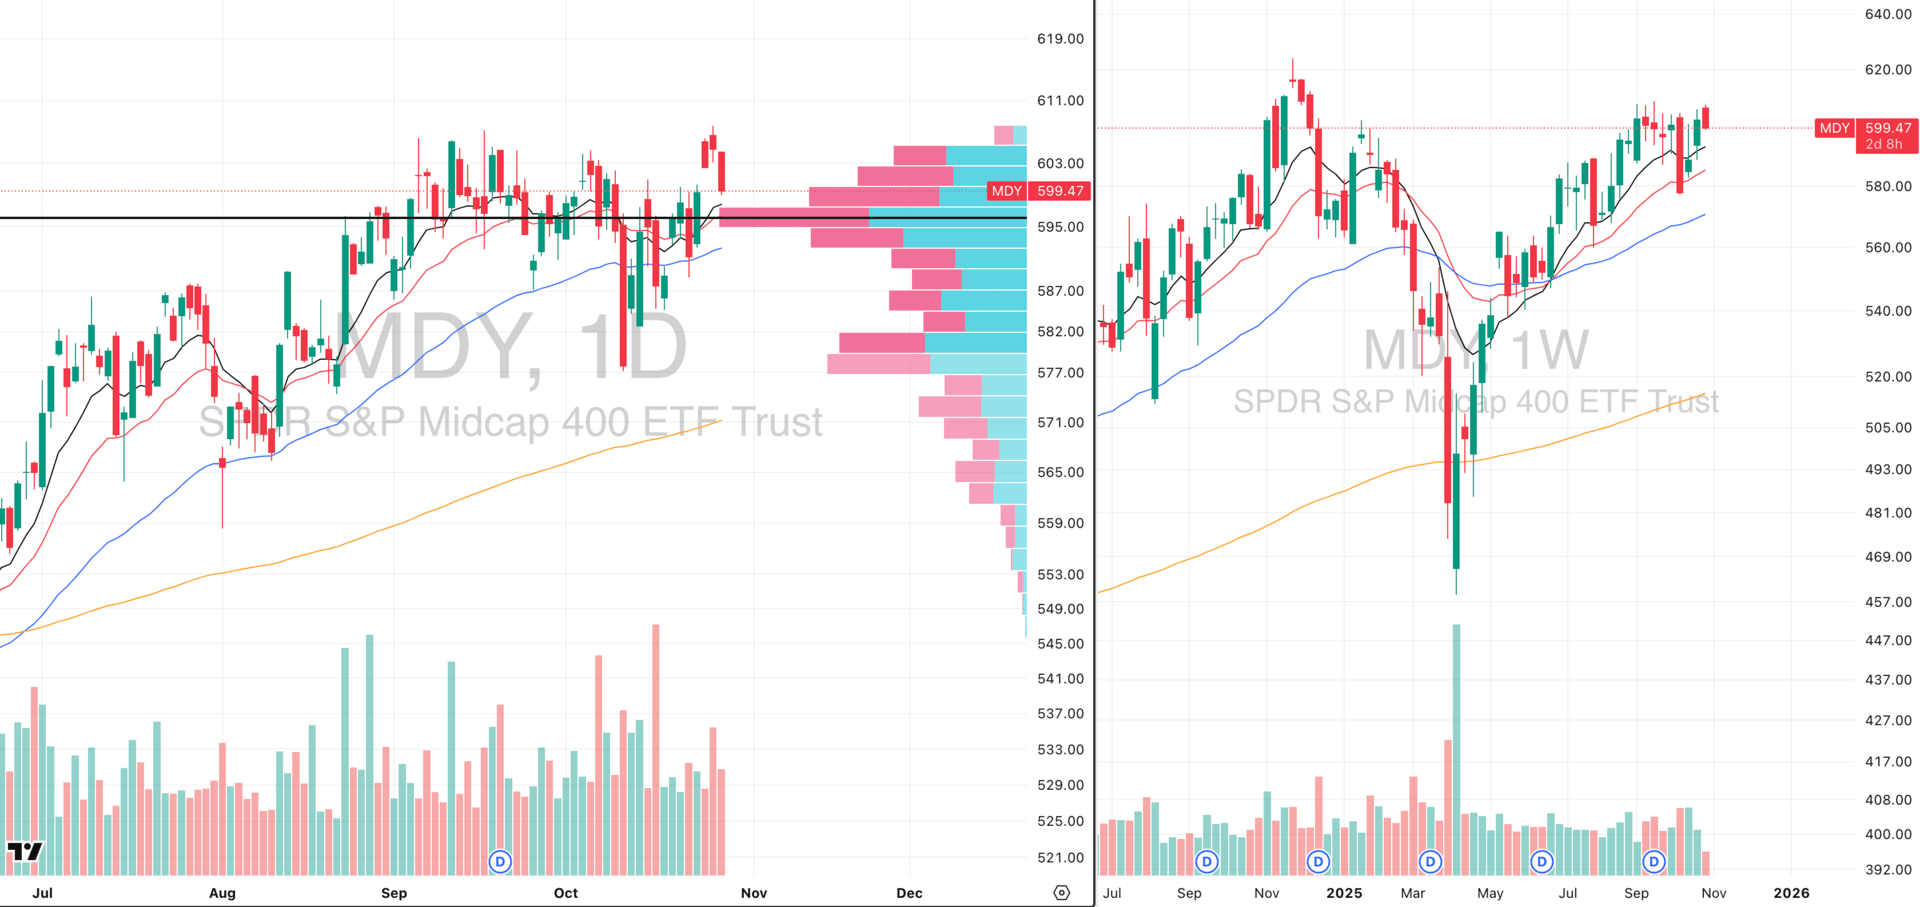
MDY VRVP Daily Chart
% over 20 EMA: 50.62% | % over 50 EMA: 43.39% | % over 200 EMA: 57.35%
As anticipated earlier this week, MDY has filled the open gap from Friday’s move, a natural mean-reversion given its relative weakness versus the Nasdaq. The liquidity rotation continues to favor large-cap tech, leaving midcaps consolidating in a sideways, choppy range.
From a structural perspective, nothing here is broken or concerning as price remains above the $595 point of control (POC), with both the 10- and 20-week EMAs still trending higher and supporting the base.
The setup still looks constructive, but this is not the phase for aggressive entries. With such heavy macro catalysts this week (mega-cap earnings, FOMC decision, and key economic data), short-term technical reads lose edge so the next 72 hours will genuinely stir the pot.
This kind of environment historically leads to high volatility but unclear directional conviction, so for those not already positioned, the optimal play is patience (this doesn’t sound glamorous, but trust us, it’s never worth positioning yourself with naked long or short exposure before $9T worth of earnings (META, MSFT & GOOG combined market caps).
Russell 2000
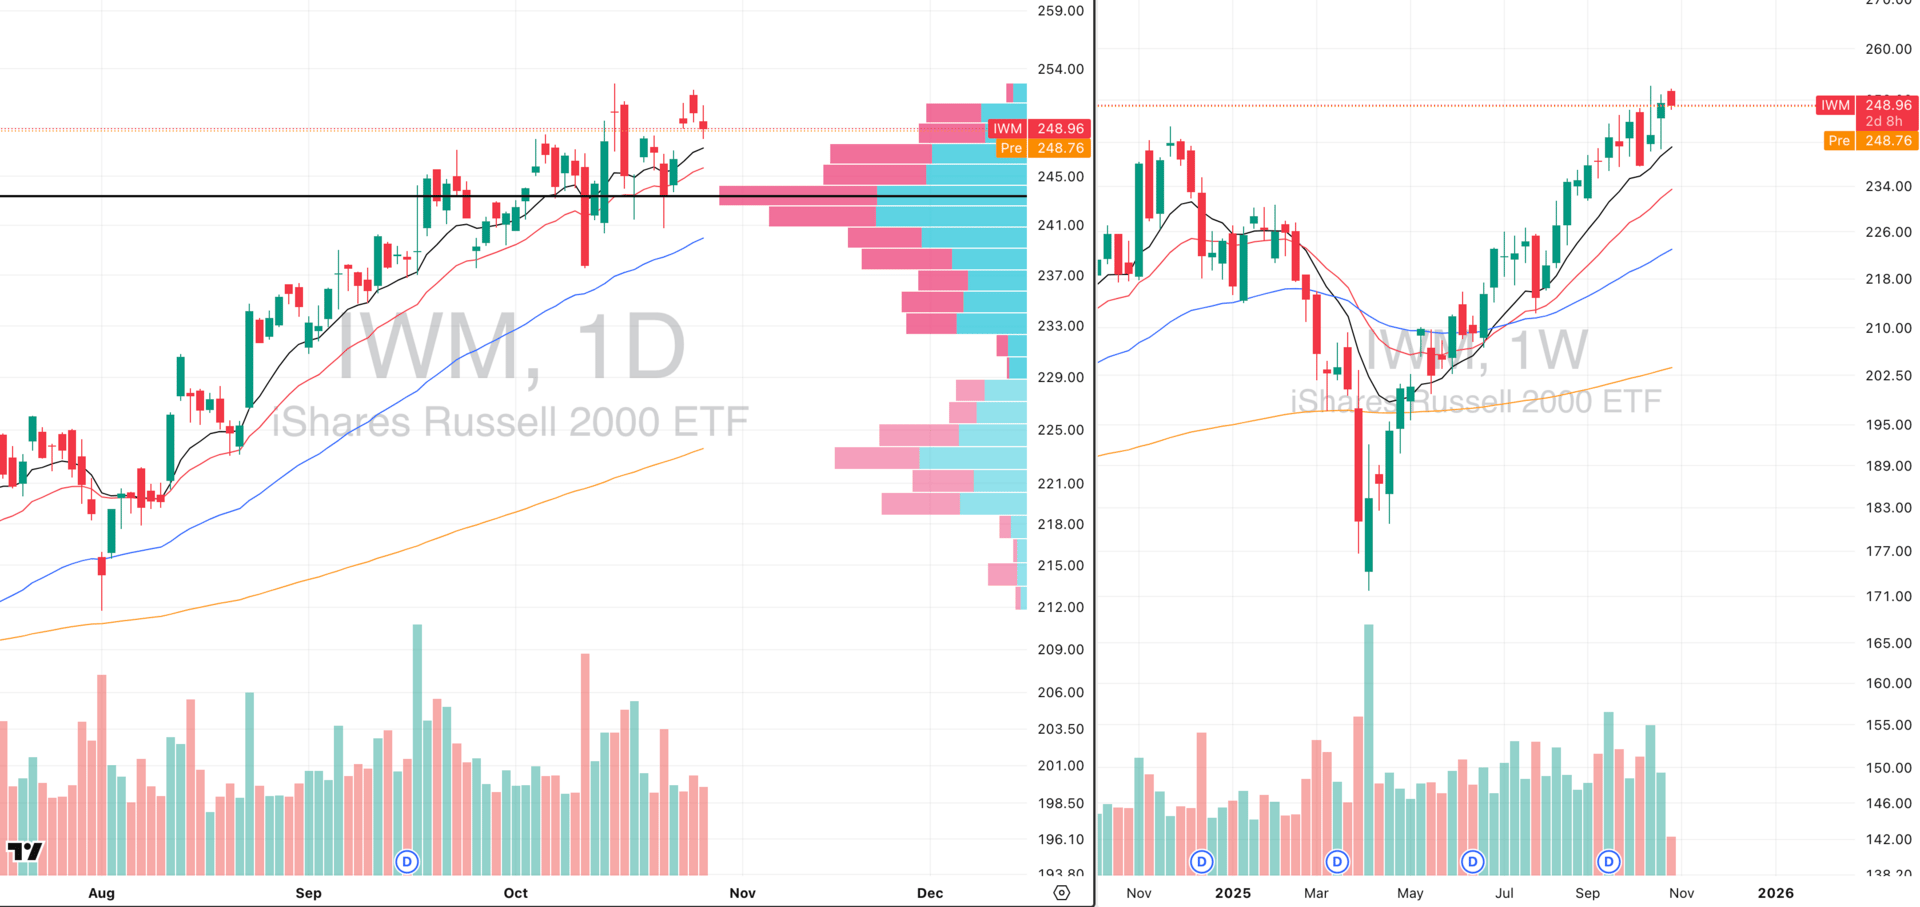
IWM VRVP Daily Chart
% over 20 EMA: 53.93% | % over 50 EMA: 48.10% | % over 200 EMA: 59.20%
The Russell 2000 continues to mirror MDY’s structure, consolidating in a broad range while capital keeps funneling into large-cap tech. But when you zoom out to the weekly timeframe, the Russell shows a much more exaggerated picture of potential risk.
Since April 2025, IWM has not closed below its 10-week EMA even once — an exceptionally rare stretch of uninterrupted intermediate-term strength for small caps.
Historically, such streaks of persistent support without a single weekly break (like we saw in mid-2020 and early 2021) have often preceded brief consolidation or cooling phases.
This doesn’t imply weakness yet but it does signal an increasingly fragile equilibrium, especially as breadth momentum flattens and volume has declined steadily since early October while prices pushed higher.
Myth: Pet insurance doesn’t cover everything

Many pet owners worry that insurance won’t cover everything, especially routine care or pre-existing conditions. While that’s true in many cases, most insurers now offer wellness add-ons for preventive care like vaccines, dental cleanings, and check-ups, giving you more complete coverage. View Money’s pet insurance list to find plans for as low as $10 a month.
FOCUSED STOCK
CRWV: A Perfect IPO Base
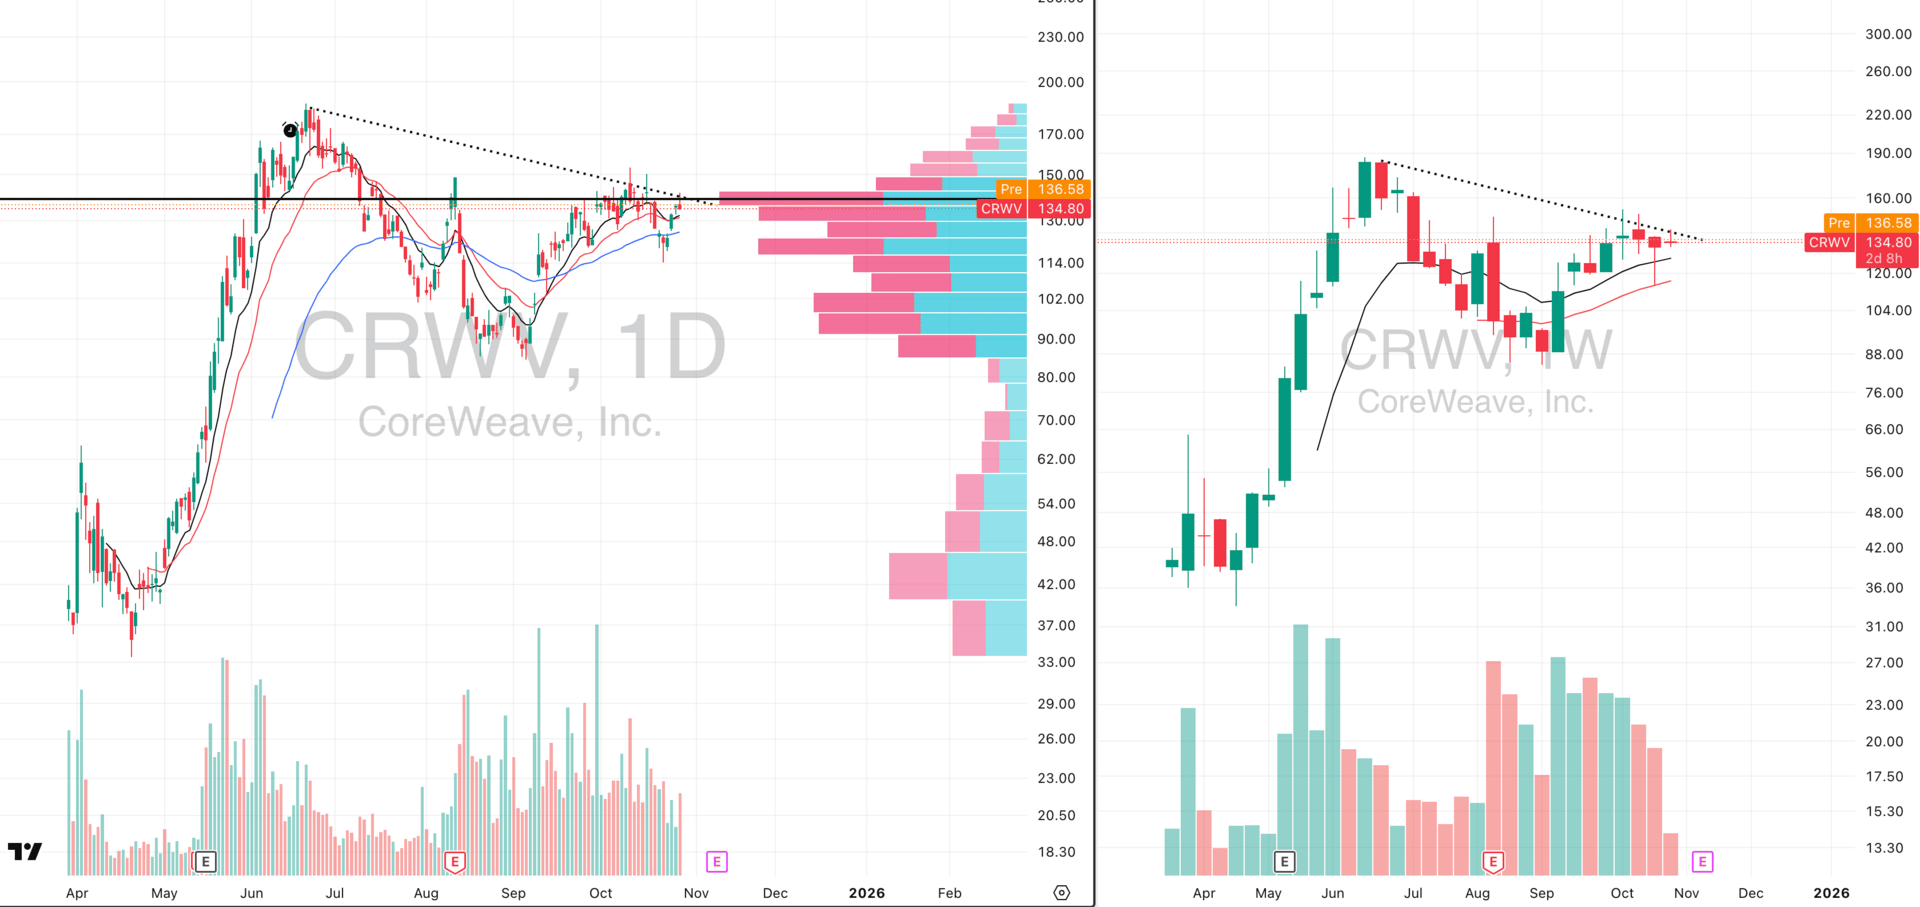
ADR%: 6.79% | Off 52-week high: NAN% | Above 52-week low: NAN%
CRWV continues to set up within a well-defined IPO base, tightening just below its descending trendline and heavy volume shelf around the $130–135 zone.
On the weekly chart, we can clearly see a maturing consolidation spanning roughly six months long and ~35% deep - where volatility has contracted sharply and both the 10- and 20-week EMAs are now flattening and starting to curl higher.
Structurally, this is a near perfect Stage 1 IPO base: the stock ran hard post-listing, corrected, and is now absorbing supply. These setups tend to precede explosive new legs once supply fully clears and the stock transitions into Stage 2 uptrend.
CoreWeave’s business: AI cloud infrastructure for large-scale compute and model training, puts it squarely in the heart of one of the strongest secular themes in the market. It provides specialized GPU-based cloud services for enterprises and startups building advanced AI systems.
The pivot area remains near $145, where a decisive breakout with strong volume would confirm accumulation and likely initiate the next advance.
For now, this remains a watchlist setup, not a trigger as we do have earnings coming up in the next 2 weeks. On a breakout before earnings, his can be a short term momentum play but remain cautious holding large unprotected exposure into earnings if this occurs.
FOCUSED GROUP
URA: The Forgotten Macro Trade
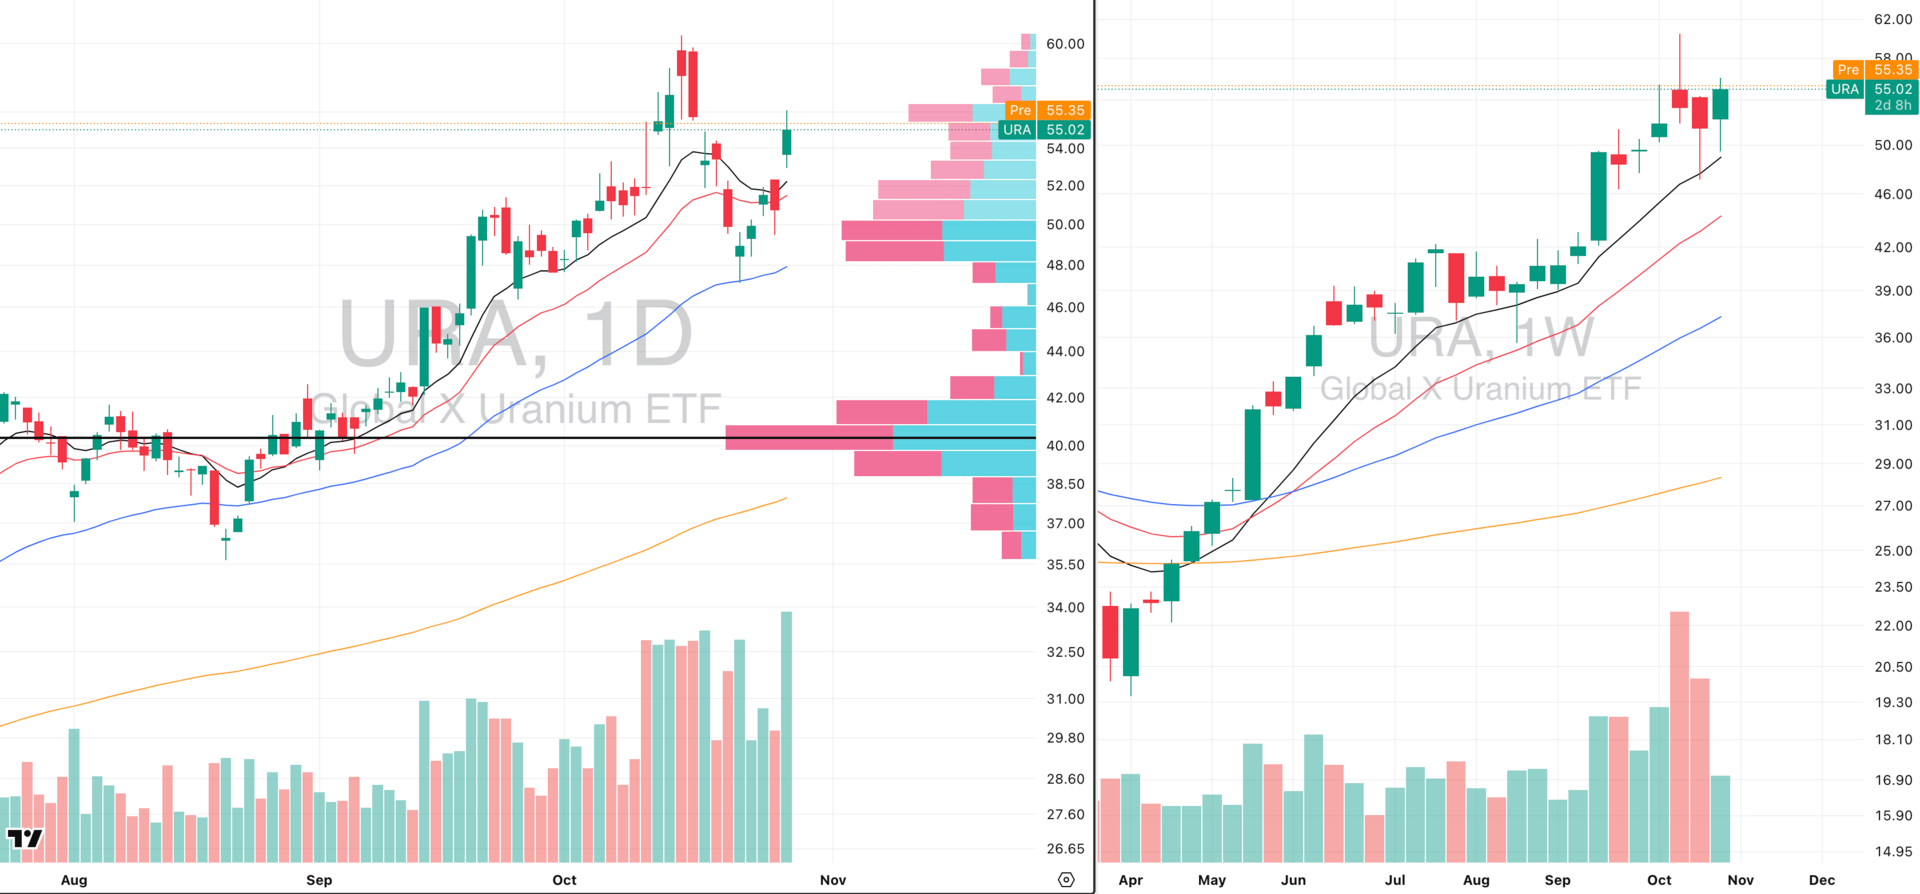
URA VRVP Daily Chart
URA remains one of the cleanest structural breakouts in the commodity ETF space, clearing the $52 pivot in mid-October and holding gains with textbook behavior. The first retest of the rising 10-EMA on Oct 22 offered a near-perfect pullback long entry, aligning with trend continuation rules.
That same pattern repeated again this Monday, when URA tested and reclaimed the rising 10-EMA with strength which was yet another sign of institutional support under the surface.
On the weekly timeframe, URA continues to trend cleanly above all key EMAs, with declining volume on pullbacks and strong expansion on up-weeks.
Macro Context
The May 2025 Executive Order on “Reinvigorating the Nuclear Industrial Base” has significantly reshaped the uranium and nuclear energy investment landscape.
The order mandates a rapid expansion of domestic uranium conversion and enrichment capacity, ending decades of dependence on foreign supply chains.
The Department of Energy has been directed to restart and complete construction on nuclear plants, target 5 GW of uprates, and deliver 10 new large-reactor projects by 2030 — the most aggressive nuclear policy stance in U.S. history.
Funding, loan guarantees, and defense coordination ensure that uranium demand and supply-chain investment will remain structurally supported for years.
This policy backdrop reinforces a multi-year structural tailwind for uranium and related equities and effectively turning the sector into a strategic asset class rather than a cyclical trade.

Did you find value in today's publication?This helps us better design our content for our readers |
Reply