- Swingly
- Posts
- Most Traders Blow Up Here. Protect Yourself.
Most Traders Blow Up Here. Protect Yourself.

OVERVIEW
What You Need To Know
Macro Overview
Regional bank panic is easing as Zions and Western Alliance rebounding, Fifth Third earnings helping sentiment, no systemic risk seen.
Speculative areas (small caps, quantum computing, unprofitable tech) under pressure as froth fades.
European banking stress remains contained.
Big picture: trend fatigue and liquidity distribution dominate as volatility high, direction unclear.
Nasdaq (QQQ)
Stuck in a Wyckoff-style distribution range with every breakout and breakdown retraced.
Key levels: $586 (support) and $608 (resistance); until one breaks, no clean trend.
S&P 400 Midcap (MDY)
Rejected at $596 with heavy distribution volume; short-term trend losing momentum.
A breakdown below $581 confirms intermediate trend failure, targeting $568 next.
Russell 2000 (IWM)
Thursday’s rejection confirms shift to selling control - a typical Wyckoff Phase D behavior.
Losing $251 opens the door to deeper support near $242–$235.

MARKET ANALYSIS
Major Trend Fatigue and Structural Risk

Regional Bank Scare Stabilizing:
U.S. futures are lower this morning but well off their overnight lows as Thursday’s regional bank panic eases. Zions (+4%) and Western Alliance (+3%) are rebounding after sharp sell-offs tied to isolated credit losses, suggesting no systemic issue.Earnings Providing a Backstop:
Strong results from Fifth Third Bancorp (+2.8%) helped restore some confidence, reinforcing that most regional credit risk appears contained to a few one-off exposures (like bankrupt subprime lender Tricolor).Speculative Pockets Under Pressure:
Charles Schwab’s Liz Ann Sonders noted that “speculative froth” is showing up in small caps, quantum computing, and unprofitable tech stocks - echoing the volatility we’ve tracked recently in QTUM and similar high-beta names.European Contagion Limited:
Credit worries briefly hit European banks (Deutsche Bank, Barclays, Sabadell down ~3%), but spillover looks contained for now.
Our Take
This is one of those environments where everything feels urgent with headlines flying, sentiment flipping, and traders trying to outguess the next move.
Right now, clarity will only come from discipline.
Price, volume, and trend are the only pure signals that still cut through the confusion. They don’t care about opinions, forecasts, or politics and they just tell you what’s actually happening.
We strongly recommend every trader narrow their focus back to those three anchors.
Forget predicting the next headline or fighting every tick. Let the tape lead. When the trend turns, you’ll see it there first - not on CNBC or FOX.
Nasdaq
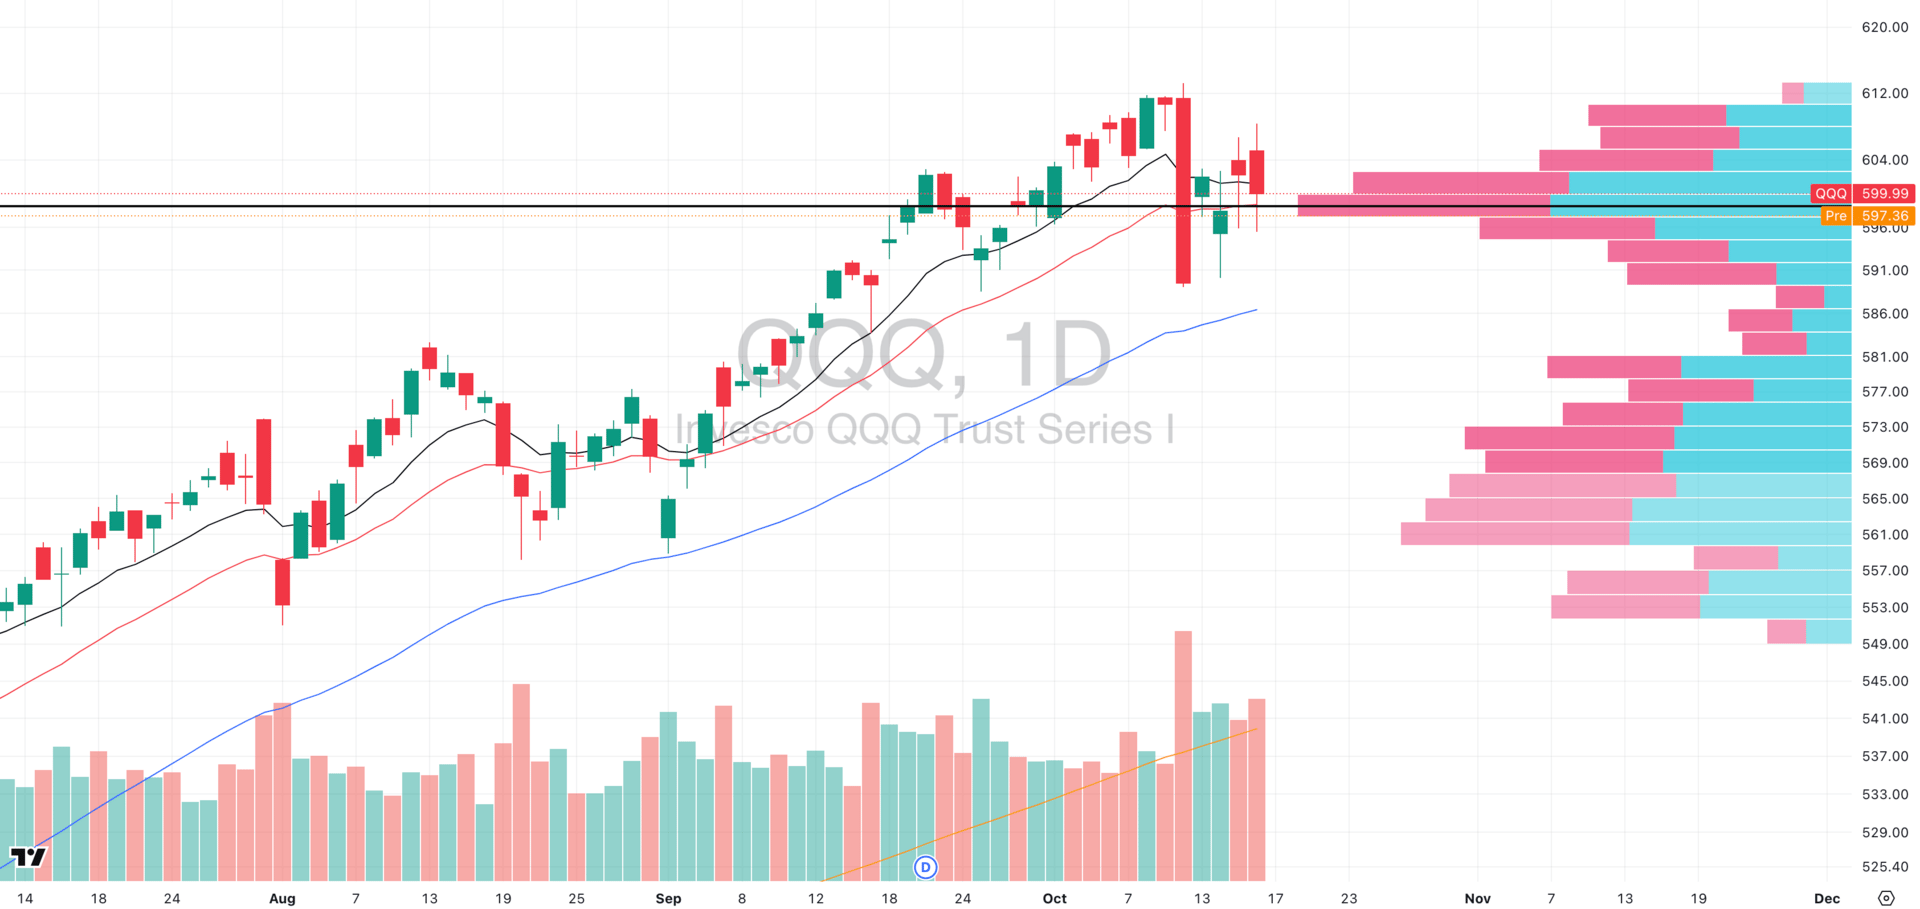
QQQ VRVP Daily Chart
% over 20 EMA: 37.62% | % over 50 EMA: 45.54% | % over 200 EMA: 54.45%
QQQ continues to trace what looks like a Wyckoff-style distribution range, with heavy volume into weakness and no sustained buying follow-through.
Structurally, it resembles a head and shoulders top, but the pattern isn’t cleanly resolving yet as every breakdown is being retraced, and every bounce is being sold.
That’s the definition of a choppy, non-trending market and this is one where both longs and shorts get whipsawed trying to force trades inside a distributional range.
Key level to watch remains $586, which lines up with both the daily 50 EMA and the lower boundary of this range.
Weekly – Trend Fatigue Setting In
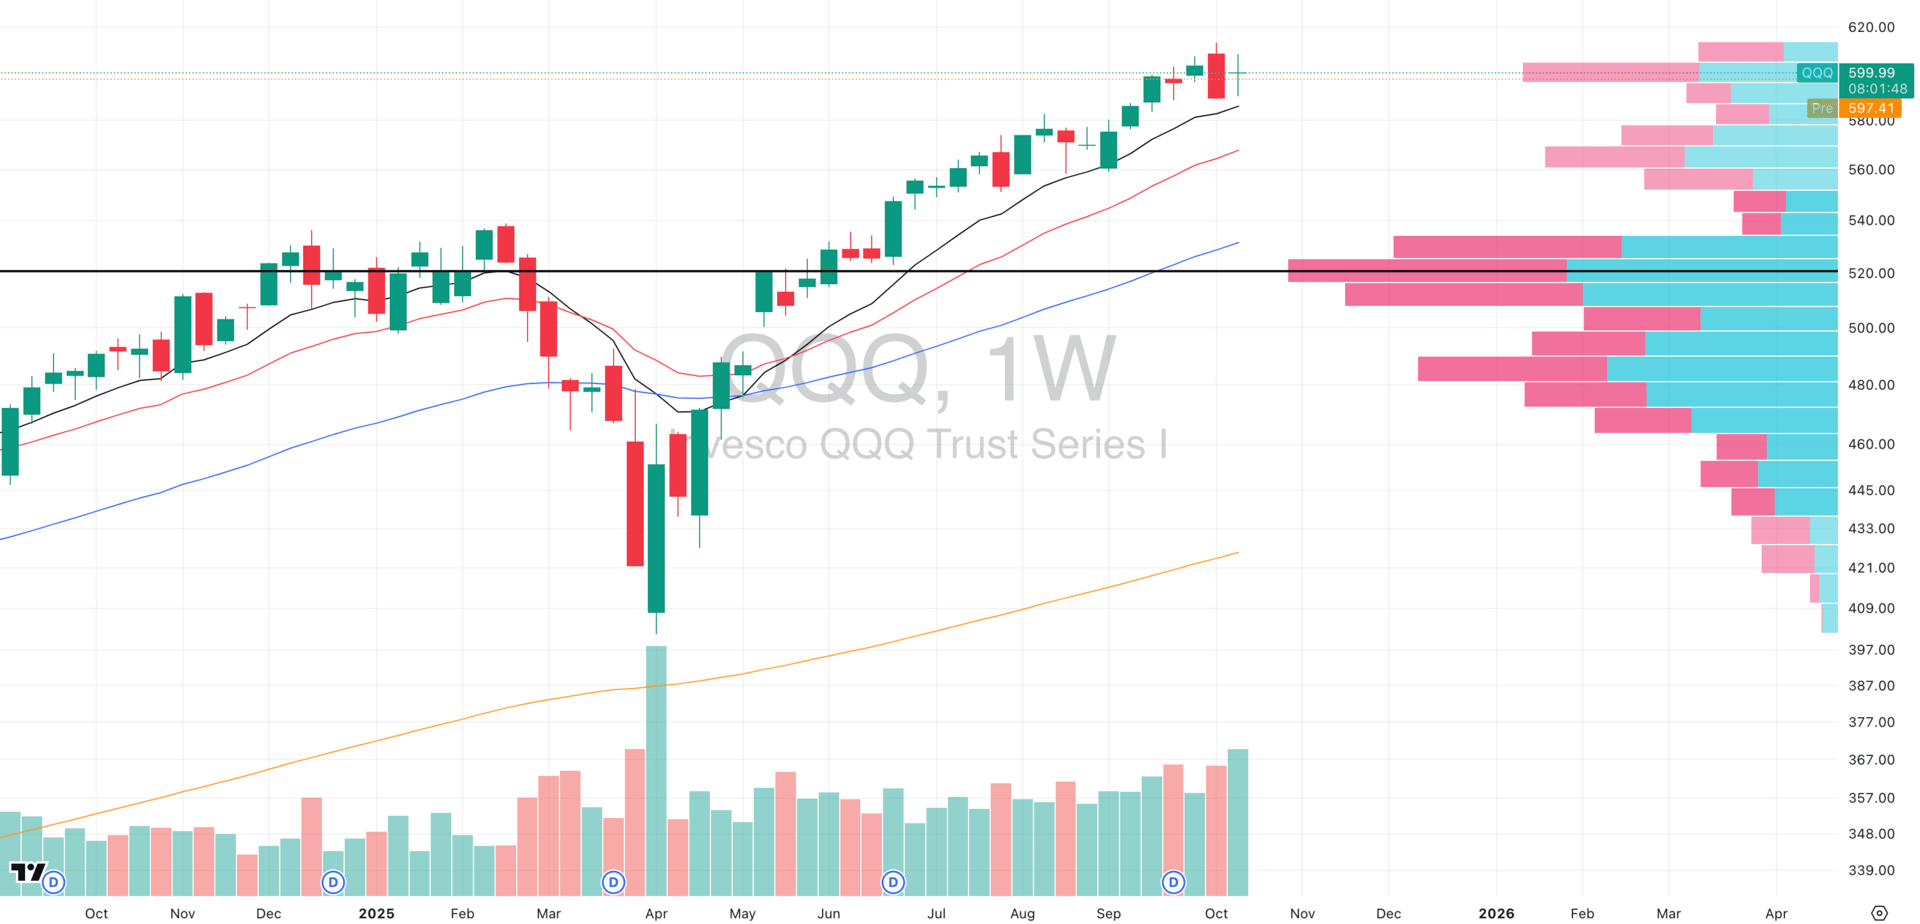
QQQ VRVP Weekly Chart
On the weekly chart, momentum is clearly fading. The index is holding its 10-week EMA, but it’s doing so without energy or leadership and the volume is rising in a consolidation period which is not a positive sign.
The same $586 which is the daily 50-EMA also aligns with the 10-week EMA, reinforcing that this zone is where buyers either defend or the structure fully breaks down.
Our View
This is a complete no-trend environment which means we won’t see any clean long or short opportunities.
Volatility is very high, direction is uncertain, and institutions are distributing inventory into liquidity.
Until we see a decisive break above $608 (over this week highs) or a confirmed close below $586, the best trade is likely no trade.
S&P 400 Midcap
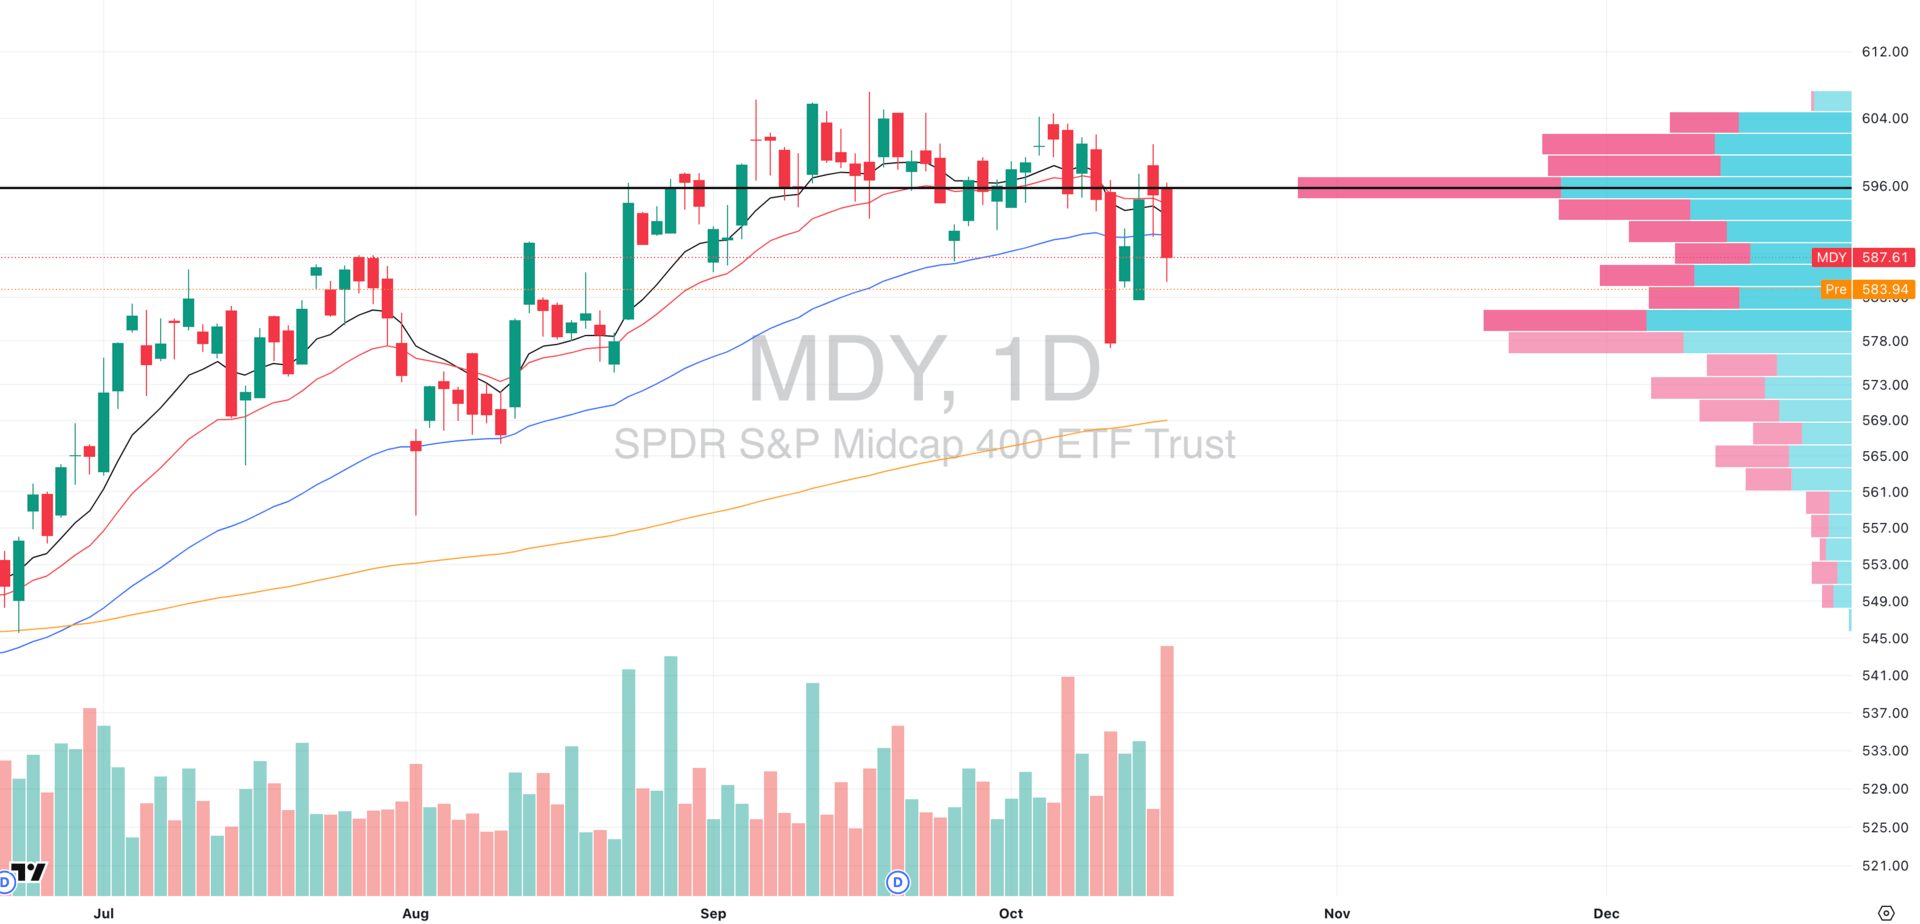
MDY VRVP Daily Chart
% over 20 EMA: 35.41% | % over 50 EMA: 35.41% | % over 200 EMA: 50.87%
MDY saw a sharp rejection at the $596 Point of Control (POC), the heaviest volume node on the visible range.
Yesterday’s session printed the highest volume in months at 217% of the 20-day average, signaling meaningful distribution in an already unusually high 20 day volume period.
The rejection came exactly at the 10/20-day EMAs, which have now turned into short-term resistance.
Weekly – Losing Momentum, Trend at Risk
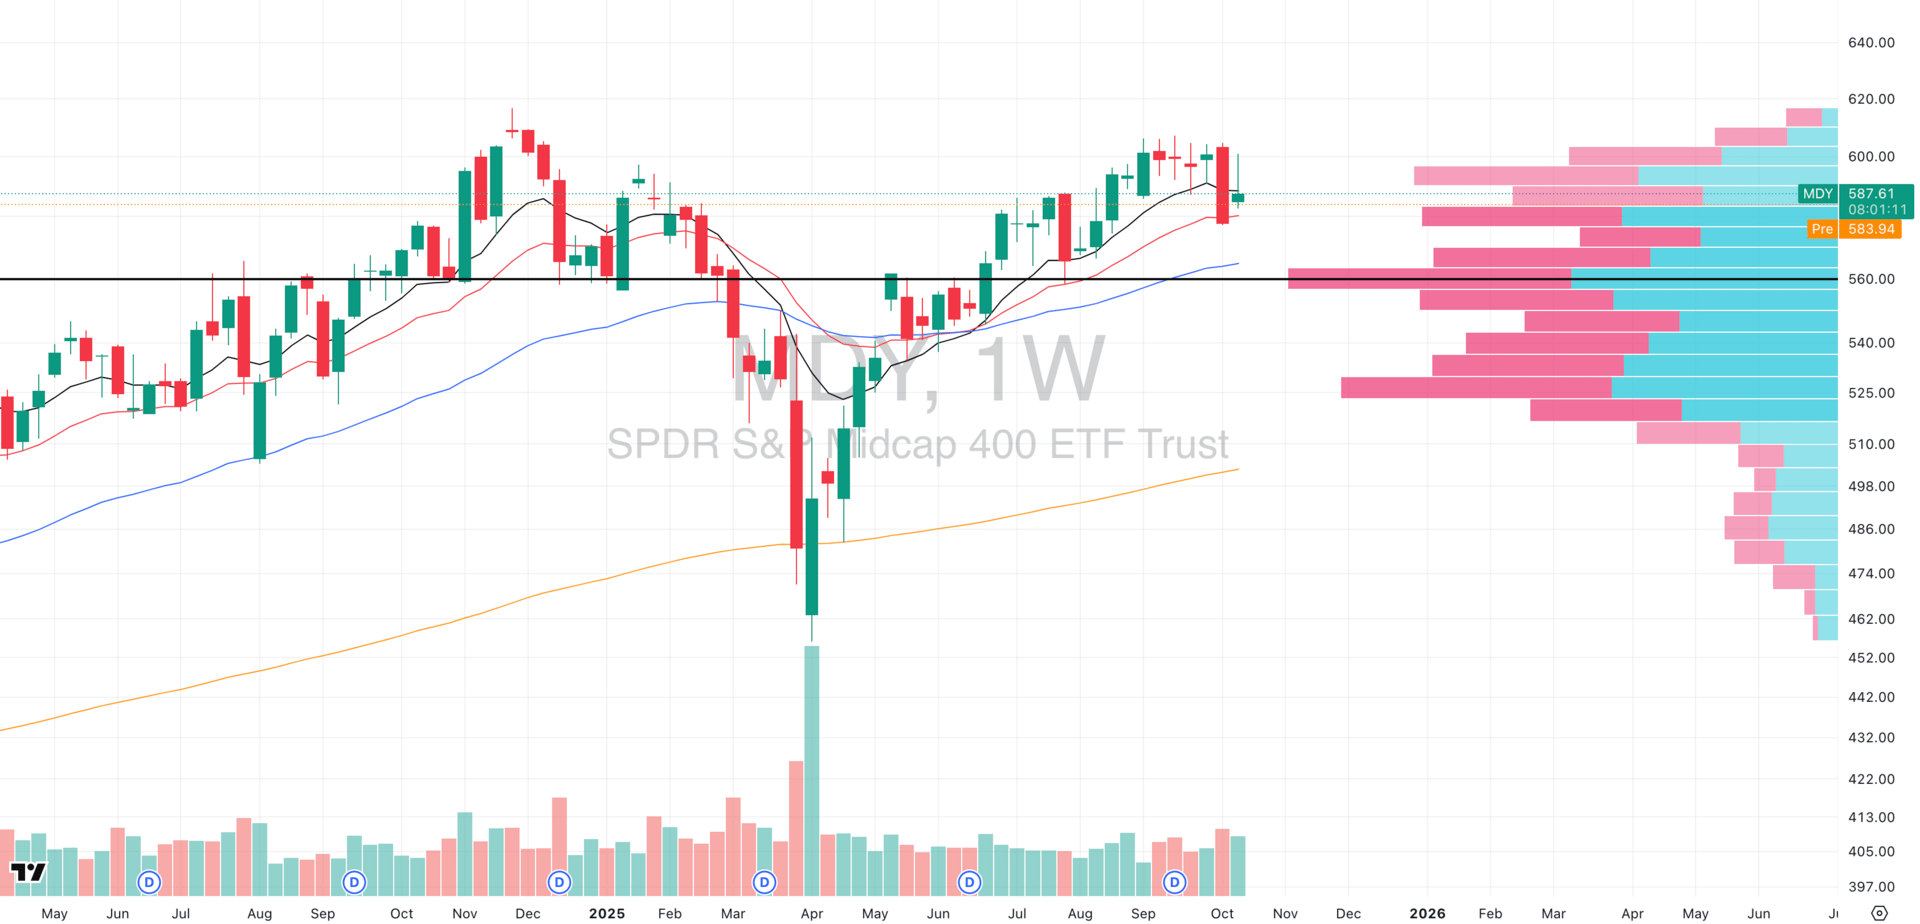
MDY VRVP Weekly Chart
The weekly chart shows MDY fading off the 10-week EMA, confirming the loss of near-term trend control.
The 20-week EMA at $581 is now the key level as losing it would represent a clear intermediate trend failure and likely trigger further downside momentum.
Below that, the $568 zone stands out as the next high-probability magnet and it aligns perfectly with both the weekly 50 EMA and the daily 200 EMA, creating a deep structural support cluster.
We are in a very dangerous period for the health of the longer term trend for the MDY.
Russell 2000
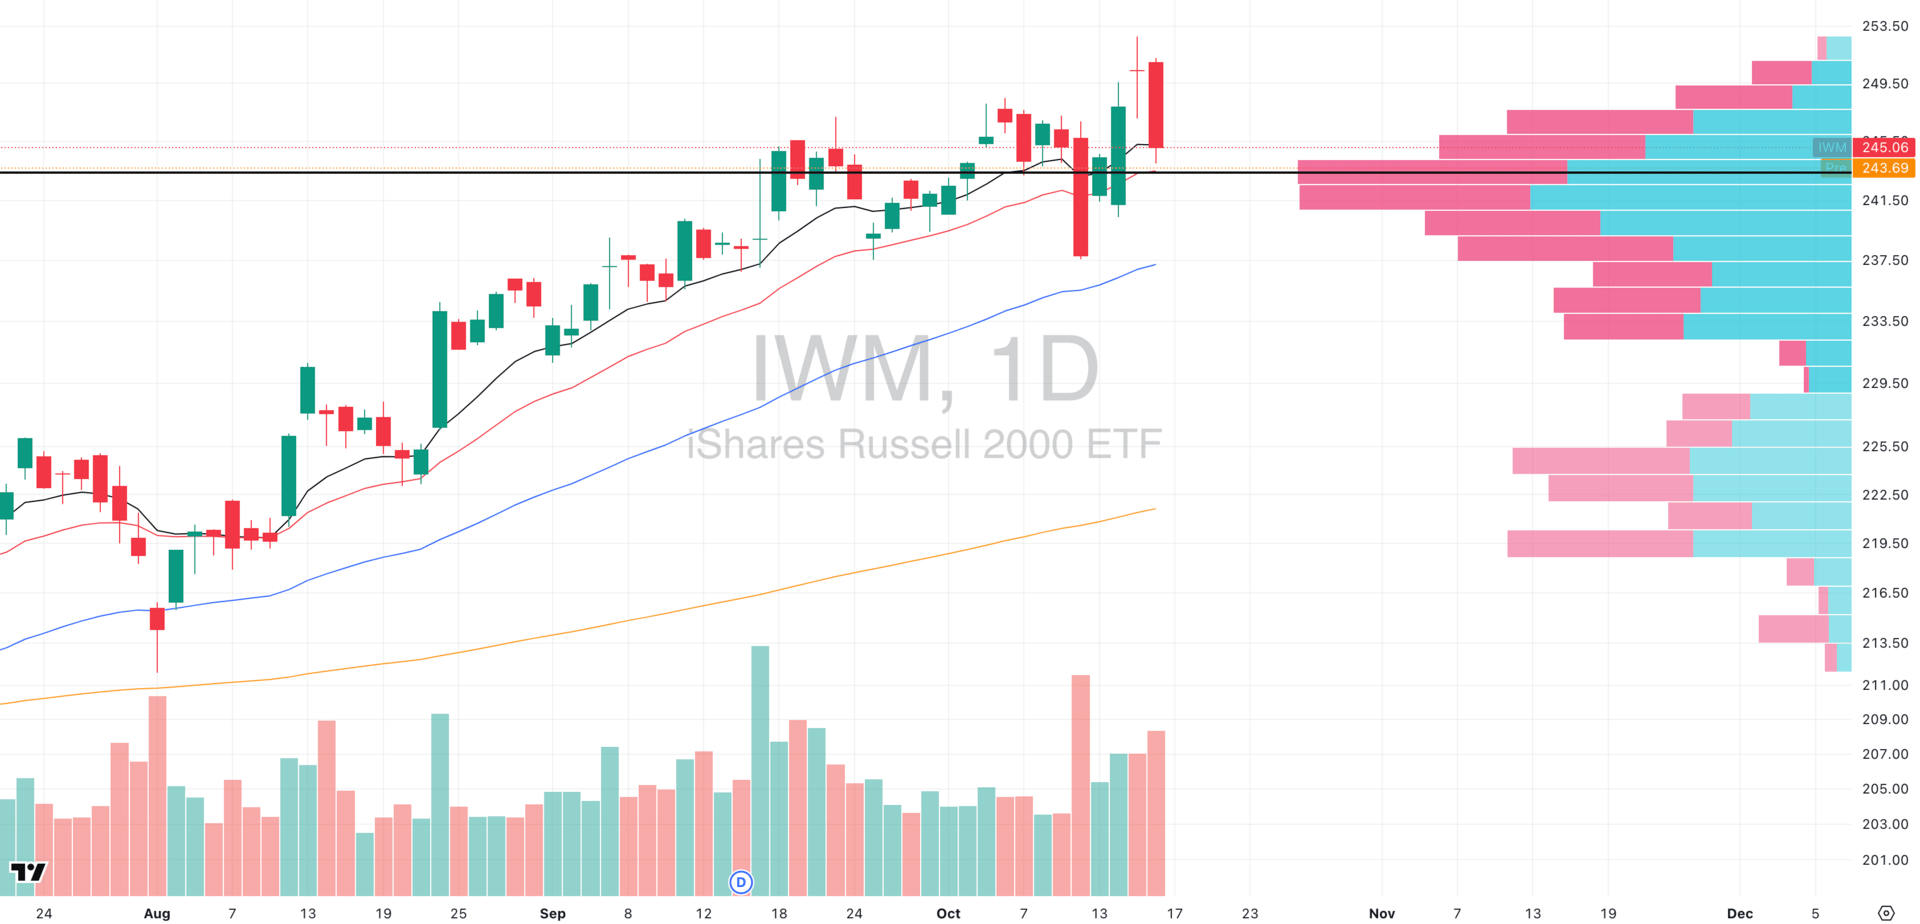
IWM VRVP Daily Chart
% over 20 EMA: 35.06% | % over 50 EMA: 40.62% | % over 200 EMA: 52.65%
The doji candle that printed on Wednesday was a temporary pause in momentum and this has now been fully negated by Thursday’s sharp rejection candle on rising volume, confirming a shift from balance to selling control.
Structurally, this is exactly how Wyckoff Phase C–D unfolds: early strength fails, supply overwhelms demand, and the first sign of weakness (SOW) emerges.
The rejection came right at the prior high near $251–$252, mirroring the upthrust-after-distribution (UTAD) stage — a final liquidity grab before markdown begins.
If momentum continues lower, the first structural support sits at $242, followed by deeper demand near $235, where prior resistance turned into support in September.
Financial News Keeps You Poor. Here's Why.

The scandalous truth: Most market news is designed to inform you about what already happened, not help you profit from what's coming next.
When CNBC reports "Stock XYZ surges 287%"—you missed it.
What you actually need:
Tomorrow's IPO calendar (not yesterday's launches)
Crowdfunding deals opening this week (not closed rounds)
What real traders are positioning for (not TV talking heads)
Economic data that moves markets (before it's released)
The financial media industrial complex profits from keeping you one step behind.
Stocks & Income flips this backwards. We focus entirely on forward-looking intel that helps you get positioned before the crowd, not informed after the move.
Stop chasing trades that happened already.
Start prepping for the next one.
Stocks & Income is for informational purposes only and is not intended to be used as investment advice. Do your own research.
MINDSET CHECK
The Power of Doing Nothing

We’re not going to lie to you or sugarcoat it - this is a messy, highly volatile environment, and pretending otherwise doesn’t help anyone.
We want to be transparent about how we’re handling it: by stepping back, tightening risk, and waiting for cleaner setups to emerge.
There are no Focused Stock or Group sections today because there simply aren’t any that meet our criteria for high-probability follow-through.
When leadership is unclear and breadth is fragmented, the best trade is often no trade at all.
The single greatest advantage retail traders hold over institutions is freedom.
You don’t have to deploy capital. Hedge funds do as they’re obligated to meet quarterly benchmarks, justify mandates, and explain underperformance. You aren’t.
That autonomy is one of the most powerful alpha-generating edges in trading - the ability to not play when odds aren’t in your favor.
This is what’s known as dynamic risk modulation i.e. scaling exposure based on system performance rather than emotion.
When your process starts to underperform, your job isn’t to push harder; it’s to pull back and protect mental and financial capital.
How to Quantify When to Step Aside
Rather than trading on “feel,” track your system like a live market. You can use technical overlays on your own metrics to identify when conditions shift:
Dynamic Win Rate: When your 10- or 20-day EMA of win rate starts trending below its long-term average, that’s a quantitative signal your setups are degrading.
Equity Curve Momentum: When your cumulative equity curve breaks below its 10- or 20-day EMA, it’s the trading equivalent of price losing trend alignment and is a cue to reduce size, cut frequency, or step aside entirely.
Breadth Confirmation: If market breadth compresses simultaneously (fewer stocks making new highs, rising correlation), those weak internal signals reinforce the defensive bias.
These data-driven indicators create an objective risk thermostat and this can allow you to begin scaling exposure down when your system cools and ramping up when it reaccelerates.
Cash as Strategic Offense
In a 4% yield environment cash isn’t idle, it’s actually positive-carry optionality.
It earns while you wait, compounds quietly in the background, and grants instant strike power when conviction returns.
But beyond optionality, cash plays a deeper role in the mathematics of performance as it limits drawdowns, and by extension, protects your ability to compound.
Why Drawdown Control Is Everything
Every trader eventually learns the same truth: returns are multiplicative, not additive, and that means the path matters far more than the headline result.
If you’re down 25%, you need +33% to recover. Down 50%, you need +100%.
Every additional drawdown compounds against you geometrically, slowing recovery and eroding psychological capital.
The best traders in the world don’t just optimize for return, they also optimize for consistency and drawdown depth.
If you can halve your maximum drawdown while maintaining 70–80% of your upside, your long-term CAGR (compound annual growth rate) will be significantly higher than a trader who swings for every move.

Did you find value in today's publication?This helps us better design our content for our readers |
Reply