- Swingly
- Posts
- Money To Be Made In Small & Mid Caps
Money To Be Made In Small & Mid Caps
In partnership with

MARKET ANALYSIS
What You Need To Know

Equity futures are pulling back this morning as the reaction to the Fed’s cut competes with a sharp drag from Oracle.
The S&P 500 is down roughly 0.4% pre-market, with Nasdaq futures weaker at –0.6% as tech absorbs most of the pressure.
Oracle’s earnings miss and increased spending guidance hit sentiment hard. The stock is down more than 13% pre-market, and the weakness has spilled into the broader AI complex, including NVDA, AMD, and CoreWeave.
The concern is that the timeline for AI monetisation may be slower than what the market priced in over the past two months.
Yesterday’s Fed decision delivered the expected quarter-point cut, but Powell’s tone was more cautious than markets had hoped.
While he acknowledged ongoing disinflation, he also leaned heavily on a “wait-and-see” stance and pointed to tariffs as an inflation driver.
The Fed is signalling fewer cuts ahead, not more, and that restrained tone is now being priced in.
A reminder that it is small caps benefit the most from lower rates, which is why the Russell 2000 continues to act well. Their cost of capital moves directly with market rates, so any cut is immediately supportive. Yesterday’s record close in IWM fits this narrative cleanly.
This morning’s decline in tech isn’t a macro shift by itself, it’s simply the market repricing the AI narrative after an influential component (Oracle) disappointed.
What matters is whether NVDA and AMD confirm or reject that weakness over the next 48 hours. If they stabilise, the damage is contained. If they break, leadership will rotate again (likely down the cap curve into the small and mid cap names).
Our stance for today: the backdrop remains broadly supportive, but we’re entering a period where the market will demand proof—proof of AI monetisation, proof of earnings durability, and proof of a clearer Fed trajectory. Expect digestion, not expansion, until we see those signals.
Nasdaq

QQQ VRVP Daily & Weekly Chart
65.34%: over 20 EMA | 56.43%: over 50 EMA | 58.41%: over 200 EMA
Yesterday’s strength in the Nasdaq is almost fully unwound pre-market, with sellers stepping in at the exact same 628.80 supply zone that capped price on 5 December.
Pre-market, the Qs have retraced ~0.82% off yesterday’s highs, which simply reinforces that supply remains firm at the top of this range.
Despite that, the underlying structure is still constructive. The rising 10-day EMA at 628 continues to attract real demand, with six consecutive tests/undercuts holding without follow-through.
The demand zone between 628 → 620 remains the key area. An undercut into 617 (20-day EMA) would not break structure; it would simply retest the base of the trend.
On the weekly chart, price continues to trade inside a very tight ATR band, with the only real risk being the air-pocket down to 613 on the visible range volume profile.
That 613–620 gap represents the “worst-case scenario” for this week. A move of that magnitude (~2.3% from yesterday’s highs) is possible, but not our base case.
S&P 400 Midcap

MDY VRVP Daily & Weekly Chart
72.31%: over 20 EMA | 63.34%: over 50 EMA | 62.09%: over 200 EMA
Mid-caps were the strongest part of the market yesterday, and it wasn’t subtle.
MDY put in a 145% relative volume session and cleared its multi-month supply shelf—a level that rejected price repeatedly since early September.
The breakout carried MDY 0.8% above its 52-week highs, confirming rotation down the cap curve.
This is the key divergence that most retail traders miss:
The Nasdaq is dominated by mega-caps that are unwinding their recent move.
Mid-caps are breaking out on surging volume and clean technicals.
When mid-caps lead while megacaps hesitate, this is not a bearish signal—it simply tells you where capital is flowing.
The macro backdrop favors mid-caps: falling rates directly reduce borrowing costs, which disproportionately improves margins for mid-cap companies.
Structure is clean also with higher lows since late November, breakout confirmed on volume, and no signs of distribution.
Russell 2000
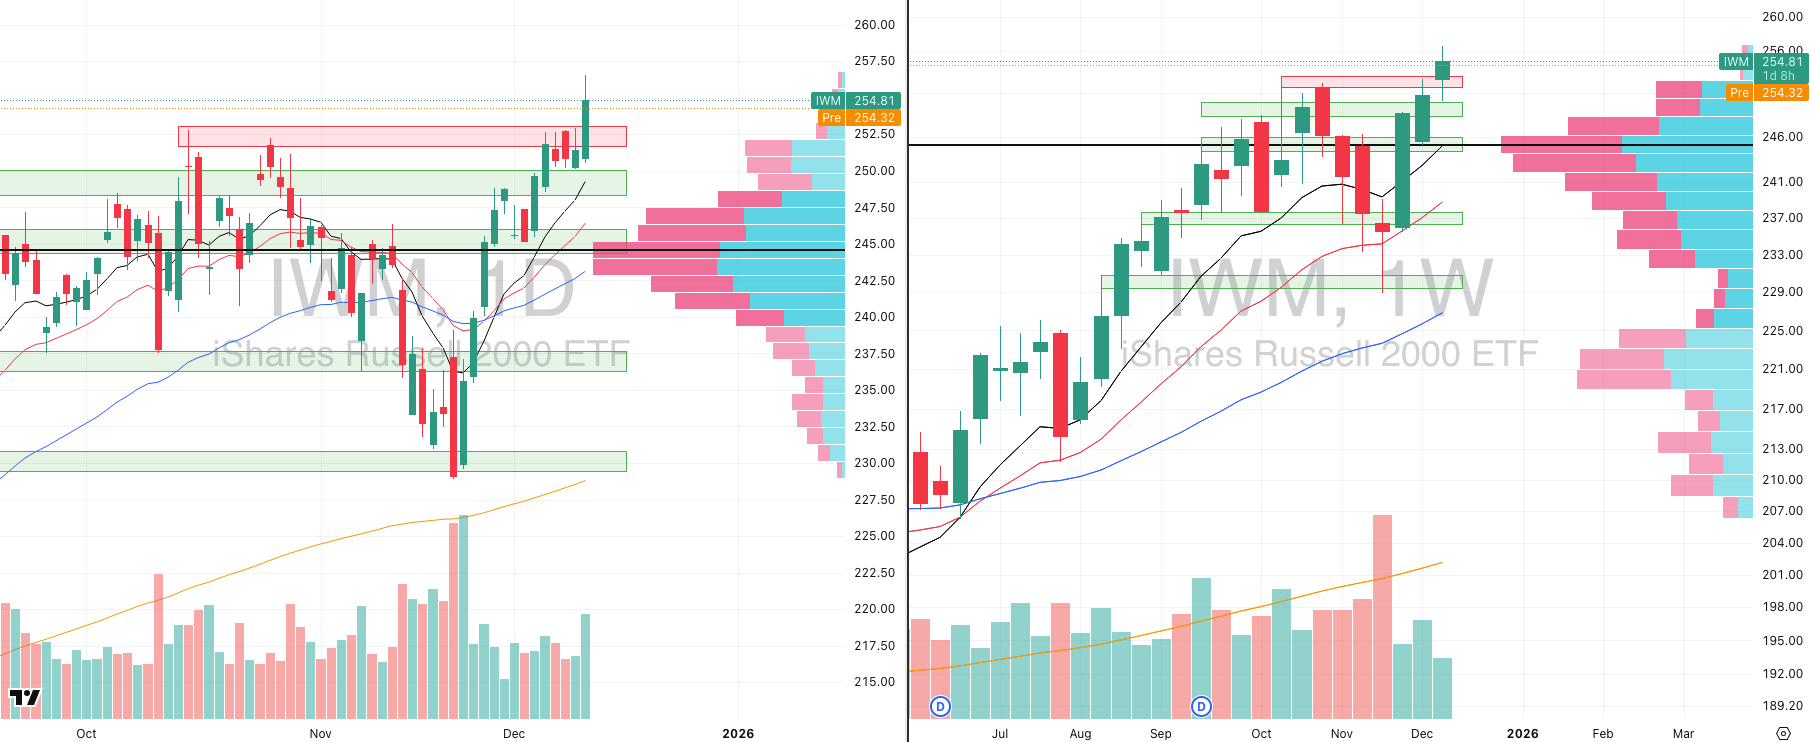
IWM VRVP Daily & Weekly Chart
79.64%: over 20 EMA | 65.48%: over 50 EMA | 64.76%: over 200 EMA
Small-caps printed their own major divergence yesterday with a 123% relative volume breakout.
IWM pushed into fresh highs after a tight, one-week contraction between Dec 4–10, then accelerated through resistance.
There was some exhaustion at 256.61, but nowhere near the degree of unwinding we are seeing in the Nasdaq.
The level to track today is 252–253. This is:
The prior breakout zone
The heart of the recent contraction area
A clear demand pocket in the visible range profile
A pullback into this area would be healthy, not bearish. If we see a retest and reversal higher into the close, that would strongly suggest the small-cap consolidation phase is ending and a new intermediate uptrend is starting.
Once again, the divergence matters here as the mid-caps and small-caps are holding their strength far better than megacaps. This points to broadening participation, not deterioration.
Tackle your credit card debt by paying 0% intro APR until 2027

Did you know some credit cards can actually help you get out of debt faster? Yes, it sounds crazy. But it’s true.
The secret: Find a card with a “0% intro APR" period for balance transfers or purchases. This could help you fund a large purchase or transfer your debt balance and pay it down as much as possible during the intro period. No interest means you could pay off the debt faster.
FOCUSED STOCK
GFI: Watch The Gold Miners Closely

GFI VRVP Daily & Weekly Chart
ADR%: 4.56% | Off 52-week high: -8.8% | Above 52-week low: +239.5%
Gold Fields is a global gold producer with major operations across Australia, Ghana, Peru, and South Africa. It has been one of the strongest names in the precious metals complex over the last twelve months, and its technical structure continues to tighten in a way that deserves close attention.
Key Technical Observations
Primary trend remains firmly up.
Since December 2024, GFI has advanced roughly 250% in a persistent, high-volume primary uptrend, respecting its rising 10- and 20-week moving averages throughout the entire move.Intermediary contraction continues.
Since mid-September, GFI has been working through a controlled weekly contraction. Relative volume has steadily declined, price has continued to build higher lows, and the range has compressed meaningfully over the last two weeks.Strong reaction at point of control.
Yesterday’s pullback into the daily POC was immediately absorbed. Buyers stepped in on ~100% relative volume and drove price back above the short-term MAs—a constructive response that confirms demand is sitting beneath the surface.Position within the market’s leadership stack.
GFI’s relative strength rating is 98, placing it among the top-performing equities across the entire market. It is currently within 9% of its all-time highs, and the supply above 43.75 is extremely thin on the visible range profile.
The combination of:
declining weekly volume
ATR contraction
persistent support at the rising 10-week
leadership-level RS, creates the conditions for a continuation breakout. GFI is also a fast mover with a ~5% ADR, meaning it can deliver outsized returns quickly when momentum re-ignites.
FOCUSED GROUP
XLI: This Is A Very Important Rotation
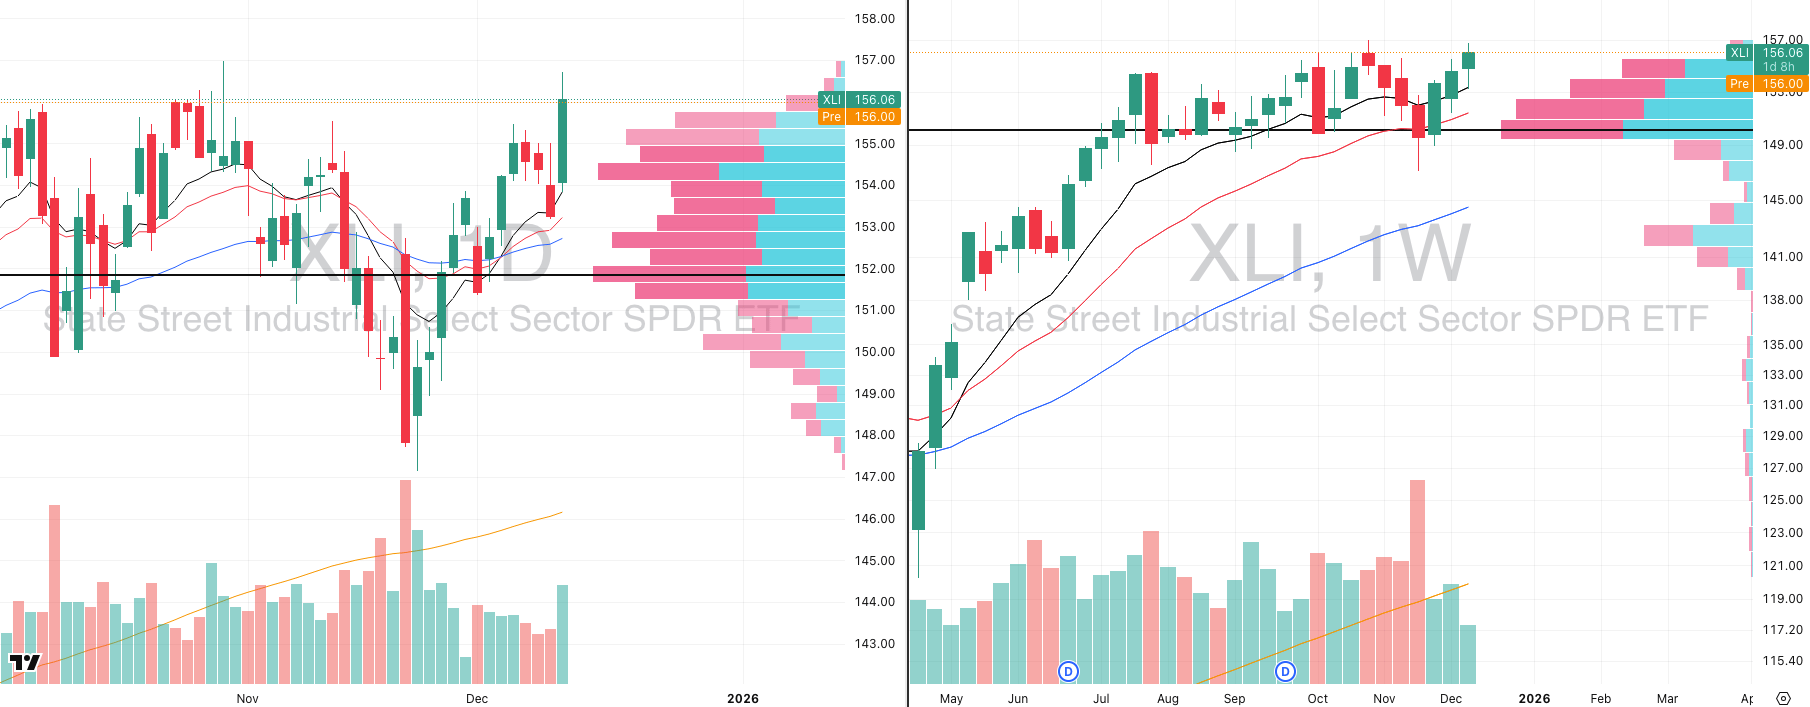
XLI VRVP Daily & Weekly Chart
Industrials staged a meaningful breakout yesterday on strong participation, and the structure now suggests the group is beginning a new upside phase. To understand the implications, it’s worth outlining what XLI actually represents.
XLI is the S&P 500 Industrials Sector ETF, which includes large-cap companies across:
aerospace & defense
machinery
transportation
logistics & services
construction & engineering
Strong confirmation via volume.
XLI pushed higher on 120% relative volume off the rising 10-day EMA, signalling active accumulation rather than passive drift.Weekly structure turning up.
Earlier this week, price retested the rising 10-week moving average and immediately reversed higher—typically a sign that the higher-timeframe trend remains intact.Macro alignment.
Industrials are highly sensitive to:rate-cut cycles
capital expenditure trends
infrastructure and defence spending
global manufacturing momentum
With rates now moving lower and economic expectations improving into 2026, cyclicals are beginning to attract capital again.
Why institutions rotate here.
When the market transitions from early-cycle growth leadership (mega-cap tech) into broadening participation, Industrials are often one of the first groups to show it.A strong XLI is usually a sign that:
the market believes the economy can sustain an expansion phase
capex cycles are firming
breadth in cyclical groups is improving
This aligns with what we’re already seeing across mid-caps and small-caps.

Did you find value in today's publication?This helps us better design our content for our readers |
Reply