- Swingly
- Posts
- Markets Coil. Leadership Rotates. Here’s What That Means.
Markets Coil. Leadership Rotates. Here’s What That Means.
In partnership with

OVERVIEW
What You Need To Know
Nasdaq (QQQ)
Coiling above rising EMAs with declining volume and ATR — classic pre-breakout setup.
Premarket gap-up could confirm a bull-flag resolution; base case still bullish while above 615.
S&P 400 Midcap (MDY)
Defending $594 support for the second time with compression under resistance — breakout likely by week’s end.
Structure improving as buyers repeatedly step in near the 10-week EMA; bias tilted bullish.
Russell 2000 (IWM)
Small caps remain the laggard, stuck below $246 resistance with light volume.
Weekly trend intact above 10-week EMA but no confirmed leadership yet.
IAUX (Focused Stock)
Early-stage Stage-2 rally forming with sector confirmation from GDX and gold miners.
High-momentum name best bought on weakness — not strength — given miners’ choppy nature.
KIE (Focused Group)
Insurance ETF emerging from a year-long base with major institutional volume spikes.
Quiet accumulation phase transitioning to early leadership; watch top momentum names within the group.

MARKET ANALYSIS
The Price Action Looks Strong

Tech rebound leading futures higher: S&P 500 and Nasdaq futures up 0.4%–0.6%, driven by strength in semiconductors following yesterday’s pullback.
AMD ignites sentiment: AMD +6% premarket after CEO Lisa Su projected the AI data center market to reach $1T by 2030, citing “insatiable” AI chip demand and stronger forward revenue growth.
Rotation still visible: Tech’s bounce comes as money continues rotating into lower-valuation sectors and particularly healthcare and defensives, which have quietly strengthened over the past week.
Healthcare extends leadership: Sector strength continues with Eli Lilly and J&J leading, confirming the defensive rotation theme we identified earlier this week.
Labor data softens: ADP data showed private payroll cuts in October, reinforcing labor market cooling concerns amid delayed official reports from the ongoing government shutdown.
Shutdown relief possible: The Senate passed a spending bill, now awaiting a House vote, hinting at a potential resolution by week’s end which would a great short-term sentiment stabilizer.
AI + energy convergence: Oklo, a nuclear startup building power for AI infrastructure, reiterated plans for its first commercial plant in 2027, underscoring a growing link between energy capacity and AI expansion (also part of the very strong macro Nuclear theme).
Nasdaq
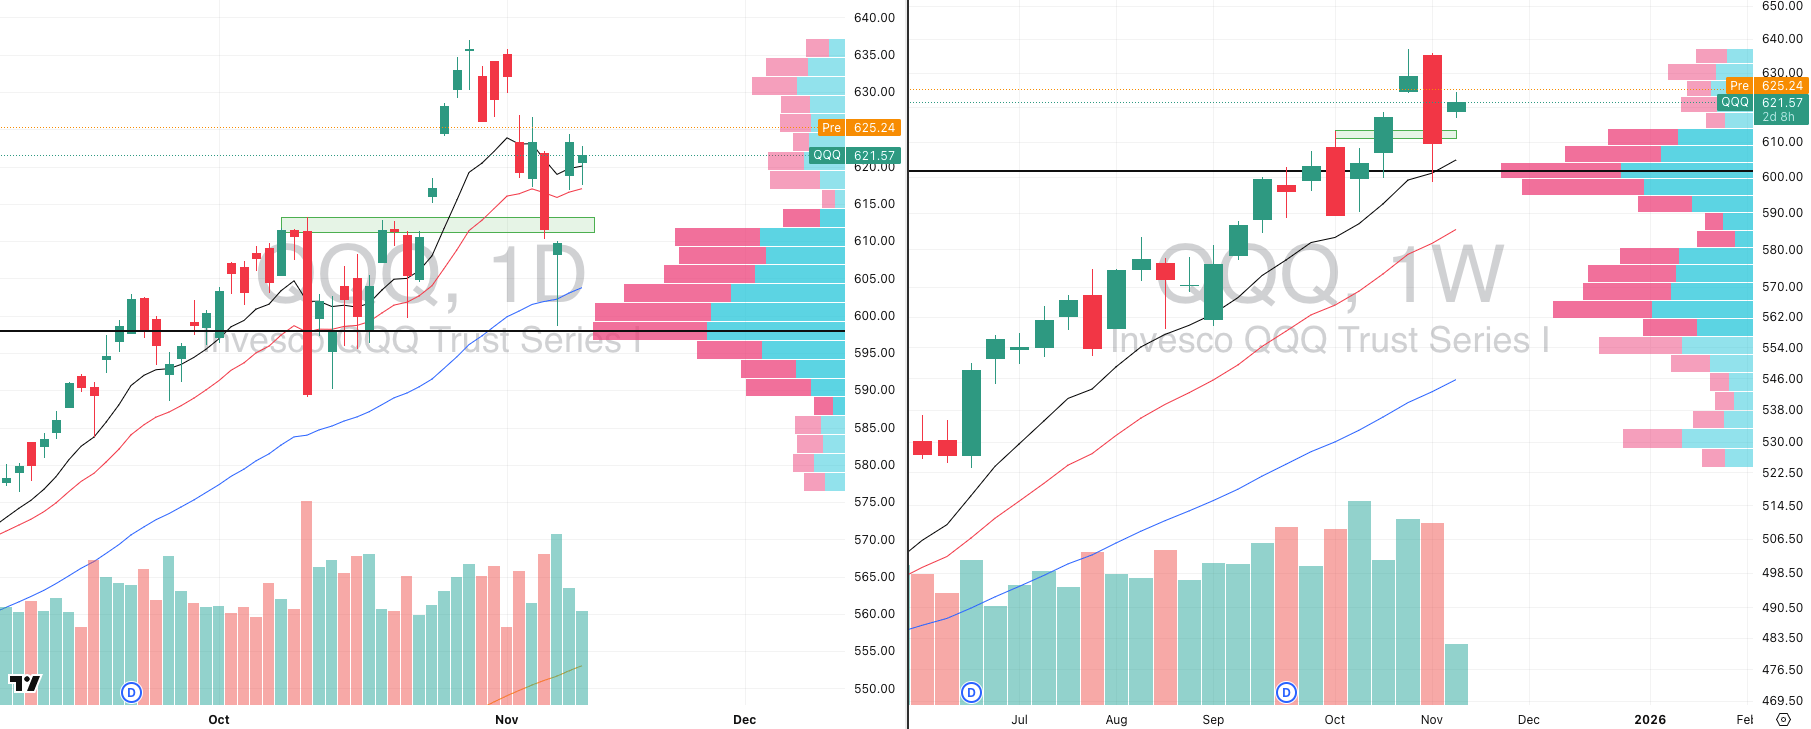
QQQ VRVP Daily & Weekly Chart
% over 20 EMA: 40.19% | % over 50 EMA: 47.05% | % over 200 EMA: 55.88%
Tight contraction: QQQ continues to coil above the rising 10EMA and 20EMA, showing strong short-term control by buyers and a build up for a directional move (with the declining volume + ATR contraction).
Gap-up confirmation: Futures show a gap higher premarket, which could mark a bull flag resolution as the recent consolidation acting as the flag, with the gap as the flagpole extension..
Weekly support: Price continues to hold above the prior breakout area (~615), maintaining weekly trend integrity.
Caution intraday: Given recent market behavior, early strength often fades in the first 15–30 mins before resolving higher. Safer to wait for a potential flush or retest before chasing the open.
S&P 400 Midcap
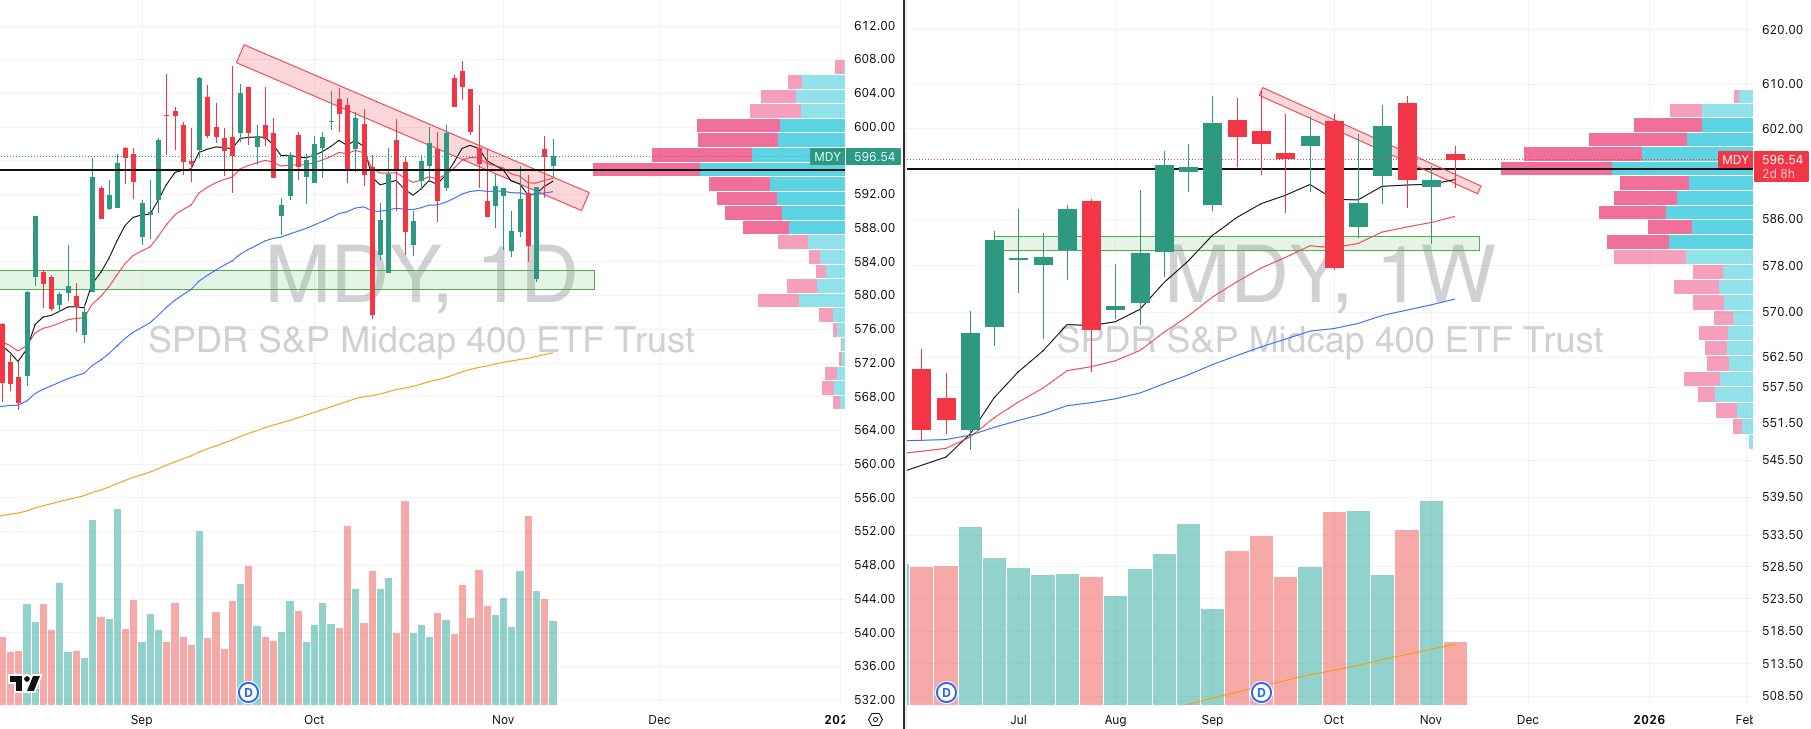
MDY VRVP Daily & Weekly Chart
% over 20 EMA: 51.62% | % over 50 EMA: 42.89% | % over 200 EMA: 54.86%
Midcaps defending key support: MDY is holding firmly around $594, confirming a second successful retest of this critical demand zone.
Downtrend resistance tested: Price has now tagged the declining trendline twice, and buyers have stepped in immediately, showing clear demand absorption.
Intraday contraction forming: We’re seeing tight intraday compression as price balances just under resistance, typically a precursor to a high-volume breakout.
Control level intact: MDY continues to hold above its Point of Control (POC) which we need to see as it shows strong value acceptance in the current range.
Weekly structure improving: The rising 10-week EMA near $591 is acting as support, holding firm for the third consecutive week.
Setup outlook: A directional resolution is imminent as this compression and volume build suggests a decisive breakout by week’s end. Direction remains open, but price behavior favors strength continuation and we would be inclined to expect a breakout higher (vs lower).
Russell 2000
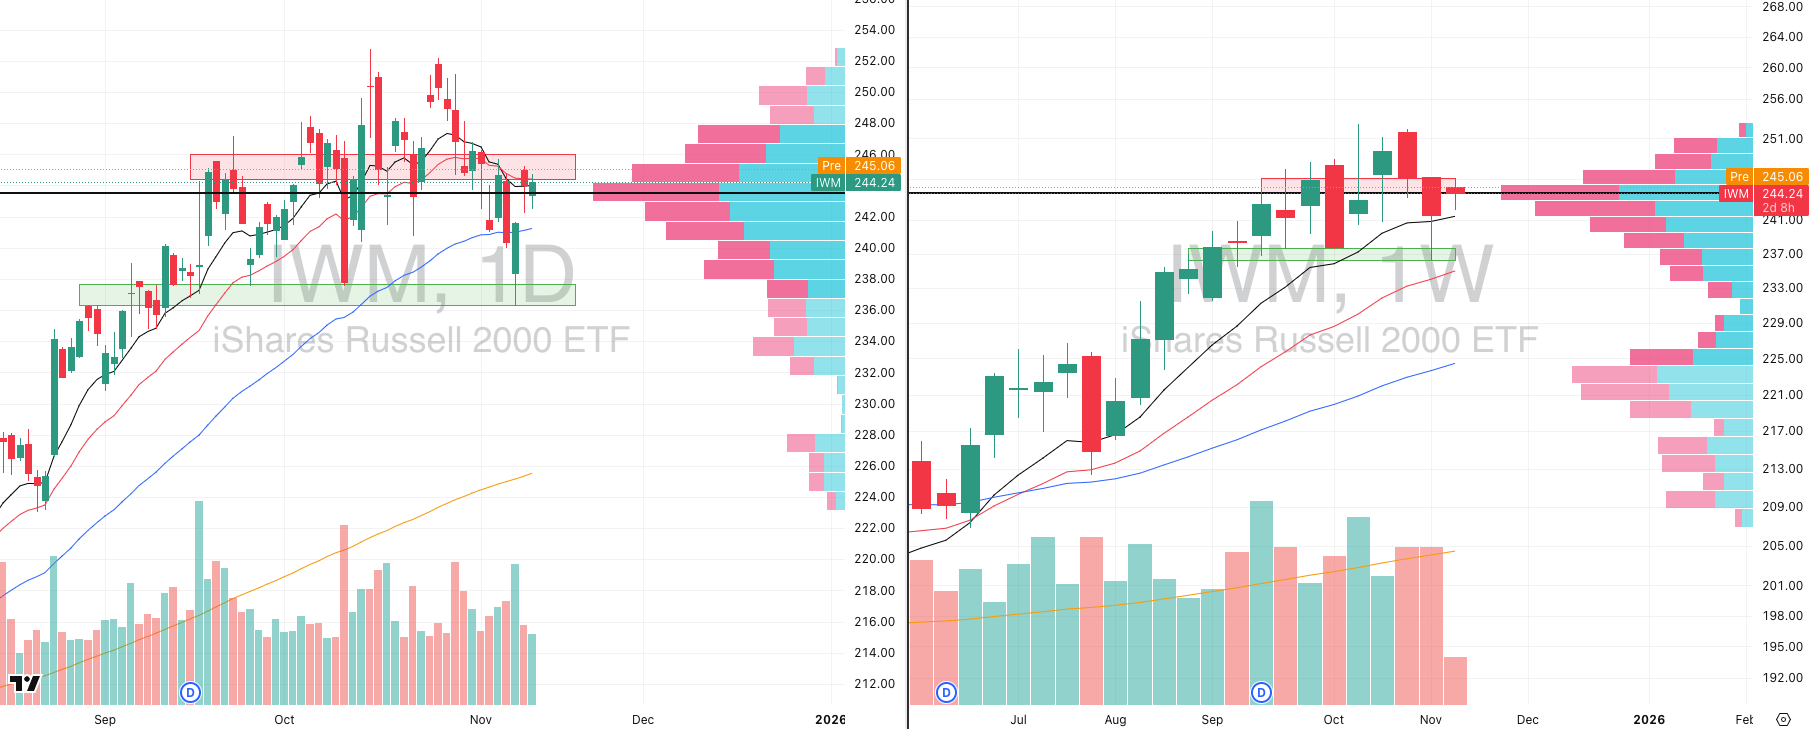
IWM VRVP Daily & Weekly Chart
% over 20 EMA: 49.10% | % over 50 EMA: 43.31% | % over 200 EMA: 55.56%
Small caps lagging: IWM remains weaker relative to midcaps (MDY) and large-cap tech (QQQ), still trapped below the major $246 supply zone that’s capped price multiple times.
Overhead resistance: The $244–$246 range continues to act as a heavy congestion zone, with dense volume and repeated seller presence.
Short-term structure: Price is barely reclaiming the 10EMA, but still below the declining 20EMA which is indicating short-term resistance remains active.
Weekly stability: The 10-week EMA is holding as key trend support, preventing deeper breakdowns and showing quiet accumulation despite the lag.

The best HR advice comes from people who’ve been in the trenches.
That’s what this newsletter delivers.
I Hate it Here is your insider’s guide to surviving and thriving in HR, from someone who’s been there. It’s not about theory or buzzwords — it’s about practical, real-world advice for navigating everything from tricky managers to messy policies.
Every newsletter is written by Hebba Youssef — a Chief People Officer who’s seen it all and is here to share what actually works (and what doesn’t). We’re talking real talk, real strategies, and real support — all with a side of humor to keep you sane.
Because HR shouldn’t feel like a thankless job. And you shouldn’t feel alone in it.
FOCUSED STOCK
IAUX: Don’t Forget About The Miners
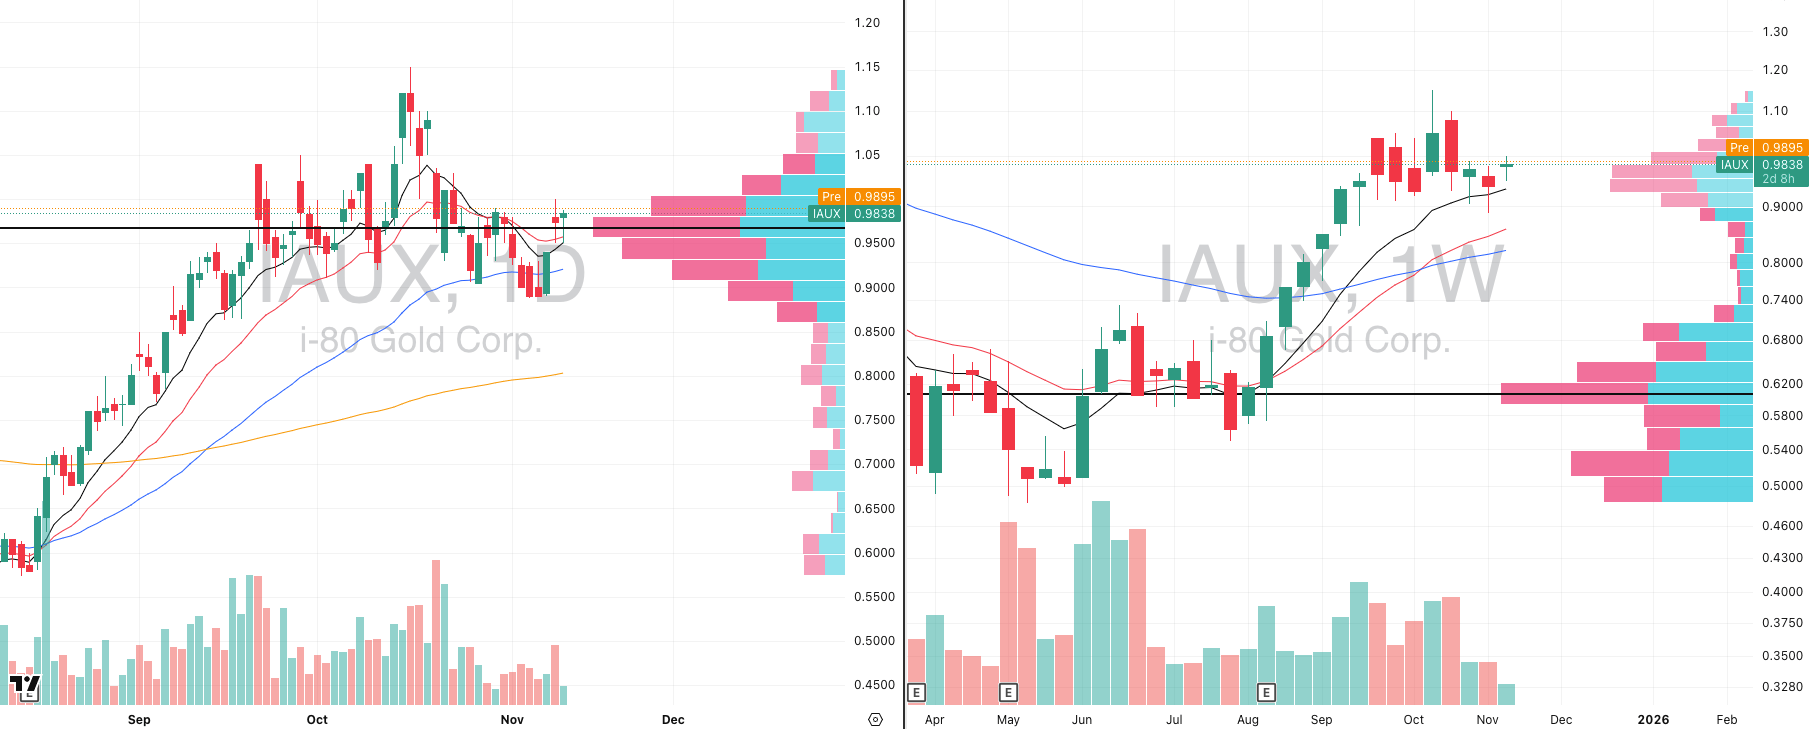
IAUX VRVP Daily & Weekly Chart
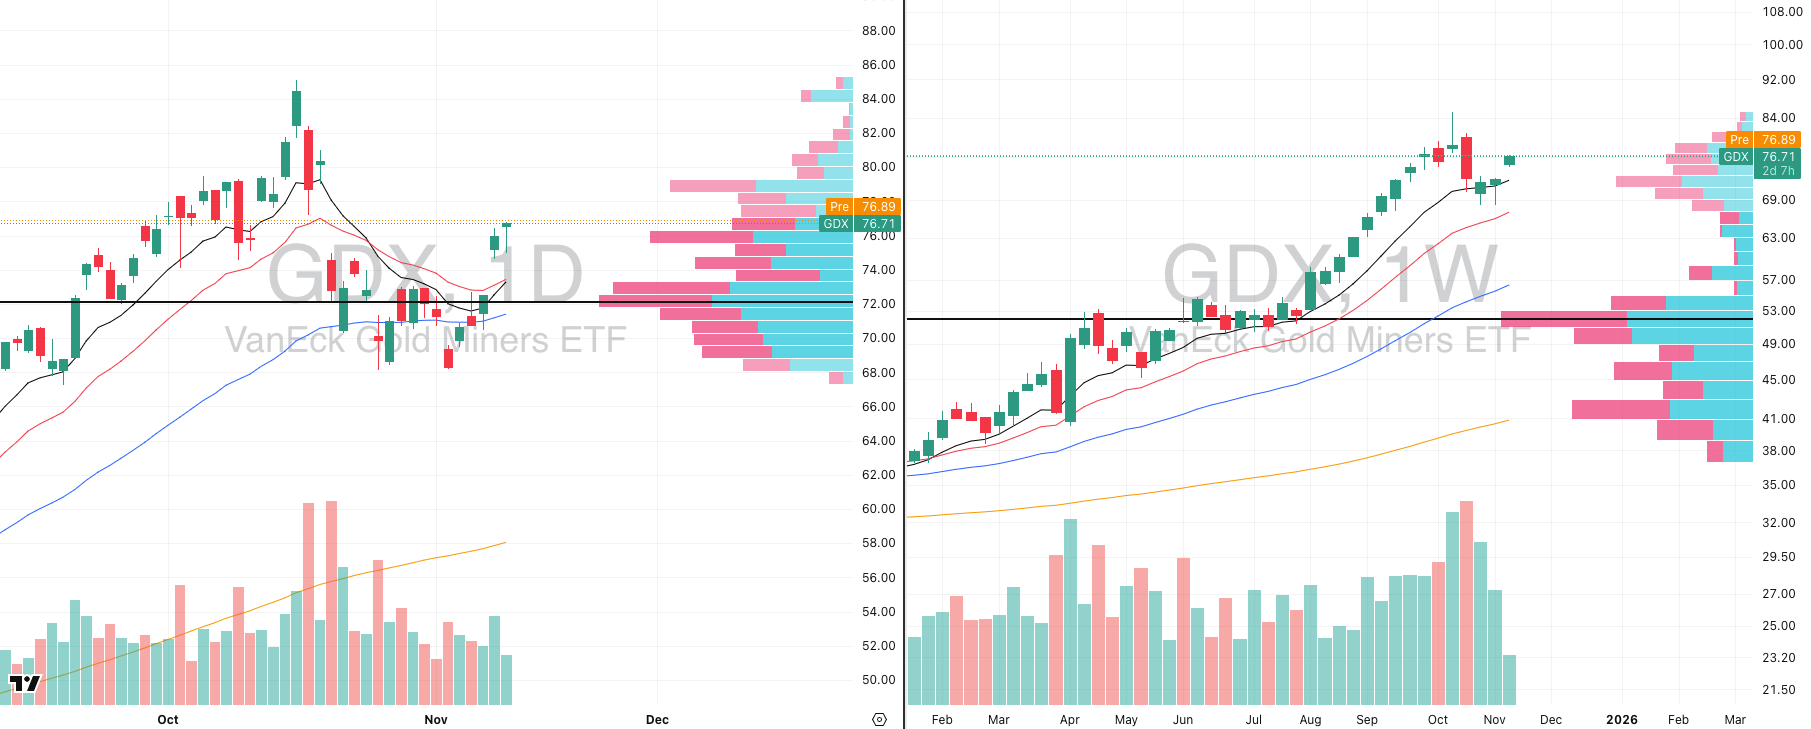
GDX VRVP Daily & Weekly Chart
ADR%: 5.98% | Off 52-week high: -14.5% | Above 52-week low: +190.1%
Stage 2 emergence: IAUX is in the early phase of an intermediate Stage 2 rally, with the weekly chart showing a strong contraction above key EMAs which is a healthy sign of trend development.
Group strength: The entire gold miners group (GDX) is pushing higher in unison, confirming sector momentum and broad-based accumulation in the space.
Buy-on-weakness play: Gold miners, including IAUX, tend to perform better when accumulated on weakness rather than breakout strength due to their choppy intraday behavior and tendency to fade highs before trending (we would avoid opening range high entries).
Recent structure: The last two daily candles on IAUX perfectly illustrate this with early push attempts were sold into before strong recovery, showing rotation-based accumulation rather than breakout chasing on marginal highs.
Momentum profile: With an ADR% near 6%, IAUX stands out as a high-relative-momentum miner, capable of sharp range expansion once buyers fully absorb supply near $1.00.
FOCUSED GROUP
KIE: Year Long Base + Huge Volume Spike
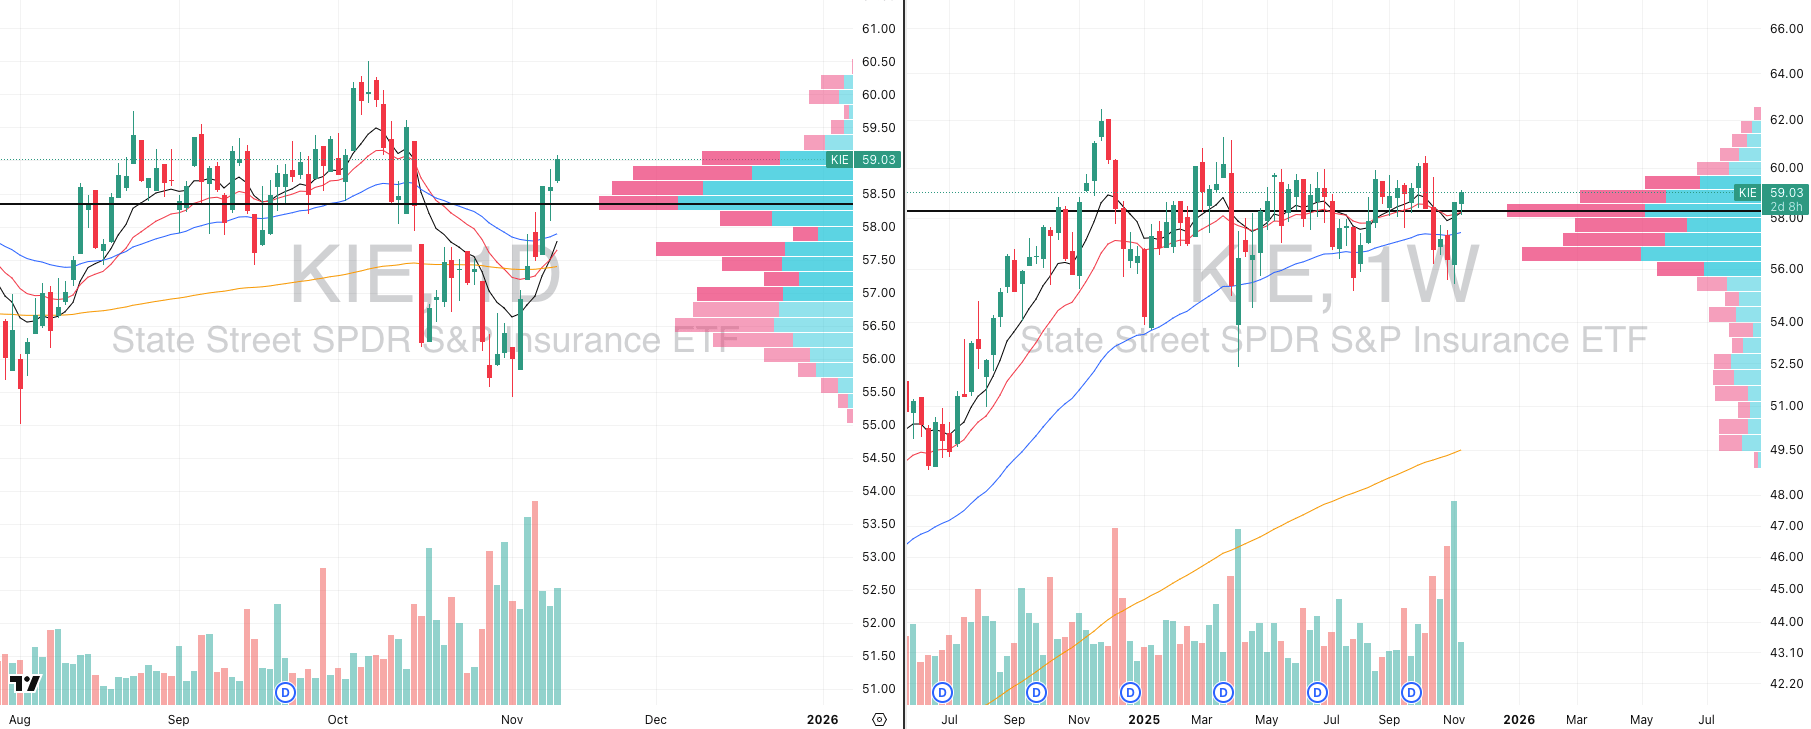
KIE VRVP Daily & Weekly Chart
Unassuming but powerful: Insurance isn’t the flashy sector traders chase, but the weekly chart tells a very different story as KIE has been quietly building a multi-month base stretching back to pre-2025 levels.
Volume confirmation: The past few weeks have shown major spikes in relative volume, signaling major institutional accumulation is taking place in this group without anyone paying attention.
Momentum turn: From last week’s $55.50 lows, KIE has rallied aggressively, reclaiming key moving averages and breaking higher on strong relative strength.
Technical structure: The ETF pulled back perfectly to the rising 10- and 20-week EMAs, found sharp demand absorption, and reversed cleanly on expanding volume- this textbook level price behaviour.
Next step: Focus on top momentum and growth leaders within KIE as these will likely drive the next leg higher as the group transitions from quiet accumulation to active leadership. Ask yourself: which stocks inside KIE are demonstrating the most shallow pullbacks and are the closest to their 52 week highs?

Did you find value in today's publication?This helps us better design our content for our readers |
Reply