- Swingly
- Posts
- Market Isn’t Weak, It’s Just Selective
Market Isn’t Weak, It’s Just Selective


MARKET ANALYSIS
Here’s What You Need To Know

This morning’s focus is the December jobs report, which came in softer than expected but not weak enough to signal economic stress. Payroll growth of 50,000 and a dip in the unemployment rate to 4.4% reinforces the current narrative of a slowing but still stable labor market. Markets are interpreting this as constructive for rate cuts later this year, which is why futures are higher despite recent choppiness.
Rate expectations are once again the primary macro driver. A “not too hot, not too cold” jobs print keeps the Federal Reserve in play for easing, and that is providing a bid to risk assets in the premarket.
That dynamic is precisely why we continue to see chop rather than trend. Strength is emerging, but it is selective, rotational, and often short-lived. Rallies are working in specific areas, while others stall quickly.
Tariff risk remains a background variable, with a potential Supreme Court ruling on Trump-era tariffs still unresolved. This uncertainty continues to keep parts of the manufacturing and industrial complex in a wait-and-see mode, which helps explain why we are seeing selective strength rather than a synchronized market advance.
We are also watching political intervention more closely than usual. Trump’s comments around mortgage bond purchases and direct involvement in credit markets add another layer of uncertainty. These are not normal policy signals, and markets are still digesting what is actionable versus what is rhetoric.
The bulk of the strength right now is coming from small-cap and mid-cap areas, not mega-cap tech. Even within those segments, participation is uneven. Certain industry groups and names are pushing higher decisively, while others remain range-bound. This is not broad-based strength, but it is real strength nonetheless.
Our scans reflect this clearly. We are seeing clusters of sectors and subsectors moving higher together, but not in a synchronized, index-wide fashion. That is why the right approach here is not index-level conviction, but targeted exposure to leaders within leading pockets of the market.
Nasdaq

QQQ VRVP Daily & Weekly Chart
56.86%: over 20 EMA | 56.86%: over 50 EMA | 58.82%: over 200 EMA
Looking at the QQQ first, the cap-weighted Nasdaq had a notably weak session yesterday. We saw a gravestone doji form on Wednesday, January 7th, and price followed through exactly as outlined in yesterday’s report.
The index pulled back roughly 1.83% to test the rising 20-day EMA, where buyers did step in and defend that level.
Relative volume came in around 90%, the highest since January 2nd, and demand showed up at the fastest-moving averages. That tells us something important. While breakout highs are clearly not working and there is more underlying weakness than many expected, this is still not a market setting up for a broad, disorderly selloff.
That said, technology as a trade is simply not being rewarded right now. We previously highlighted strength in equal-weight technology via RSPT, but even that has begun to cool. Capital is rotating away from large and mega-cap tech and into other areas of the market.
S&P 400 Midcap

MDY VRVP Daily & Weekly Chart
74.18%: over 20 EMA | 75.68%: over 50 EMA | 65.41%: over 200 EMA
Mid-caps continue to stand out. The MDY is consolidating in a tight flag following its breakout on Monday, January 5th above 615.
The intermediate trend remains firmly intact, and weekly volume is already running at 100% of average, making this the strongest week since early December. That alone speaks to continued institutional engagement.
The contraction at highs is constructive, but it is worth noting the structure underneath. The visible range volume profile shows a heavy concentration of prior buying above 627, with a meaningful imbalance between upside and downside volume.
That creates the risk of supply emerging if price revisits that zone, as trapped longs look to exit. Even so, mid-caps remain one of the strongest areas of the market and should be a primary focus if you are looking for exposure down the risk curve rather than in large caps.
One important caveat is breadth. Roughly three-quarters of mid-cap stocks are currently trading above both their 20-day and 50-day moving averages. That is objectively extended. While it confirms strength, it also raises the probability of either a short-term pullback or a time-based consolidation rather than immediate continuation.
Russell 2000
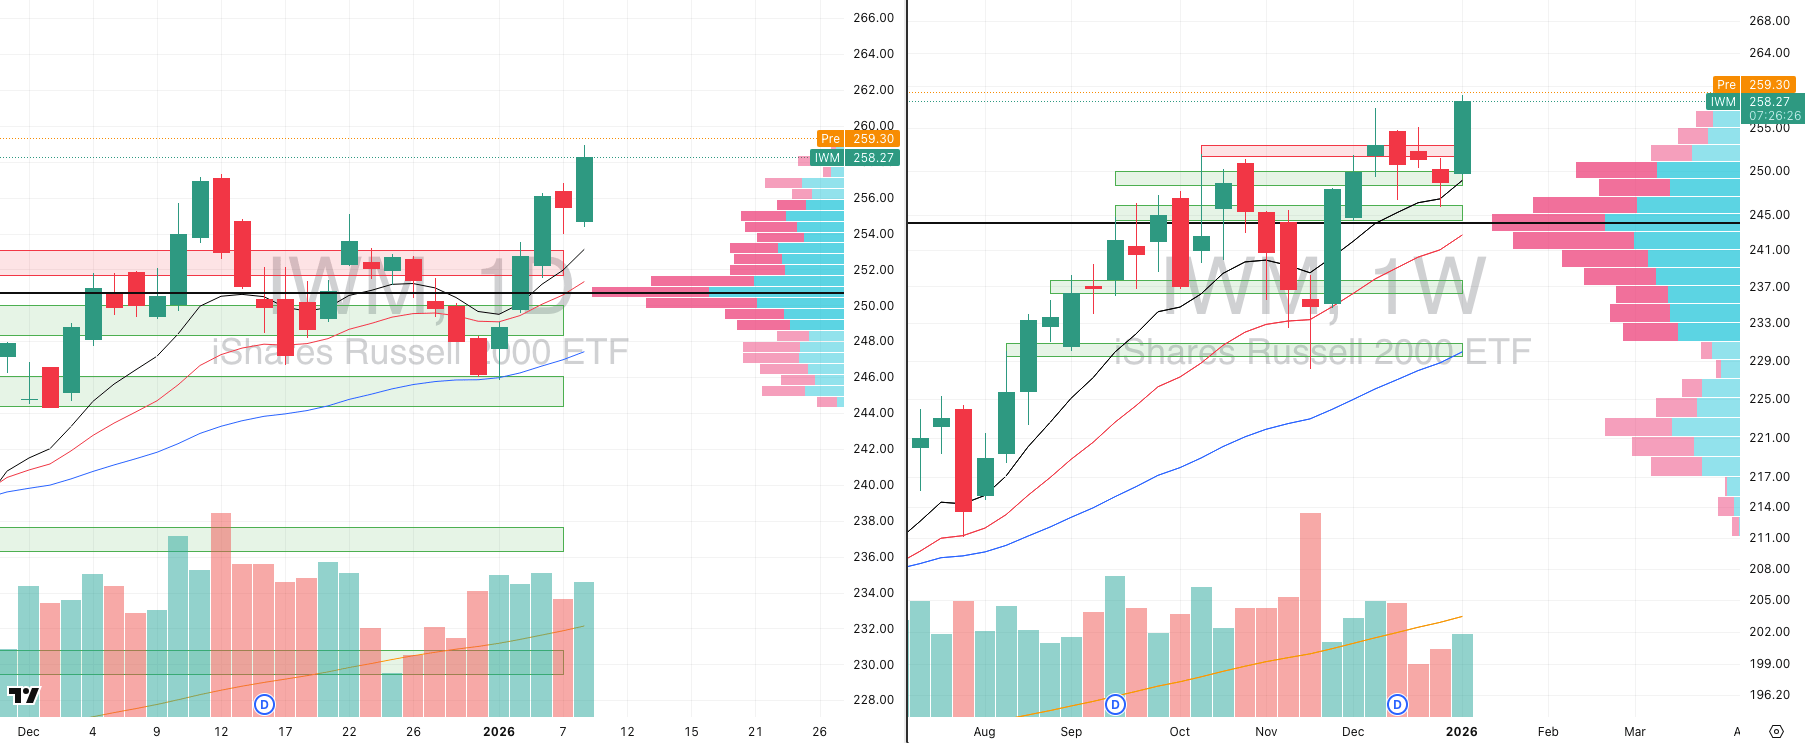
IWM VRVP Daily & Weekly Chart
60.92%: over 20 EMA | 68.38%: over 50 EMA | 65.75%: over 200 EMA
Small caps are slightly less extended but arguably even more compelling from a relative strength perspective. Around 60% of stocks are above the 20-day EMA and 68% above the 50-day EMA, which is strong without being overheated.
The IWM pushed to all-time highs yesterday while mid-caps paused just below theirs, and we are seeing follow-through in premarket action again today.
Yesterday’s breakout in IWM was clean and linear, with relative volume near 93%. The move followed a successful test of the 10-day EMA and a reclaim of the 248.65 level, allowing price to expand higher on the weekly chart with statistically meaningful volume. We are already trading at 86% of the 20-week average volume, which reinforces the validity of the move.
From our perspective, small caps are currently the number one capitalization group to focus on. The divergence is becoming clearer by the day. Large caps are struggling, mega-cap tech is lagging, and capital continues to flow into smaller and mid-cap names.
Even the breadth data confirms this shift, with the Nasdaq showing a materially weaker internal picture compared to MDY and IWM.
FOCUSED STOCK
BROS: An Almost 1 Year Long Bull Flag
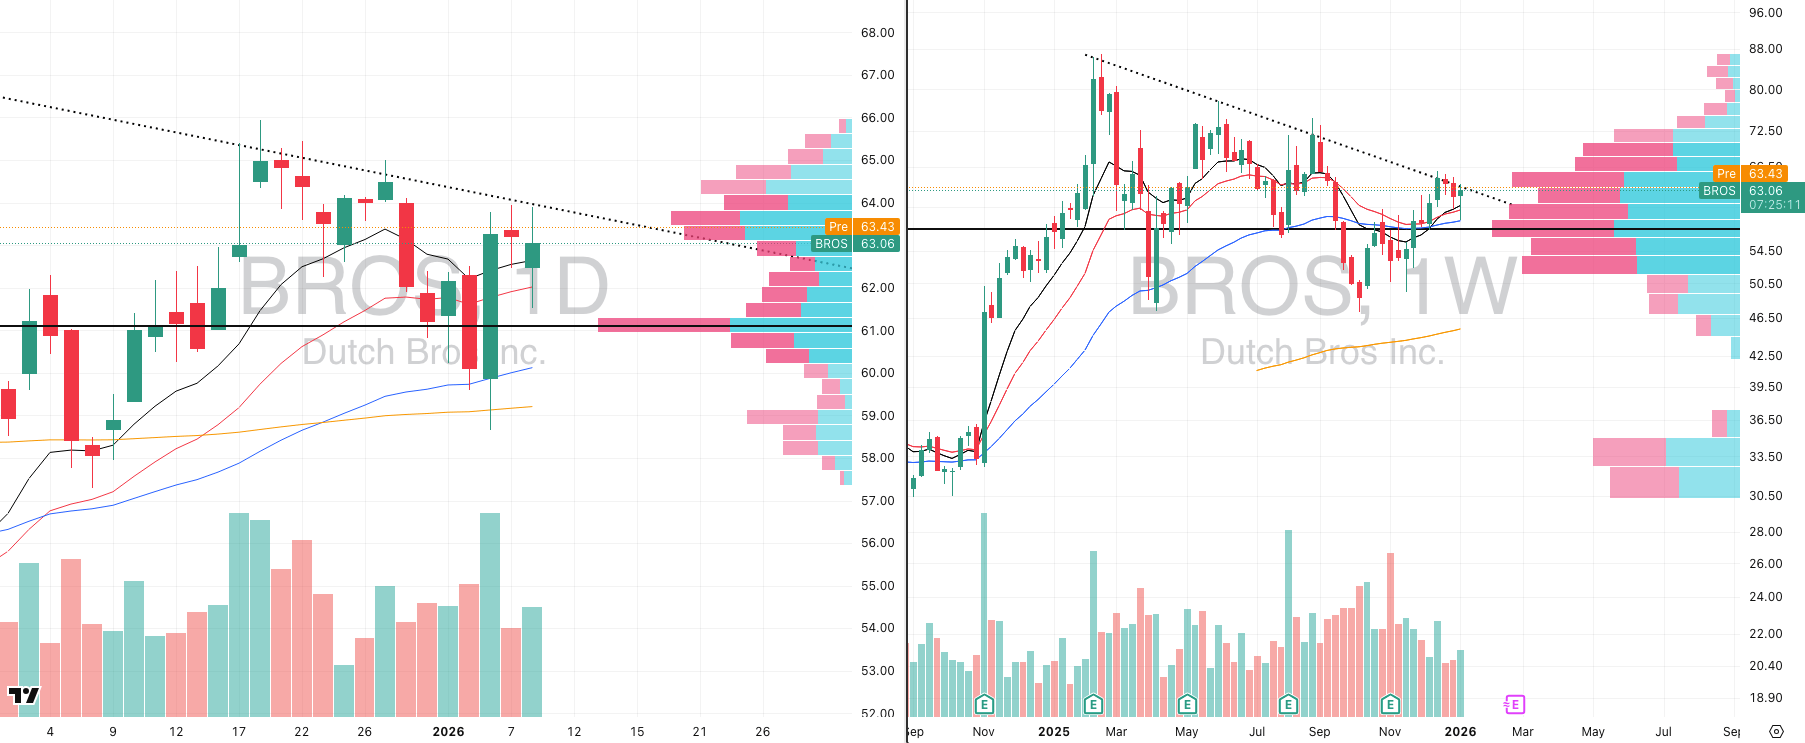
BROS VRVP Daily & Weekly Chart
ADR%: 3.28% | Off 52-week high: -27.4% | Above 52-week low: +33.7%
BROS has been building a long, constructive base since its earnings peak on February 10th, 2025. This has developed into a well-defined contraction on both the intermediary and weekly timeframes, which is exactly the type of structure we want to be paying attention to in the current market.
Over the past four weeks, the stock has attempted to push higher, beginning with the move in the week of December 8th. That advance stalled at a declining level of resistance around 65, which also lines up with a very dense supply zone on the visible range volume profile.
While that resistance has not yet been cleared, what matters is how price has behaved on the pullbacks.
This past week gave us an important sequence. On Monday, January 5th, BROS pushed lower, then found support precisely at the 200-day EMA near 59.10 on Tuesday, January 6th.
That session produced a bullish engulfing candle and launched a sharp reversal, with the stock rallying roughly 9% in a single day. That move was nearly three times its average daily range, which immediately puts it on our radar.
Volume confirmed the move with that reversal day printed approximately 140% of the 20-day average volume, signalling genuine demand rather than a low-liquidity bounce.
While price is still contending with the declining resistance overhead, it is important to note that the 50-week EMA near 58.40 has held cleanly, alongside support from both the 10-week and 20-week moving
FOCUSED GROUP
XLP: Defensives Showing Major Reversal

XLP VRVP Daily & Weekly Chart
XLP printed one of the most aggressive bullish engulfing candles we have seen anywhere in the market recently, and it deserves attention.
On Wednesday, price pushed down into near two-month lows, tagging 76.46. That move looked vulnerable, but yesterday’s session completely reversed that weakness. XLP closed with a powerful bullish engulfing candle on approximately 108% of its 20-day relative volume, confirming that the move was driven by real demand rather than short covering.
The range expansion is particularly notable. XLP printed a 2.83% intraday range, while its average daily range is only 0.85%. That puts yesterday’s move at roughly 3.3 times its normal daily range, or about 330% of ADR, which is exceptionally large for a traditionally defensive ETF like consumer staples.
Structurally, XLP has been building a constructive base since November 24th. This formation can be viewed either as a flag or as a clean inverse head and shoulders pattern:
The left shoulder formed during the September 8th to October 20th period
The inverse head developed between October 27th and November 17th
The right shoulder has taken shape from November 24th through January 5th
This structure now appears to be resolving higher. Based on the current setup, the most likely near-term move is a push toward the point of control at 79.43, representing approximately 1.2% upside from current levels.
What strengthens this signal further is what we are seeing beneath the surface. Our scans are showing an increasing number of individual consumer staple names beginning to push higher, at a time when growth and large-cap technology remain choppy and unreliable.

Did you find value in today's publication?This helps us better design our content for our readers |
Reply