- Swingly
- Posts
- Ignore the Indices: Where the Real Strength Is
Ignore the Indices: Where the Real Strength Is

OVERVIEW
What You Need To Know
Macro: No new catalysts; shutdown delays data. Indices quiet, but leadership is showing up in individual stocks (semis, AI infra, select growth).
Nasdaq (QQQ/QQQE): Consolidating near highs after clearing resistance; strong breadth (52–59% > EMAs) and broad participation confirm leadership.
Midcaps (MDY): Weakest group. Stuck at $595 demand, repeated failed bounces, poor breadth (34–56%). Institutional flows rotating away.
Small Caps (IWM): Stronger than MDY but stalling under $246–247. Breadth better than MDY (37–56%) but still lagging Nasdaq. Coil forming, but secondary trade.
Focused Stock – NET: Textbook weakness entry at $217.59 using multi-timeframe demand zone. Tiny 0.15% stop produced 11R in 1 session. Daily trend intact.
Focused Group – XLV: Just transitioned from Stage 1 base into Stage 2 breakout (+6% in a week). Volume confirms institutional rotation; post-breakout volatility compression suggests continuation higher.

MARKET ANALYSIS
No New Catalysts, Stock Leadership Tells the Story

Again, not much in the way of fresh macro catalysts. The U.S. government shutdown continues, delaying key economic releases like CPI, leaving investors data-blind ahead of the October 29th FOMC meeting.
Fed officials (Waller, others) are talking rate cuts but stressing caution given conflicting signals- softening labor vs strong GDP. None of this shifts the near-term trading landscape.
The real story is beneath the indices: individual stock strength is far more telling than the macro tape right now.
Leadership clusters are working e.g. semis, AI infrastructure, and select growth names continue to print powerful setups and breakouts, while the indices themselves are just digesting near highs.
Nasdaq
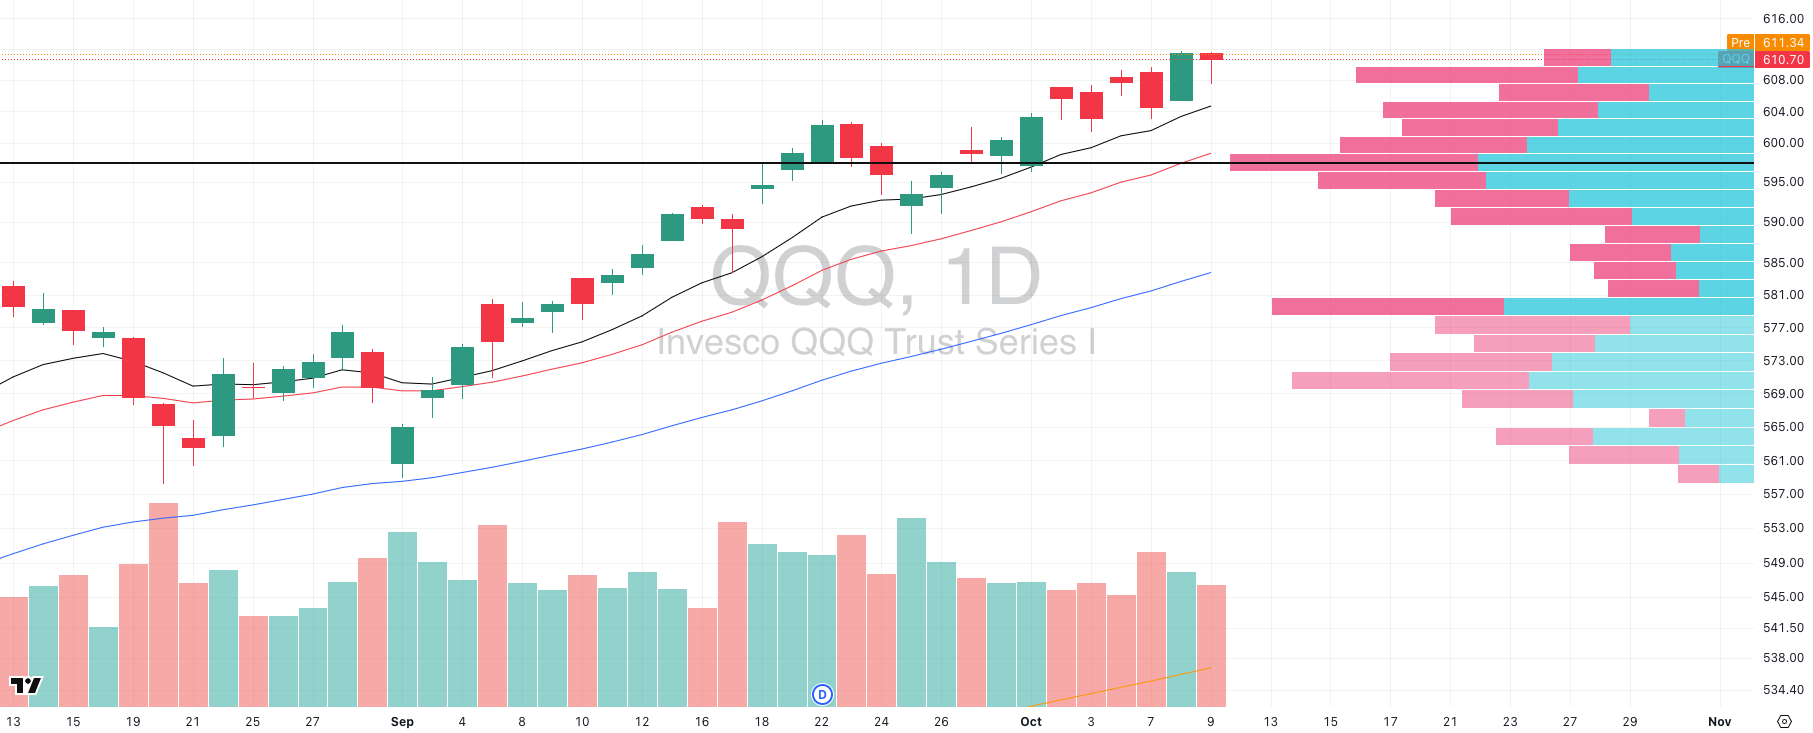
QQQ VRVP Daily Chart
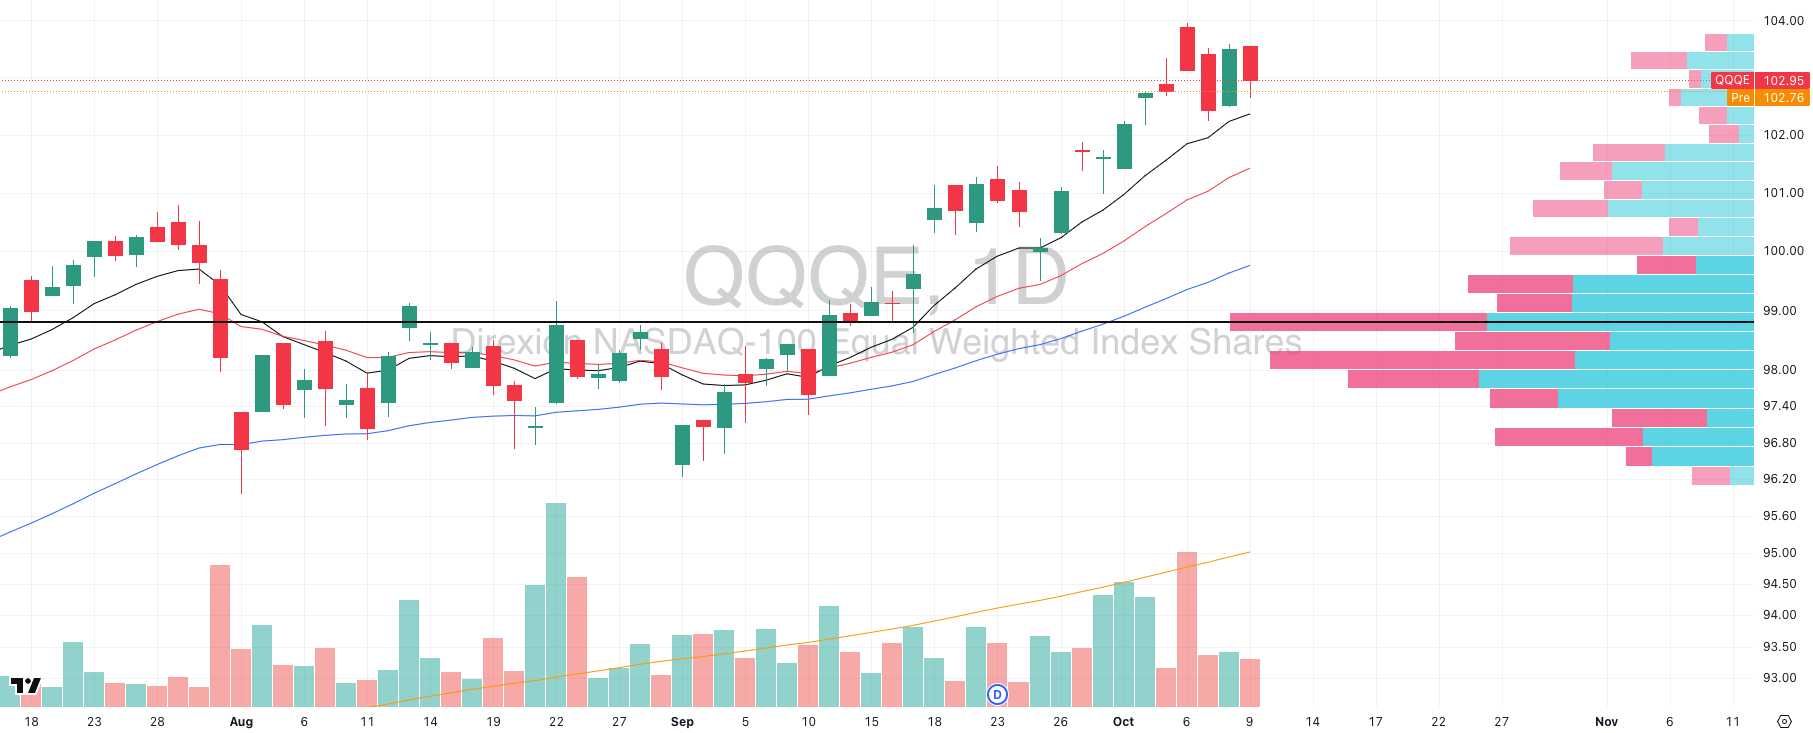
QQQE VRVP Daily Chart
% over 20 EMA: 52.47% | % over 50 EMA: 54.45% | % over 200 EMA: 59.40%
Nothing concerning here as both QQQ ($611.33) and QQQE ($102.95) are digesting Wednesday’s thrust higher in expected fashion.
QQQ cleared $605 resistance with a red hammer candle showing strong demand, and is now consolidating tightly near all-time highs.
The daily chart shows controlled sideways action with volume balanced, price holding above all rising EMAs, no signs of distribution.
Sellers are absorbed quickly, and buyers remain engaged near highs.
S&P 400 Midcap
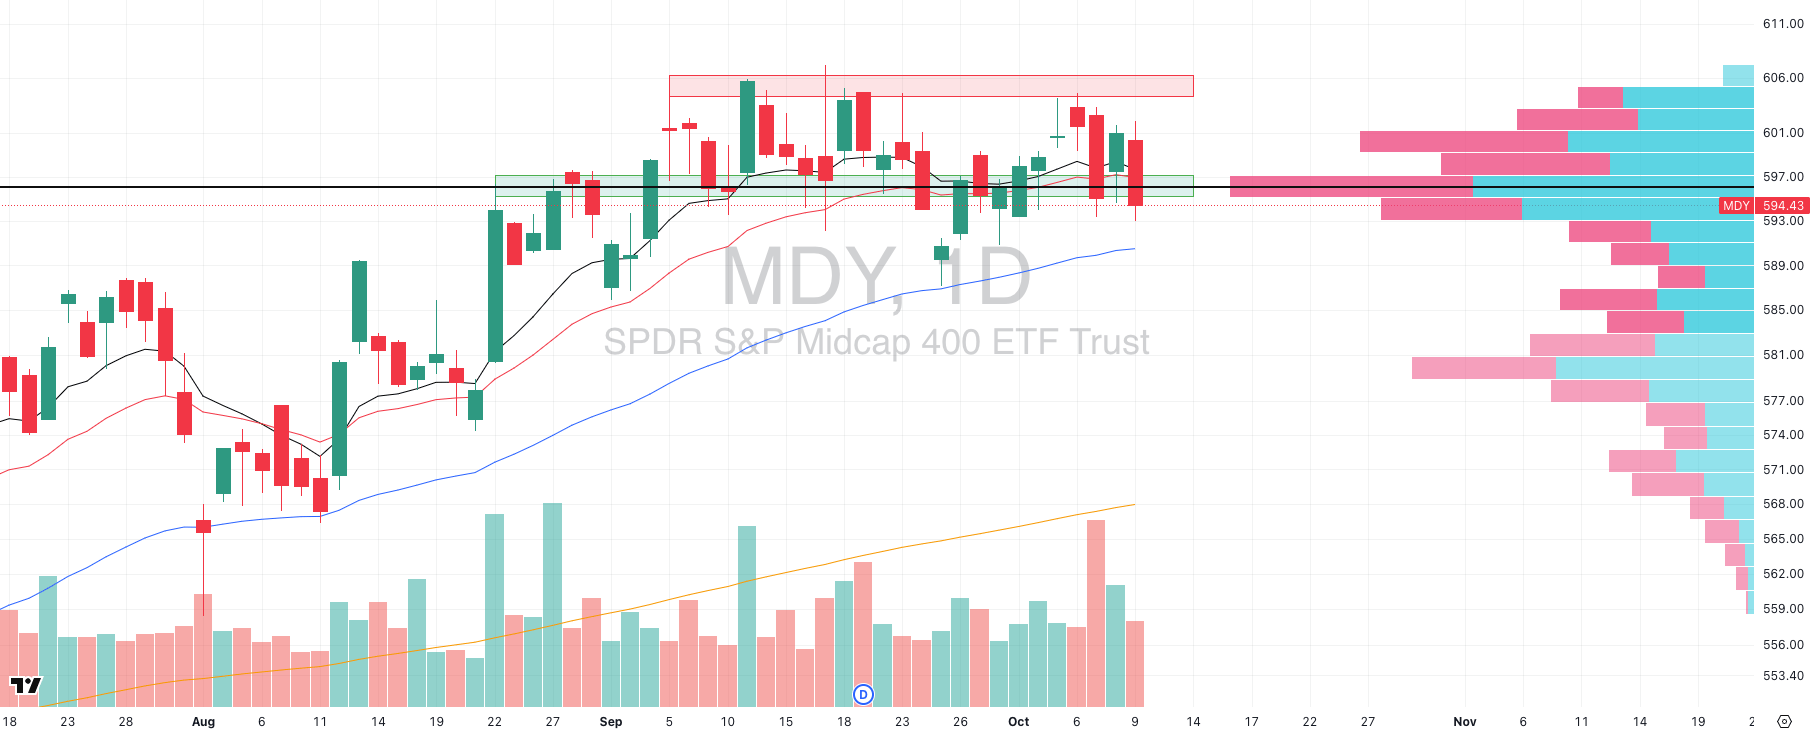
MDY VRVP Daily Chart
% over 20 EMA: 34.41% | % over 50 EMA: 41.89% | % over 200 EMA: 56.85%
Midcaps (MDY) remain the weakest capitalization group by far. While large-cap tech pushes to fresh highs, MDY can’t attract a sustainable bid.
Price continues to drift into the $595–597 demand zone, the visible range POC where the most volume has traded.
But the pattern is repetitive: bounces off this shelf get sold immediately, with $601–607 acting as persistent overhead supply.
Volume on rallies shows no conviction. Each retest of $595 weakens support further.
This relative weakness is glaring when compared with QQQ/SPY. Institutional money is clearly rotating away from midcaps toward large-cap tech and growth.
With opportunity cost high, we’re avoiding midcap exposure entirely as capital is better deployed in leaders making new highs than in laggards stuck at support.
Russell 2000
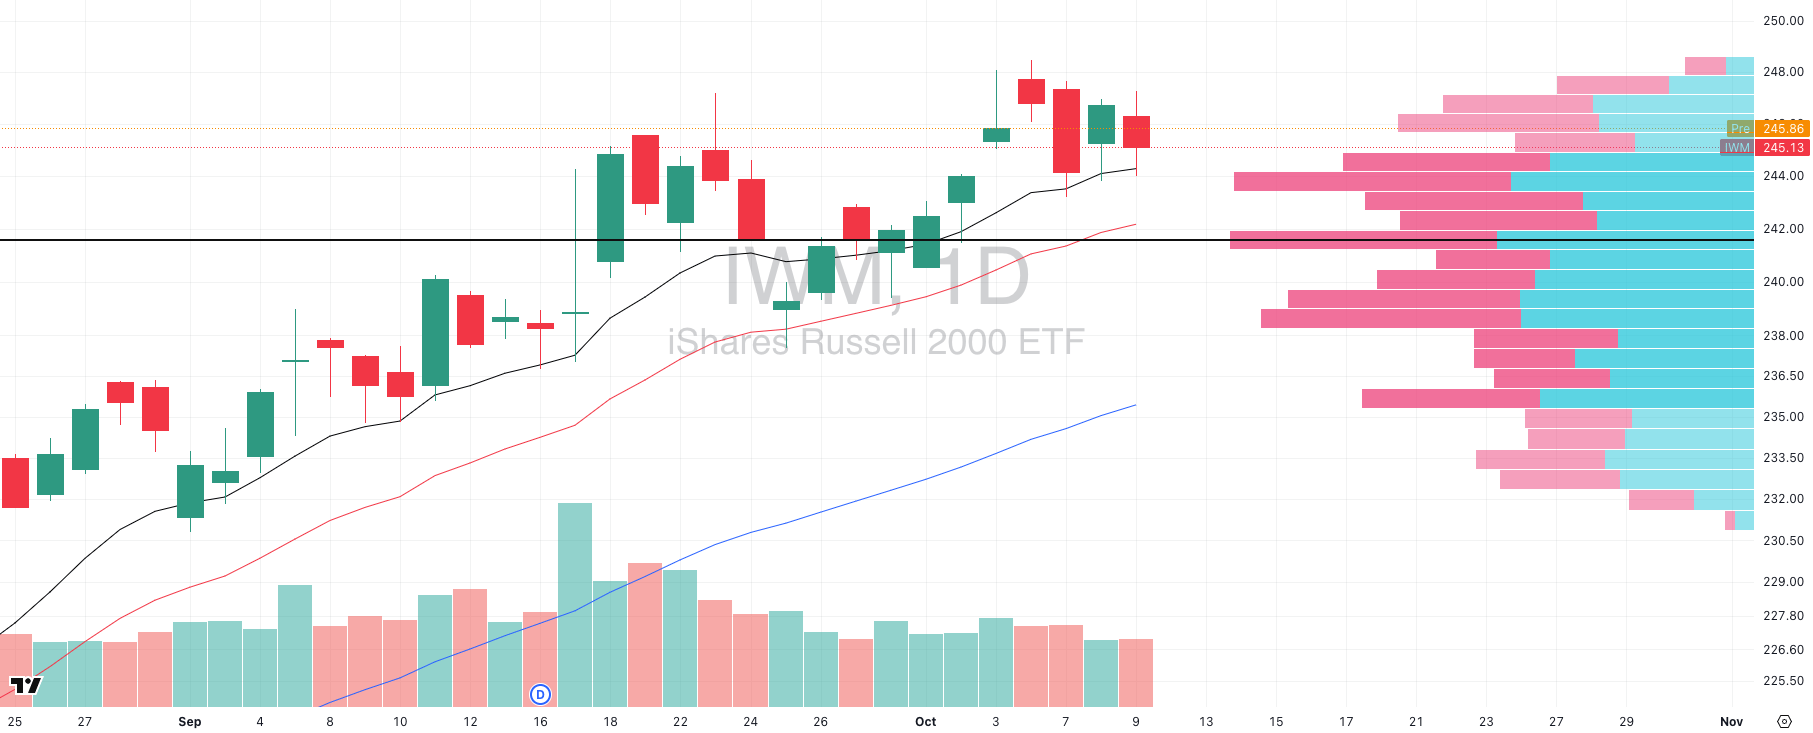
IWM VRVP Daily Chart
% over 20 EMA: 37.55% | % over 50 EMA: 47.37% | % over 200 EMA: 56.64%
Small Caps (IWM) are stronger than midcaps but still stalling beneath overhead supply.
Price has chopped sideways under $246–247, with repeated rejections and no follow-through showing evidence sellers are defending this zone.
The volume profile shows a demand shelf at $242 (POC), but each bounce is fading, suggesting absorption over aggressive buying.
Technically, IWM still holds above rising 10- and 20-day EMAs, but momentum is flattening.
Instead of clean expansion, the last week has been overlapping candles with lower highs- though we are seeing a short term volatility contraction forming as higher lows forming- often a precursor to an explosive move (which we would expect to be to the upside).
Breadth comparison (% of components above EMAs):
Midcaps (MDY): 34.41% > 20 EMA | 41.89% > 50 EMA | 56.85% > 200 EMA
Small Caps (IWM): 37.55% > 20 EMA | 47.37% > 50 EMA | 56.64% > 200 EMA
Nasdaq (QQQ): 52.47% > 20 EMA | 54.45% > 50 EMA | 59.40% > 200 EMA
IWM looks healthier than midcaps, but it still lags far behind Nasdaq strength across every timeframe.
The near-term divergence is most striking as the QQQ has ~15% more components above the 20 EMA than IWM.
Bottom line: Small caps are coiling, but from a weaker base. Until $246–247 breaks with volume, they remain a secondary trade. Institutional flows continue to concentrate in Nasdaq leadership, not in mid or small caps.
Wall Street Isn’t Warning You, But This Chart Might
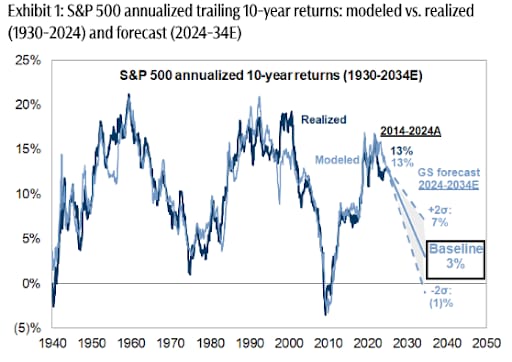
Vanguard just projected public markets may return only 5% annually over the next decade. In a 2024 report, Goldman Sachs forecasted the S&P 500 may return just 3% annually for the same time frame—stats that put current valuations in the 7th percentile of history.
Translation? The gains we’ve seen over the past few years might not continue for quite a while.
Meanwhile, another asset class—almost entirely uncorrelated to the S&P 500 historically—has overall outpaced it for decades (1995-2024), according to Masterworks data.
Masterworks lets everyday investors invest in shares of multimillion-dollar artworks by legends like Banksy, Basquiat, and Picasso.
And they’re not just buying. They’re exiting—with net annualized returns like 17.6%, 17.8%, and 21.5% among their 23 sales.*
Wall Street won’t talk about this. But the wealthy already are. Shares in new offerings can sell quickly but…
*Past performance is not indicative of future returns. Important Reg A disclosures: masterworks.com/cd.
FOCUSED STOCK
NET: How To Enter On Weakness
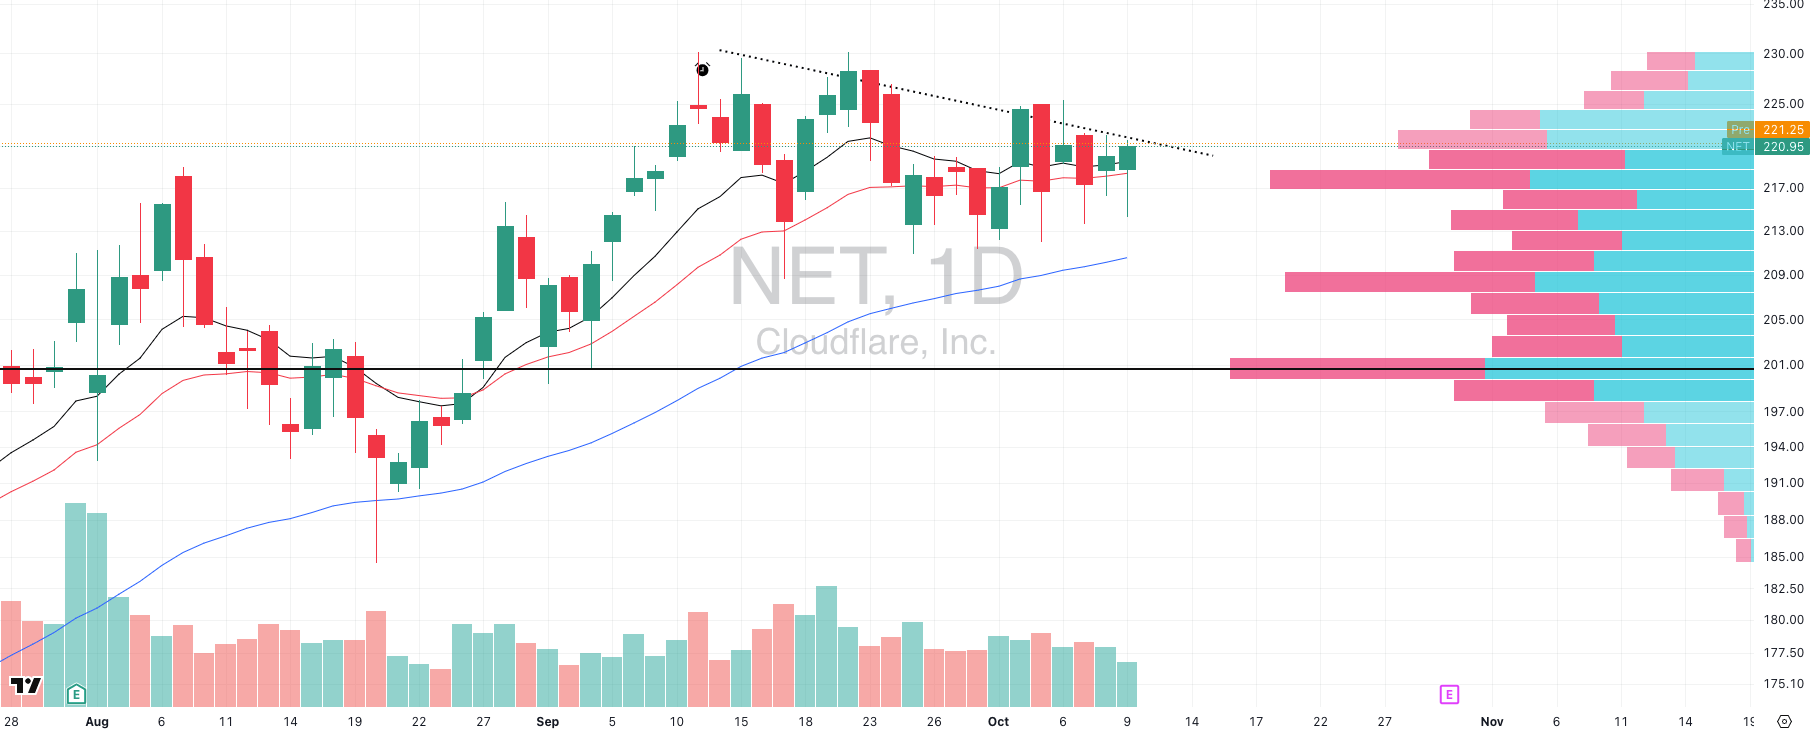
NET VRVP Daily Chart
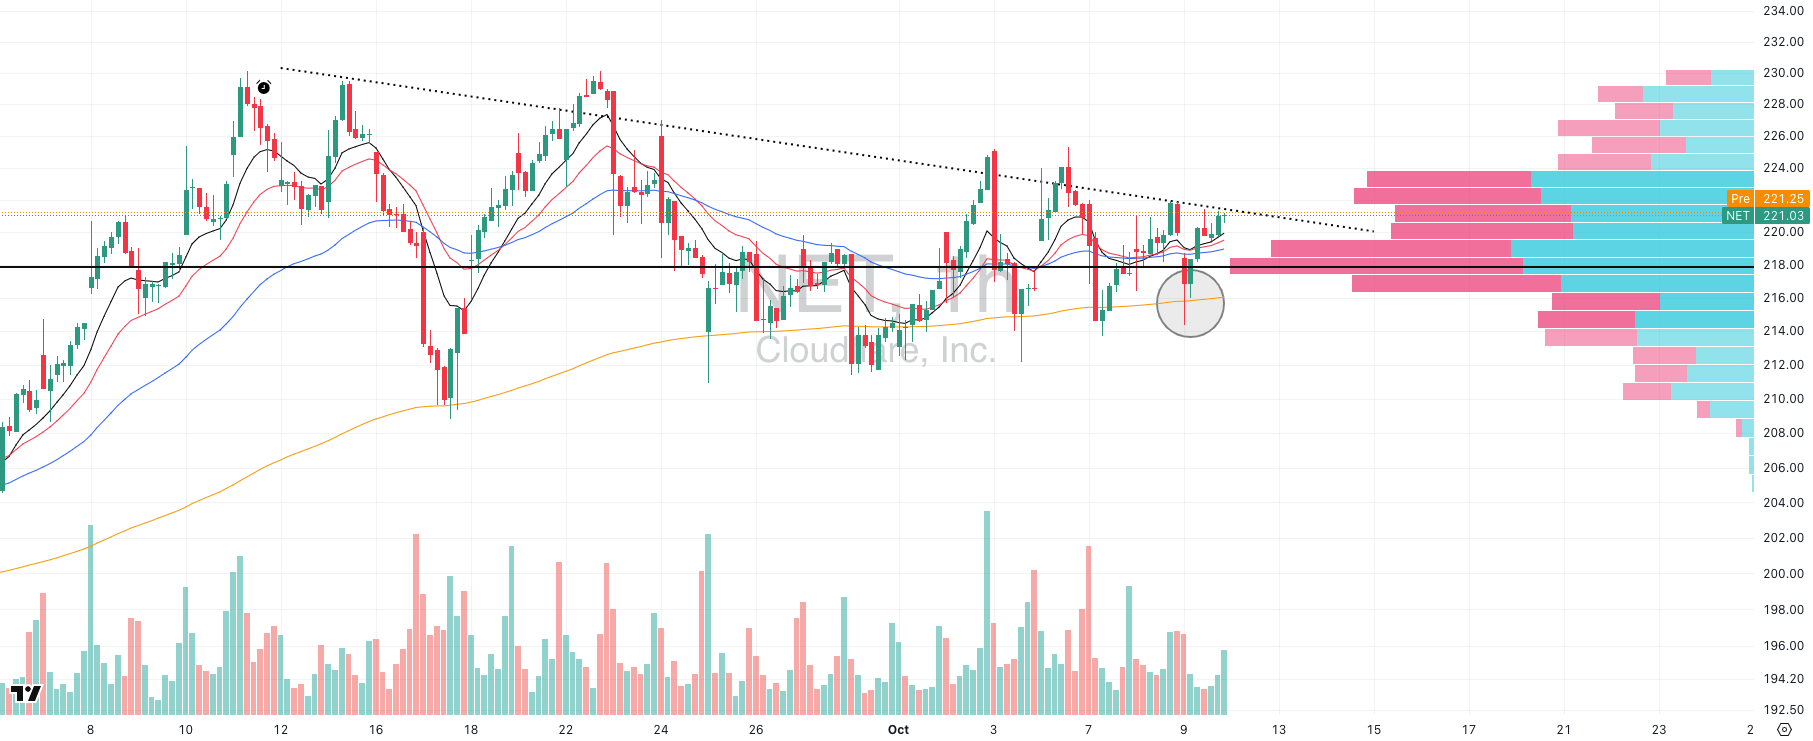
NET VRVP Hourly Chart
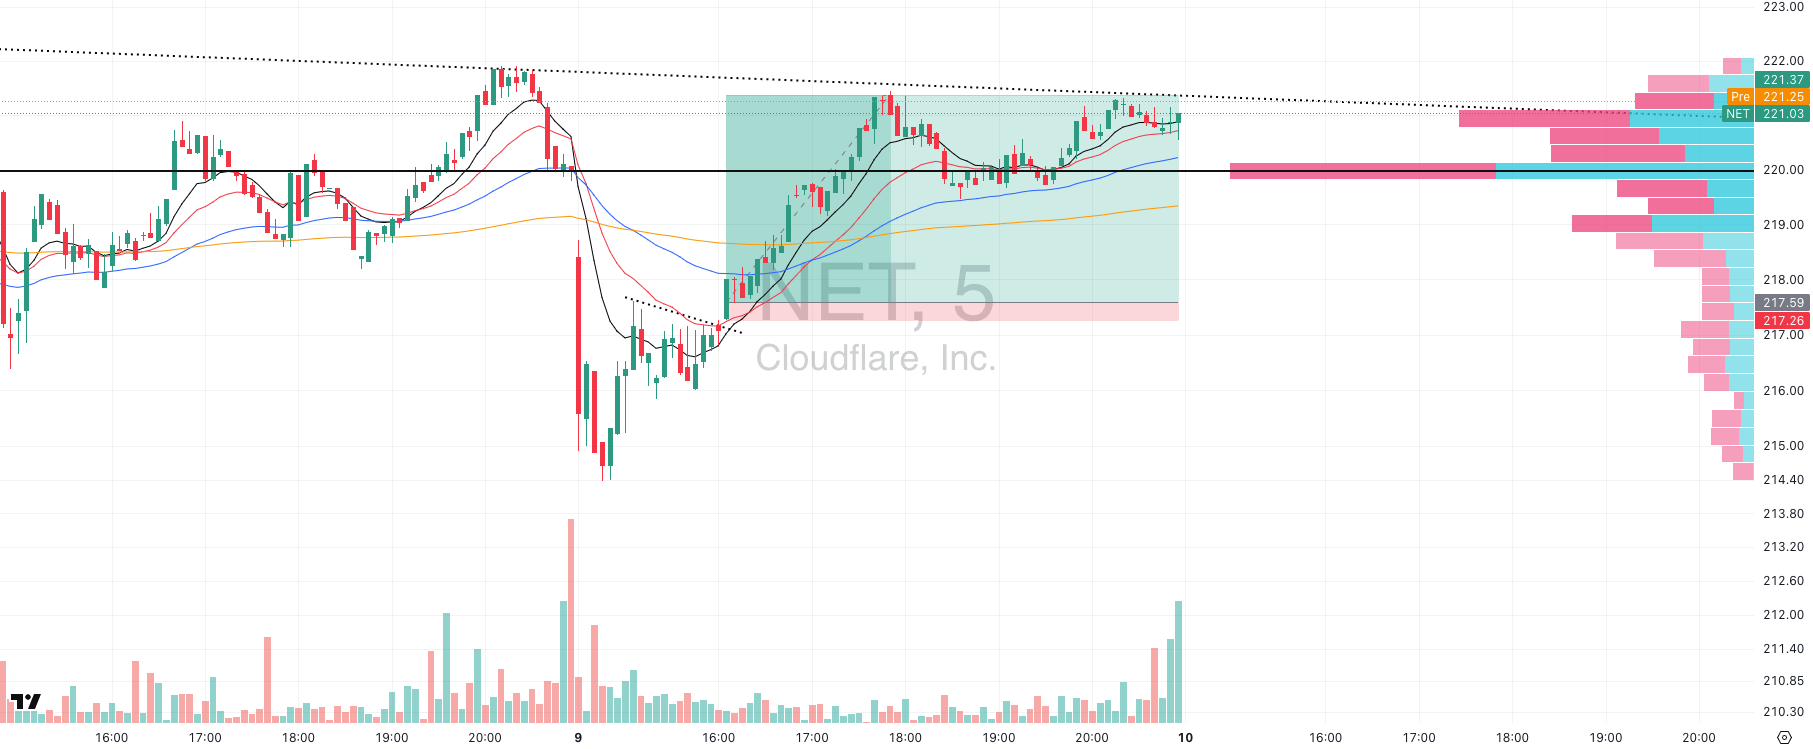
NET VRVP 5-Min Chart
ADR%: 3.39% | Off 52-week high: -4.0% | Above 52-week low: +179.1%
Sector context: Cybersecurity is a leading group, and NET was our top candidate for a weakness entry. The $214–217 zone has repeatedly attracted buyers since mid-September, aligning with the hourly 200-EMA and a high-probability demand area.
Multi-timeframe setup:
Daily: Structure intact, holding above $214 with trend confirmation from rising MAs.
Hourly: Multiple successful tests of the 200-EMA reinforced the demand zone.
5-min execution: After dipping into demand, NET compressed under the 20-EMA. A breakout candle with volume expansion triggered the entry at $217.59.
Risk/Reward:
Entry: $217.59
Stop loss: $217.26 (0.15% risk, $0.33 per share)
Current price: $221.03 (+1.74%)
Result so far: Over 11R on day 1
Next steps: The hourly 200-EMA now acts as a trailing stop. As long as NET holds above it, the trade remains active.
Takeaway: This trade shows how to compress risk on a big setup.
The daily chart gave us the structure, but drilling down to the 5-min chart shrank the stop to just 0.15%.
That’s the difference between booking a standard 2–3R swing and capturing an 11R outlier in two sessions.
The geometry really matters: when you anchor to the larger timeframe trend but define risk on the smallest timeframe, even modest price movement creates parabolic returns on risk.
FOCUSED GROUP
XLV: The Momentum Leading Group
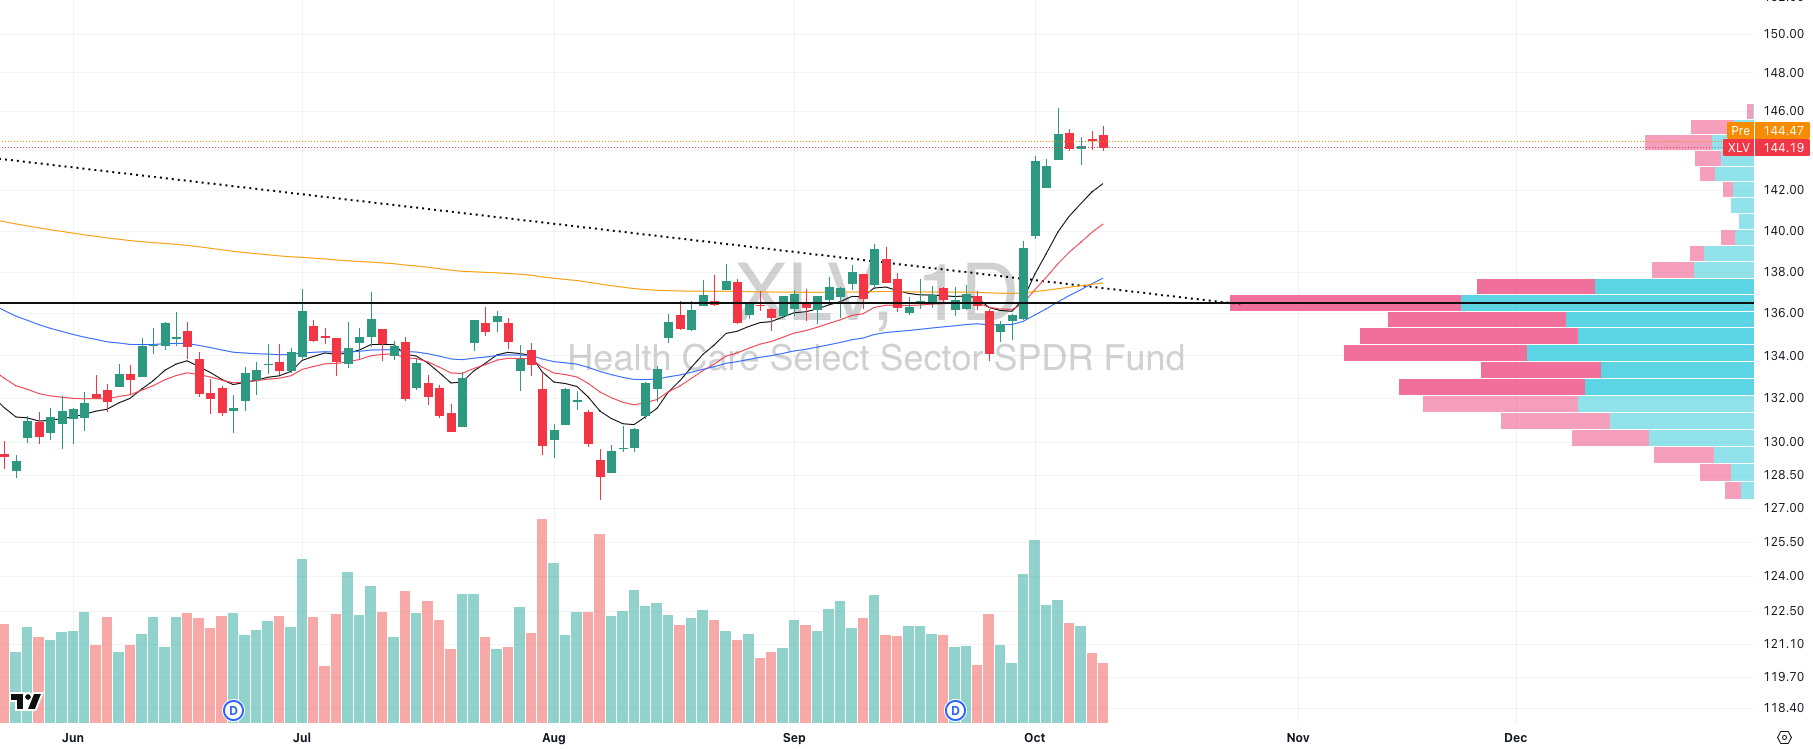
XLV VRVP Daily Chart
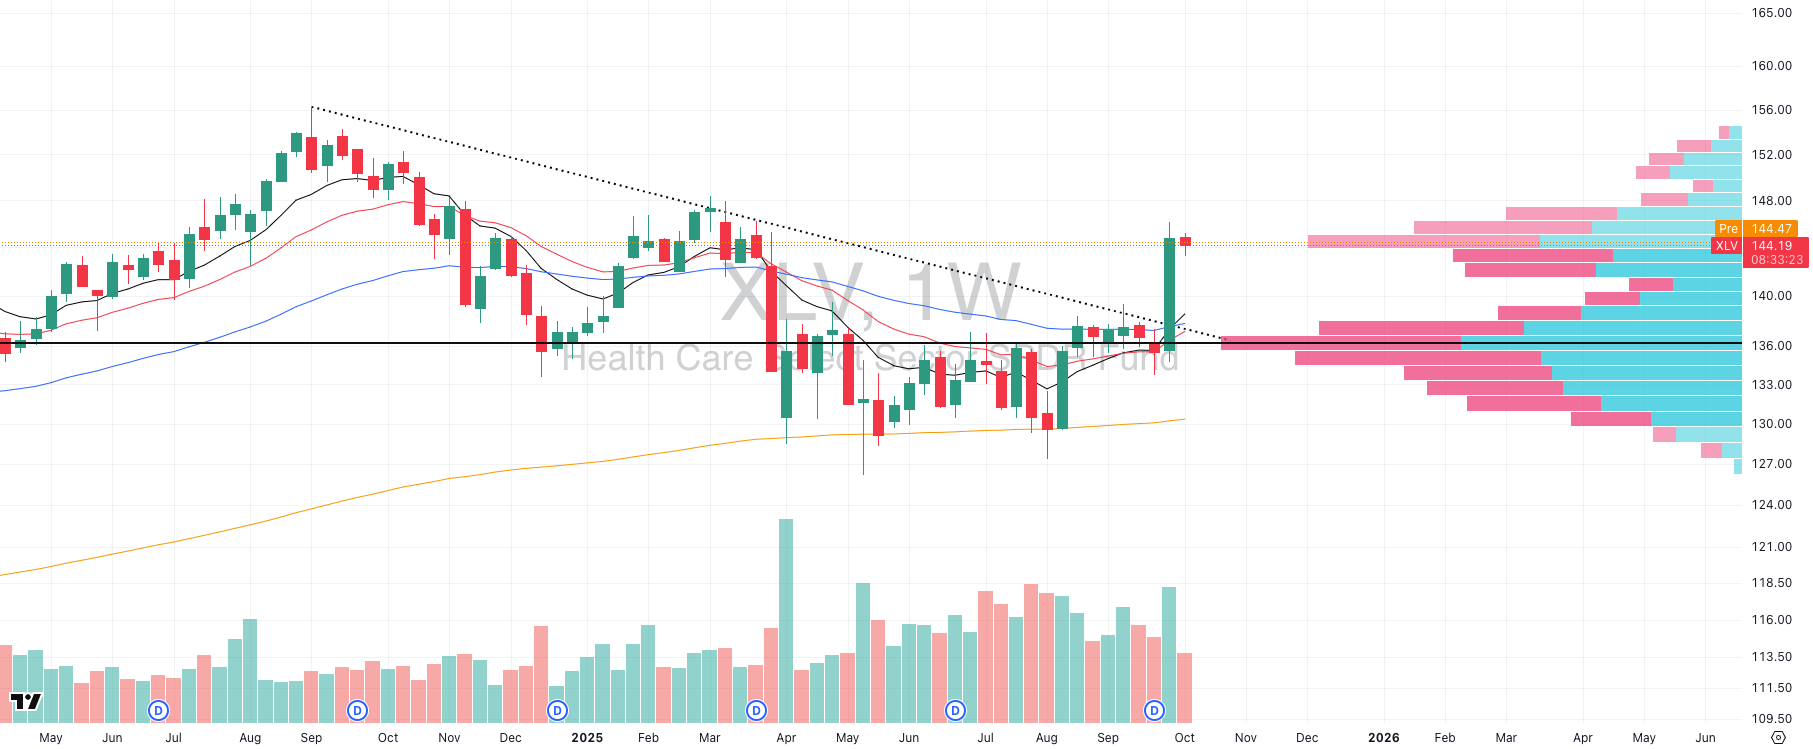
XLV VRVP Weekly Chart
Structural Shift: XLV has transitioned from a multi-month Stage 1 base ($130–137) into Stage 2 advance, breaking above $136 resistance on elevated volume. That volume expansion validates institutional rotation rather than retail momentum. Price is already +6% in a week, which fits the profile of an early markup thrust.
Volatility Profile: Post-breakout, XLV is contracting into an ultra-tight range near highs while volume dries up. That combination with a fresh breakout, rapid expansion, then severe volume contraction, is statistically one of the most reliable precursors to secondary legs higher. The pattern indicates exhaustion of supply, not demand.
Breadth & Rotation: What makes this breakout different from defensive “catch-up” moves is its breadth. Participation spans both pharma and biotech, not just large-cap defensive staples. This shows systematic allocation into the sector rather than idiosyncratic stock strength (broad based strength inside the group).
Backtests across sectors show that volatility compression within the first 2–3 weeks of a Stage 2 (mark up) breakout tends to precede outsized continuation (3–6x the initial thrust, on average).
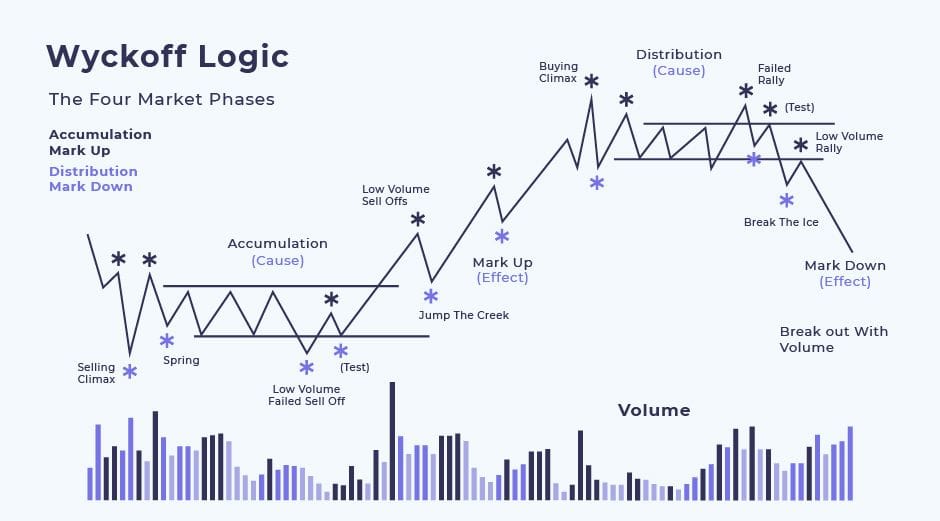
Wyckoff’s model reads this as the Composite Operator completing accumulation and beginning markup.

Did you find value in today's publication?This helps us better design our content for our readers |
Reply