- Swingly
- Posts
- If This Fails, Growth Is in Trouble
If This Fails, Growth Is in Trouble
In partnership with


MARKET ANALYSIS
The Most Important Week In Months

FOMC is the only macro input that matters this week. Markets are heading into the Fed’s final policy meeting of 2025 with rate-cut expectations firmly priced in. Futures imply ~88–90% odds of a 25bp cut on Wednesday. Directionally, this removes uncertainty, but not necessarily volatility as the reaction will hinge on forward guidance rather than the cut itself.
Rates expectations are supportive, but bonds are not confirming. Despite multiple Fed cuts in recent months, long-dated Treasury yields remain elevated (10Y ~4.15%). This disconnect matters tells us financial conditions are not easing as cleanly as equities may be assuming. That can keep a cap on breadth and makes rallies fragile especially with the relatively low volume we are seeing
Inflation data helped sentiment, but it’s largely backward-looking now.
Softer PCE supported last week’s rally, but traders are already moving past it. The Fed has clearly shifted to a “wait and assess” posture beyond this meeting, and expectations for 2026 cuts remain uncertain.Sector leadership is under quiet debate. Notably, longer-term strategists (e.g. Yardeni) are starting to question persistent Mag 7 dominance, calling for more balanced exposure toward financials, industrials, and healthcare.
That lines up with what we’re already seeing in relative strength beneath the surface although we do note growth groups are very strong (QTUM, Communications & Tech performed well last week).
Nasdaq
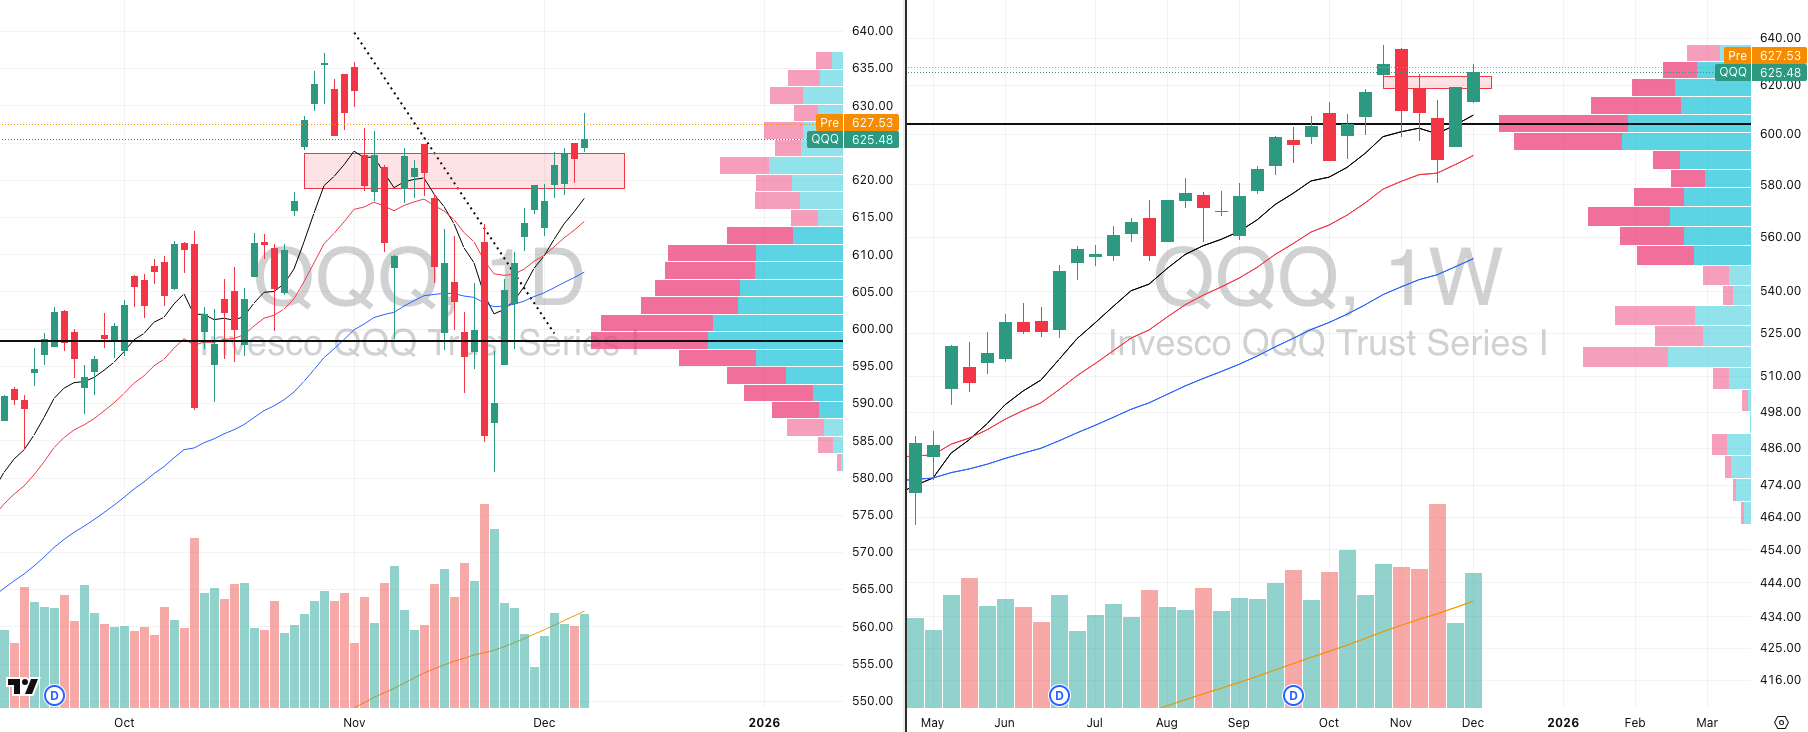
QQQ VRVP Daily & Weekly Chart
67.32%: over 20 EMA | 57.42%: over 50 EMA | 62.37%: over 200 EMA
Friday printed a gravestone doji, but it’s important not to over-interpret this candle. Statistically, gravestone dojis only lead to downside continuation ~51% of the time, making it one of the weaker reversal signals in isolation, especially without follow-through.
Price is now trading back above the prior supply zone around ~$624, which shifts the short-term balance back in favor of buyers. This zone capped multiple attempts last week and has now been reclaimed.
Visible Range Volume Profile confirms a key positive: There is no meaningful volume density above current levels all the way toward prior highs. That lack of overhead supply materially improves the probability of continuation rather than immediate rejection.
Last week’s volume behavior matters. Thanksgiving week volume was predictably suppressed, but the subsequent expansion in relative volume on the push higher signals genuine participation rather than purely mechanical upside.
Weekly structure remains intact. Despite recent volatility, the broader weekly trend is still constructive, with higher-timeframe buyers continuing to defend value rather than distribute into strength.
Short-term volatility ahead of Wednesday’s FOMC is entirely normal and should be expected, especially as this is still a reactive tape until policy risk clears.
From a broader perspective, the worst of the corrective pressure appears to be behind us, with an increasing number of stocks beginning to resolve higher, particularly within Nasdaq, but importantly across the cap spectrum, not just megacaps.
Any near-term shakeouts prior to FOMC should be viewed through a risk-management lens, not as automatic trend invalidation.
S&P 400 Midcap

MDY VRVP Daily & Weekly Chart
71.82%: over 20 EMA | 58.85%: over 50 EMA | 60.09%: over 200 EMA
Midcaps materially outperformed last week, and this is being underappreciated. MDY pushed to fresh all-time highs on Friday, doing so on ~122% of average volume, which is a meaningful confirmation of participation rather than a low-liquidity drift.
Supply did show up at the highs, and it was decisive as the Visible Range Volume Profile shows ~65k of red volume transacted into the highs versus just ~25k of green volume above $607, confirming that sellers were active into ATHs rather than absent.
Importantly, this is still constructive behavior, not a failure. Despite the rejection, price continues to consolidate above the prior $604 supply zone, which has now flipped into support. Friday’s pullback was corrective and the MDY is still trading within ~0.5% of all-time highs, even after absorbing heavy supply which to us is a sign that the path of least resistance remains higher unless proven otherwise.
A controlled dip toward ~$600 would be acceptable and healthy and likely in the immediate short term as that zone aligns with:
A dense VRVP support cluster
The rising 10-day EMA
A clearly defined prior demand area
As long as price holds above that region on a closing basis, structure remains intact and pullbacks should be viewed as digestion rather than deeper trend damage or a complete invalidation of the structure.
Russell 2000

IWM VRVP Daily & Weekly Chart
72.46%: over 20 EMA | 57.95%: over 50 EMA | 61.14%: over 200 EMA
IWM is sitting just ~0.8% below all-time highs, and unlike earlier attempts this year, price is holding near the highs rather than rolling over immediately.
Friday’s candle is constructive and we saw:
Price rejected the upper supply band near ATHs
Pulled back cleanly into the $250 demand zone
Held that level and closed back inside the range
Volume profile at highs is very interesting with:
~2M green volume above $252
~980k red volume in the same zone
Sellers were present, but buyers absorbed supply and are not underwater, especially with price pressing higher again premarket.
This is meaningfully stronger behavior than what weakness would look like:
No expansion lower
No high-volume failure through demand
No takeout of prior day lows after testing supply
Weekly context remains supportive:
Structure is tightening near highs
Trend remains intact above rising longer-term averages
This is far healthier than a high-volume rejection that immediately cascades lower
As long as $250 demand continues to hold, this remains a market behaving like it wants to resolve higher rather than one setting up for a failed breakout.
200+ AI Side Hustles to Start Right Now

AI isn't just changing business—it's creating entirely new income opportunities. The Hustle's guide features 200+ ways to make money with AI, from beginner-friendly gigs to advanced ventures. Each comes with realistic income projections and resource requirements. Join 1.5M professionals getting daily insights on emerging tech and business opportunities.
FOCUSED STOCK
MU: The Semiconductor Leader

MU VRVP Daily & Weekly Chart
ADR%: 6.37% | Off 52-week high: -9.0% | Above 52-week low: +286.1%
MU has been one of the strongest stocks of the last 3 months, and clearly one of the top performers inside semiconductors which a group we’re tracking closely as leadership continues to concentrate there.
Relative strength remains exceptional:
While many growth names chopped or retraced deeper, MU refused to lose its rising 10-week EMA
The pullback ~3 weeks ago was met with immediate demand and a clean recovery, aligning with growth re-acceleration across tech.
Semiconductor strength is really important here:
NVDA is building a multi-month base and looks increasingly ready for resolution
AVGO is already showing decisive leadership behavior
MU fits cleanly into this next-leg semis leadership bucket, rather than being a lagging sympathy move.
This morning’s action:
MU is breaking out into an area where overhead supply thins materially, according to the visible range volume profile
That structural air pocket is constructive, but also increases short-term volatility risk at the open.
Execution:
We would avoid chasing the opening minutes as we notice recent tape has shown repeated failures on marginal breakout highs
Preferred approach is patience and it will be best to allow 15–30 minutes, then assess for:
Gap-fill behavior
Controlled pullback holding VWAP / rising short-term MAs
Acceptance above prior resistance rather than a rejection
FOCUSED GROUP
XLC: The Strongest Growth Group

XLC VRVP Daily & Weekly Chart

RSPC VRVP Daily & Weekly Chart
XLC has already resolved higher, clearing the prior range and holding above breakout, not just probing resistance and importantly, this is not a single-stock or cap-weighted distortion.
The equal-weight Communication Services ETF (RSPC) also broke out last week.
RSPC did so after finding support at its POC, then rotating higher — a constructive sequence.
Leadership inside the group is narrow but clear.
GOOGL and RDDT are doing the work.
These two now become the litmus test for the entire move.
We would now be looking to see if META can catch up (2nd highest weighting in XLC).
Behavior to monitor this week:
Any sharp rejection or failed follow-through in GOOGL or RDDT would strongly suggest the XLC breakout is false.
Failed breakouts in leading growth groups tend to propagate quickly through the rest of the growth complex.
What keeps this constructive for now:
Price acceptance above former supply in XLC.
Confirmation from equal-weight participation, not just top-heavy index mechanics.
No expansion in selling pressure at the group level so far.

Did you find value in today's publication?This helps us better design our content for our readers |
Reply