- Swingly
- Posts
- How To Handle The Crazy Volatility
How To Handle The Crazy Volatility
In partnership with


MARKET ANALYSIS
Here’s What You Need To Know

Futures are modestly green, but the tone matters more than the numbers: this is an attempted stabilization, not a broad-based risk-on impulse.
The AI complex is doing the heavy lifting again, largely off Oracle’s rebound and Micron’s gap up (which failed to see follow through), which tells you leadership remains narrow and fragile, not expanding.
Oracle’s bounce is more about relief than conviction after a brutal week tied to data-center capex fears; it helps sentiment, but it doesn’t repair the broader AI narrative on its own.
Nvidia catching a bid on potential approval to sell advanced chips to China adds fuel short term, but it’s still policy-dependent and therefore headline-sensitive, not trend-defining.
Semiconductors remain meaningfully below their highs, which reinforces that this is a recovery attempt inside a consolidation, not a fresh momentum leg.
The CPI-driven rally earlier in the week reset expectations around rates, but today’s action suggests that macro tailwinds are already priced, and the market is now wrestling with positioning and year-end flows.
Quadruple witching looms as the dominant near-term risk, with a record amount of options exposure rolling off, which historically injects even more messy & volatile price action.
This is the kind of environment where moves can look convincing intraday and still fail by the close, especially given how often recent gap-ups have been sold (the best trade has been selling all gap up opens this week- you’d be right 100% of the time so far…).
Beneath the surface, the tape continues to show rotation rather than broad participation, with defensives, commodities, and select cyclicals holding up better than growth.
Gold and silver pressing toward record highs reinforce that capital is still seeking protection, even as equities attempt to grind higher.
Nasdaq
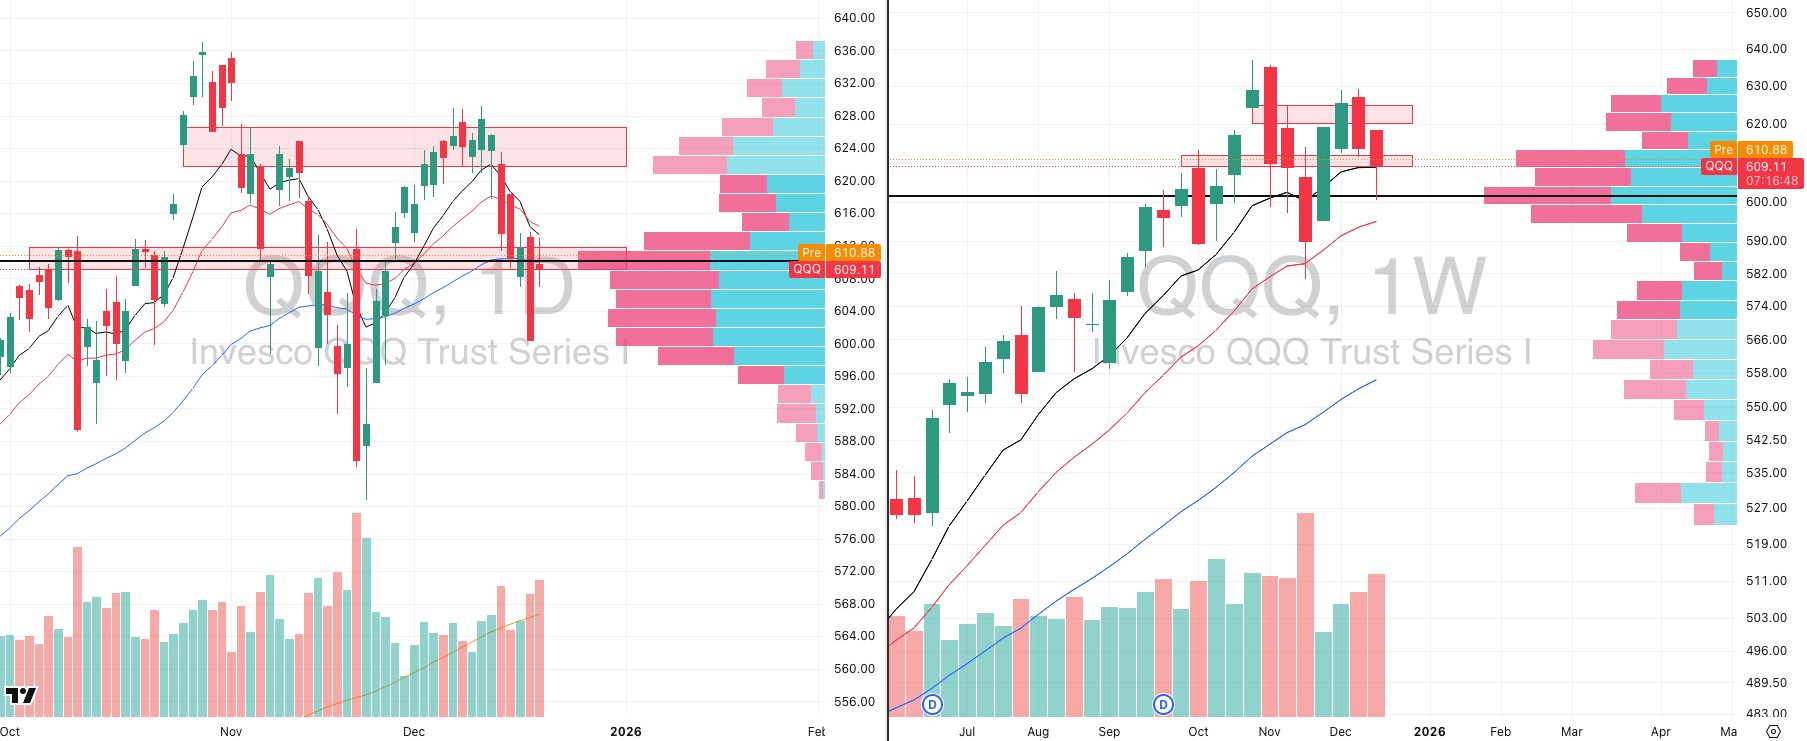
QQQ VRVP Daily & Weekly Chart
52.47%: over 20 EMA | 53.46%: over 50 EMA | 59.40%: over 200 EMA
The Nasdaq saw a sharp liquidation on Wednesday, followed by a meaningful gap higher yesterday of roughly 1.5% from Thursday’s lows, which on the surface looks constructive from a pure price perspective.
That said, the rally was rejected cleanly into the declining 10- and 20-day moving average cluster around 613, a level that has repeatedly capped upside attempts throughout the week.
Relative volume yesterday expanded significantly, running at roughly 130% of the 20-day average, which confirms that participation remains elevated rather than drying up on these moves.
From a structural standpoint, price is still materially higher than Wednesday’s close, and on the weekly chart the bounce off the point of control near 601 was technically impressive and not something to dismiss lightly.
However, this rally has to be viewed through the lens of the broader Adam and Eve double-top structure that has been developing since late October, with the initial Adam peak near 637 and the more rounded Eve top forming over the past month.
Importantly, that structure has neither been confirmed nor invalidated; the strong reaction off 601 keeps it alive, but it does not negate the broader distributional behavior.
What is concerning is the behavior of relative volume since December 10, where downside moves have been accompanied by increasingly aggressive participation, indicating that selling pressure is gaining energy rather than exhausting.
This type of expanding volume into declines suggests that downside moves are being accepted by the market, which materially lowers the odds that short-term bounces will sustain.
On the upside, there is a visible low-volume pocket on the VRVP above 615, extending up toward roughly 620.75, which would allow for a relatively quick upside push of around 0.9% if price can reclaim the 20-day moving average.
The problem is that 615 has proven to be a very difficult level to reclaim, with multiple failed attempts throughout the week, making it a low-probability area to press longs aggressively.
Even if price does push through that zone and triggers short-term excitement across individual stocks, the broader pattern of strong opens followed by weak closes argues strongly against chasing those moves.
S&P 400 Midcap
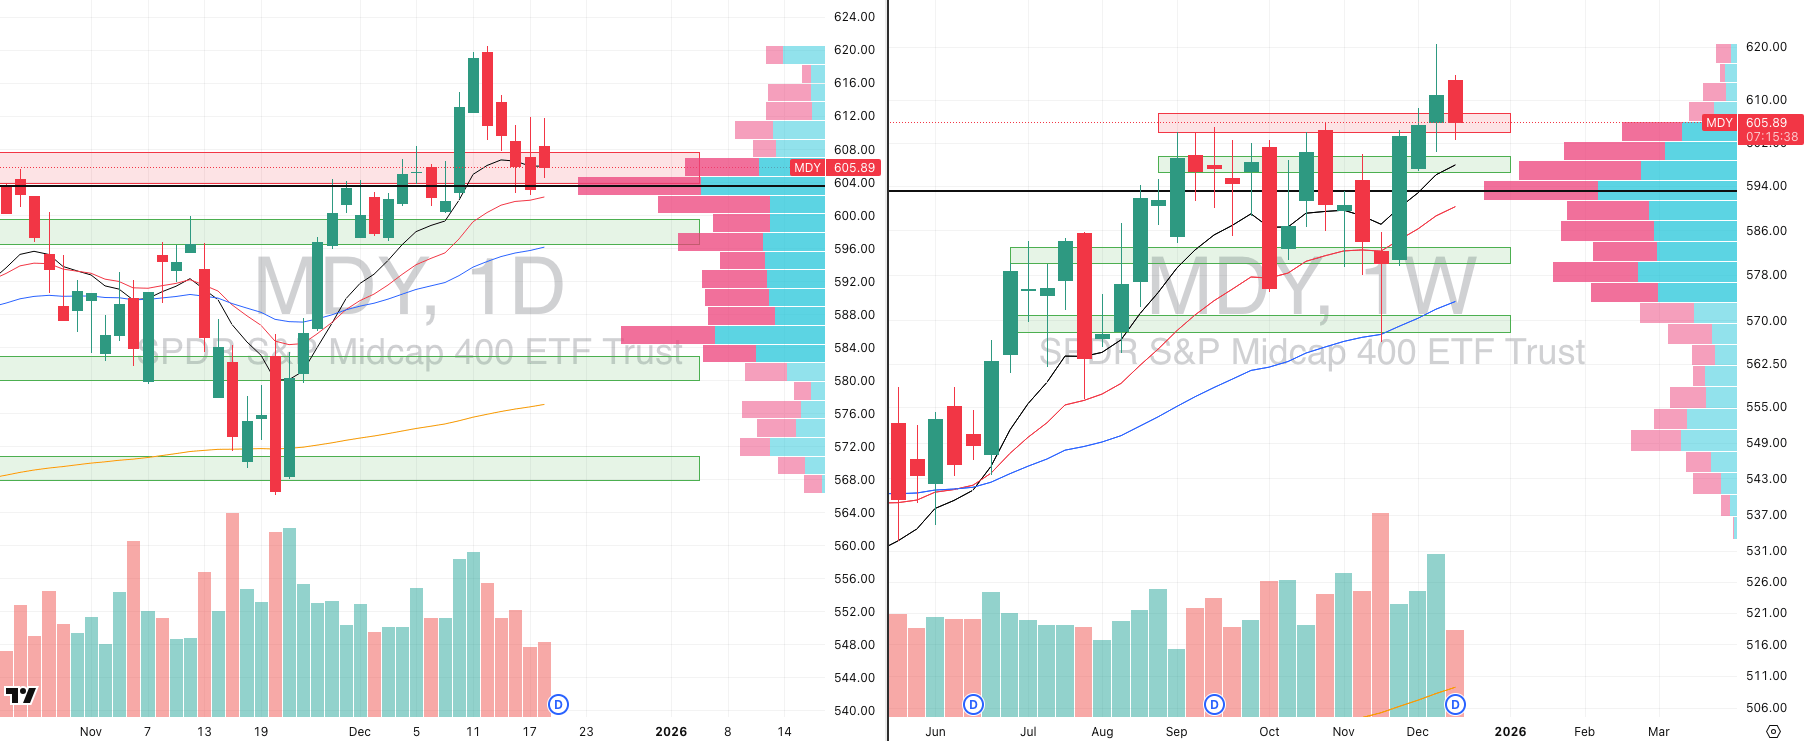
MDY VRVP Daily & Weekly Chart
62.25%: over 20 EMA | 62.25%: over 50 EMA | 61.25%: over 200 EMA
Mid-caps continue to hold the prior supply zone, but the lack of follow-through prevents this area from being confidently reclassified as demand.
The breaker attempt from last Wednesday failed decisively, with price rolling back over and invalidating that reclaim almost immediately.
Supply between roughly 608.60 and 612 remains heavy, and every attempt to push into that zone has been met with aggressive selling.
The visible range volume profile highlights a meaningful imbalance in positioning, with a large concentration of trapped long exposure sitting above current price.
Above 607, green volume expands materially, but as price moves toward 612, red volume increases sharply, indicating that sellers are dominating at higher prices.
This imbalance explains why rallies into that zone continue to fail quickly, as trapped longs use strength to exit rather than add.
While price is still holding the point of control for now, the overall weight of evidence remains skewed against the bulls.
Until MDY can clear and hold above this supply zone with sustained demand, this remains a no-trade environment rather than an opportunity.
Russell 2000
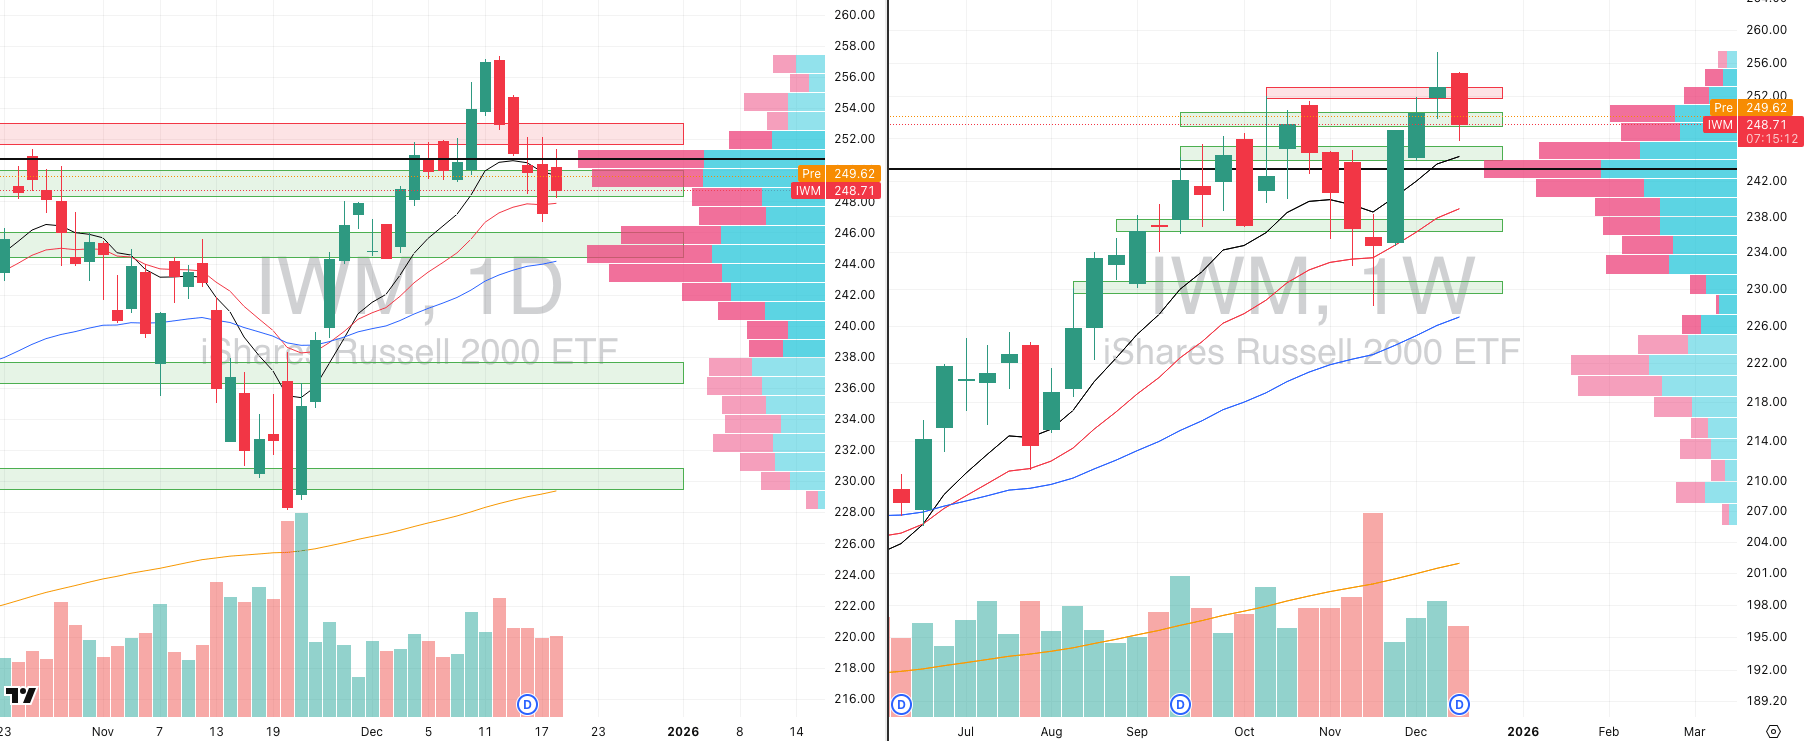
IWM VRVP Daily & Weekly Chart
64.96%: over 20 EMA | 64.08%: over 50 EMA | 64.49%: over 200 EMA
Small caps are displaying a similar structure to mid-caps but with an additional technical risk developing beneath the surface.
On the daily chart, a head-and-shoulders pattern is beginning to form, with the left shoulder established between December 4 and December 10.
The head formed during the sharp push into the 11th–12th of December, topping near 258, followed by a swift rejection.
The right shoulder appears to be forming over the past three sessions, with repeated rejection around the 252 area.
While this pattern is not yet confirmed, its development adds downside risk and further supports a cautious stance toward small-cap exposure.
As with the other indices, the lack of sustained follow-through on rallies continues to argue against pressing trades in this environment.
Smart Investors Don’t Guess. They Read The Daily Upside.

Markets are moving faster than ever — but so is the noise. Between clickbait headlines, empty hot takes, and AI-fueled hype cycles, it’s harder than ever to separate what matters from what doesn’t.
That’s where The Daily Upside comes in. Written by former bankers and veteran journalists, it brings sharp, actionable insights on markets, business, and the economy — the stories that actually move money and shape decisions.
That’s why over 1 million readers, including CFOs, portfolio managers, and executives from Wall Street to Main Street, rely on The Daily Upside to cut through the noise.
No fluff. No filler. Just clarity that helps you stay ahead.
FOCUSED STOCK
PLTR: A Relative Strength Leader Coiling
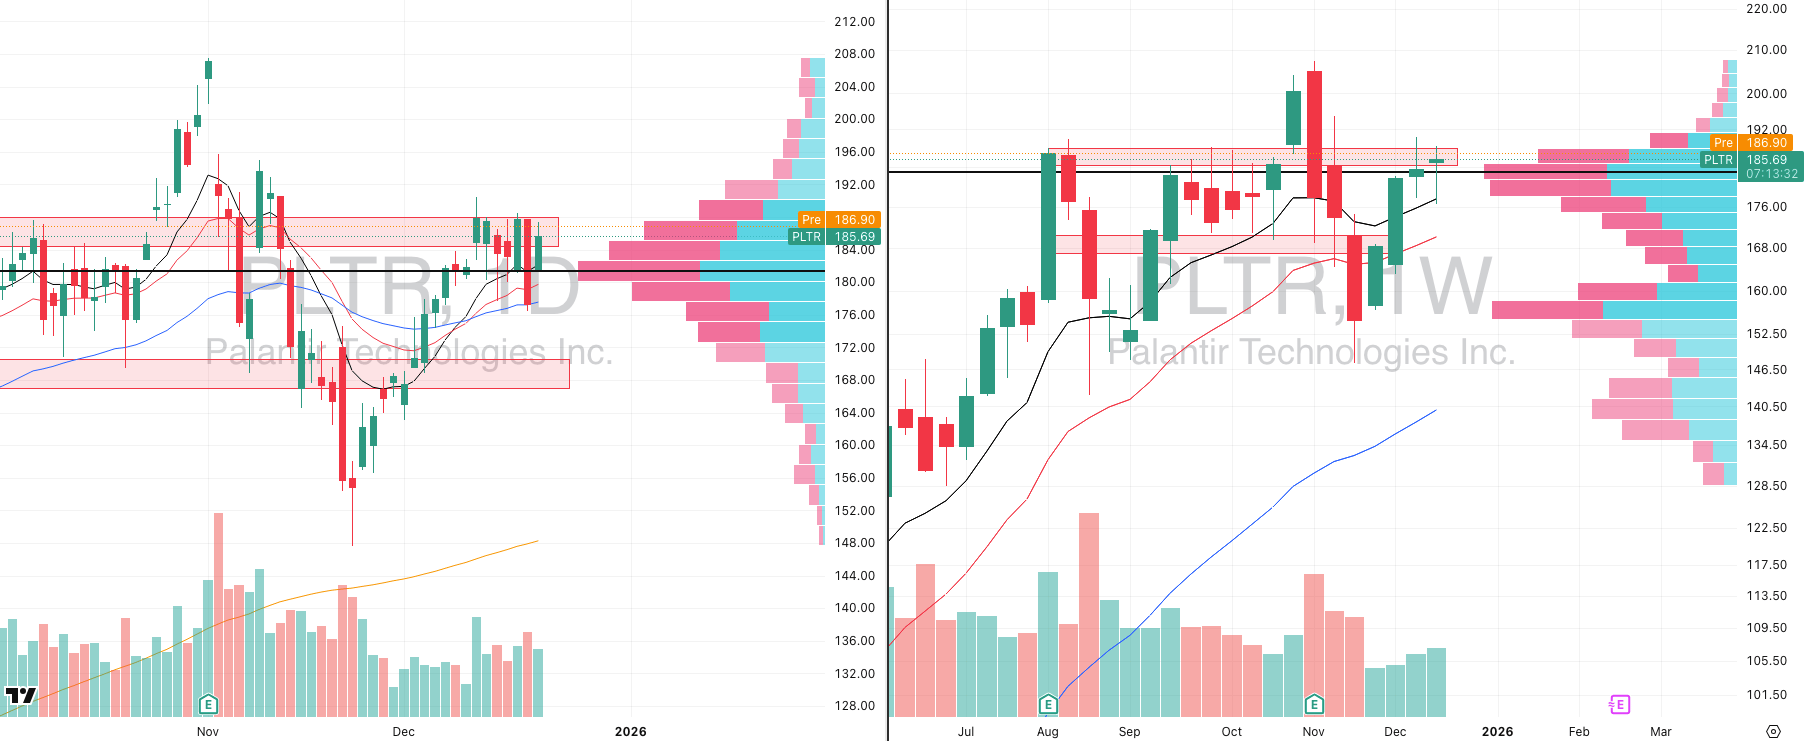
PLTR VRVP Daily & Weekly Chart
ADR%: 4.41% | Off 52-week high: -10.5% | Above 52-week low: +192.9%
Palantir is behaving very differently from the broader technology complex and is currently displaying the highest relative strength of any tech stock we are actively tracking.
On a relative strength basis versus the S&P 500, Palantir is printing a 98 rating, which is effectively at the very top of the market, with only a 99 being higher.
Technically, the stock is consolidating in what can be interpreted as a bull flag, and there is also a valid argument that this structure could evolve into a cup-and-handle formation over time.
That said, this is not a textbook low-volatility contraction. Relative volume has been rising during this consolidation phase, and the average true range has actually expanded materially since December 10.
The failed push above 190 earlier this month marked the start of this range, with price subsequently oscillating between roughly 190 on the upside and 177 on the downside.
The 177 area is particularly important, as that level coincided with Wednesday’s test of both the 10-week and 50-day moving averages, which price respected.
This is precisely why Palantir is being highlighted here. In an environment where the broader market is difficult to trade and downside pressure remains elevated, the stocks that matter most are those that continue to hold above their key moving averages.
That behavior is the definition of a true relative strength leader, and it is these names that provide the earliest signal when market conditions begin to improve.
The objective is not to trade Palantir aggressively right now, but to track it closely and keep it on a high-priority watchlist.
When downside pressure across the market finally subsides, stocks like this are the ones that lead first, long before the indices themselves confirm a new uptrend.
Remember, leading stocks lead indices, not the other way around. The strongest individual stocks are always the ones that carry the market out of corrections and form the best opportunities when the next sustained rally begins.
Did you find value in today's publication?This helps us better design our content for our readers |
Reply