- Swingly
- Posts
- How Pullbacks Turn Into Corrections
How Pullbacks Turn Into Corrections
In partnership with
OVERVIEW
What You Need To Know
Leaders rolling: PLTR, UBER beat but sold — market no longer rewarding growth prints; upside requires validation.
Tech finally bending: QQQ loses 10-EMA pre-market; breaks risk a fast flush toward ~$611 air-pocket — reflex bounce likely first test.
Mid-caps failing: MDY reversing off 20-week EMA; distribution, not accumulation. Weakest structural group.
Small-caps fragile: IWM defending 50-day / 10-week EMA… again. One more failure likely sends to ~$223.
Leadership stress: Mega-caps softening, breadth thinning — late-cycle pullbacks feel heavier.
PLTR watch: Post-earnings shakeout into first demand retest ($185–187) — great asymmetric long only if buyers show.
Utilities bounce: Strong hammer + volume at rising MAs — defensive flows emerging.

MARKET ANALYSIS
The Market Is Getting Weaker By The Day

Stocks pulled back as concerns over stretched valuations took center stage, with several Wall Street CEOs cautioning that a 10% correction could be healthy after months of relentless gains. Investors are starting to question whether earnings growth can keep pace with lofty multiples.
Tech led the decline as Palantir and Uber both posted strong results but still fell, reflecting fading tolerance for high-priced growth stories. The market’s reaction suggests sentiment has shifted from “buy the dip” to “prove it’s worth it.”
Spotify stood out on the upside, climbing after beating on revenue and margins. Its leaner cost structure and steady user growth gave investors confidence that profitability may now be sustainable.
The ongoing government shutdown continues to cloud the macro picture by delaying key economic reports, leaving traders to navigate a data vacuum just as volatility begins to creep back in.
Nasdaq
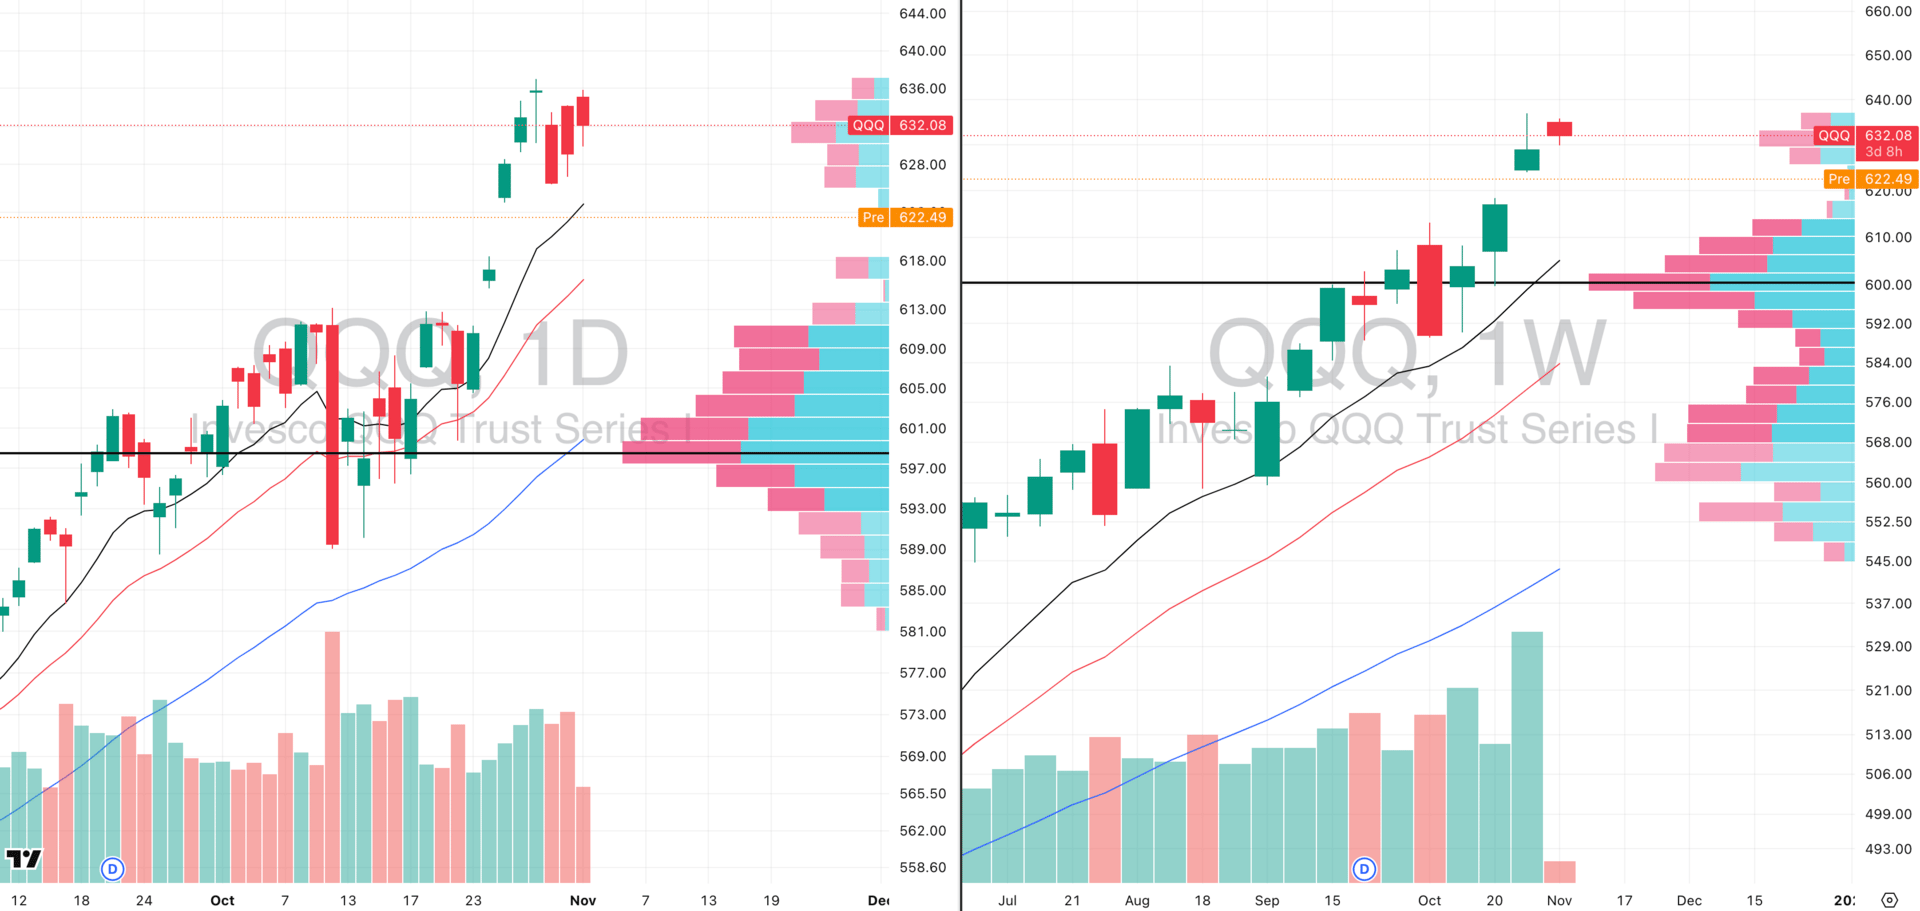
QQQ VRVP Daily & Weekly Chart
% over 20 EMA: 49.01% | % over 50 EMA: 54.90% | % over 200 EMA: 55.88%
Yesterday’s session printed ~69% of 20-day relative volume, signalling digestion at this high tight flag pattern consistent with a mature trend pausing after a major rally and so far is not a huge topping sign.
Premarket today is seeing QQQ slip below the rising daily 10-EMA (~$623) after a weak hourly structure break. The 10/20-EMA has been the primary rhythm line for pullback buyers throughout this advance and as long as we are above we shouldn’t get too bearish.
A sustained move below $623 would open the low-volume pocket on VRVP down to ~$611, implying a -3.2% air-pocket from yesterday’s close (and filling the breakaway gaps left open last week).
Context matters a lot here as the QQQ remains the strongest major index in the market by a wide margin, with clear relative-strength leadership over SPX, equal-weight benchmarks, and cyclicals.
While the break deserves respect, we would not advocate fading the open into weakness here. In the strongest asset within the global equity complex, a reflexive bounce attempt is statistically likely on first test of trend support.
S&P 400 Midcap
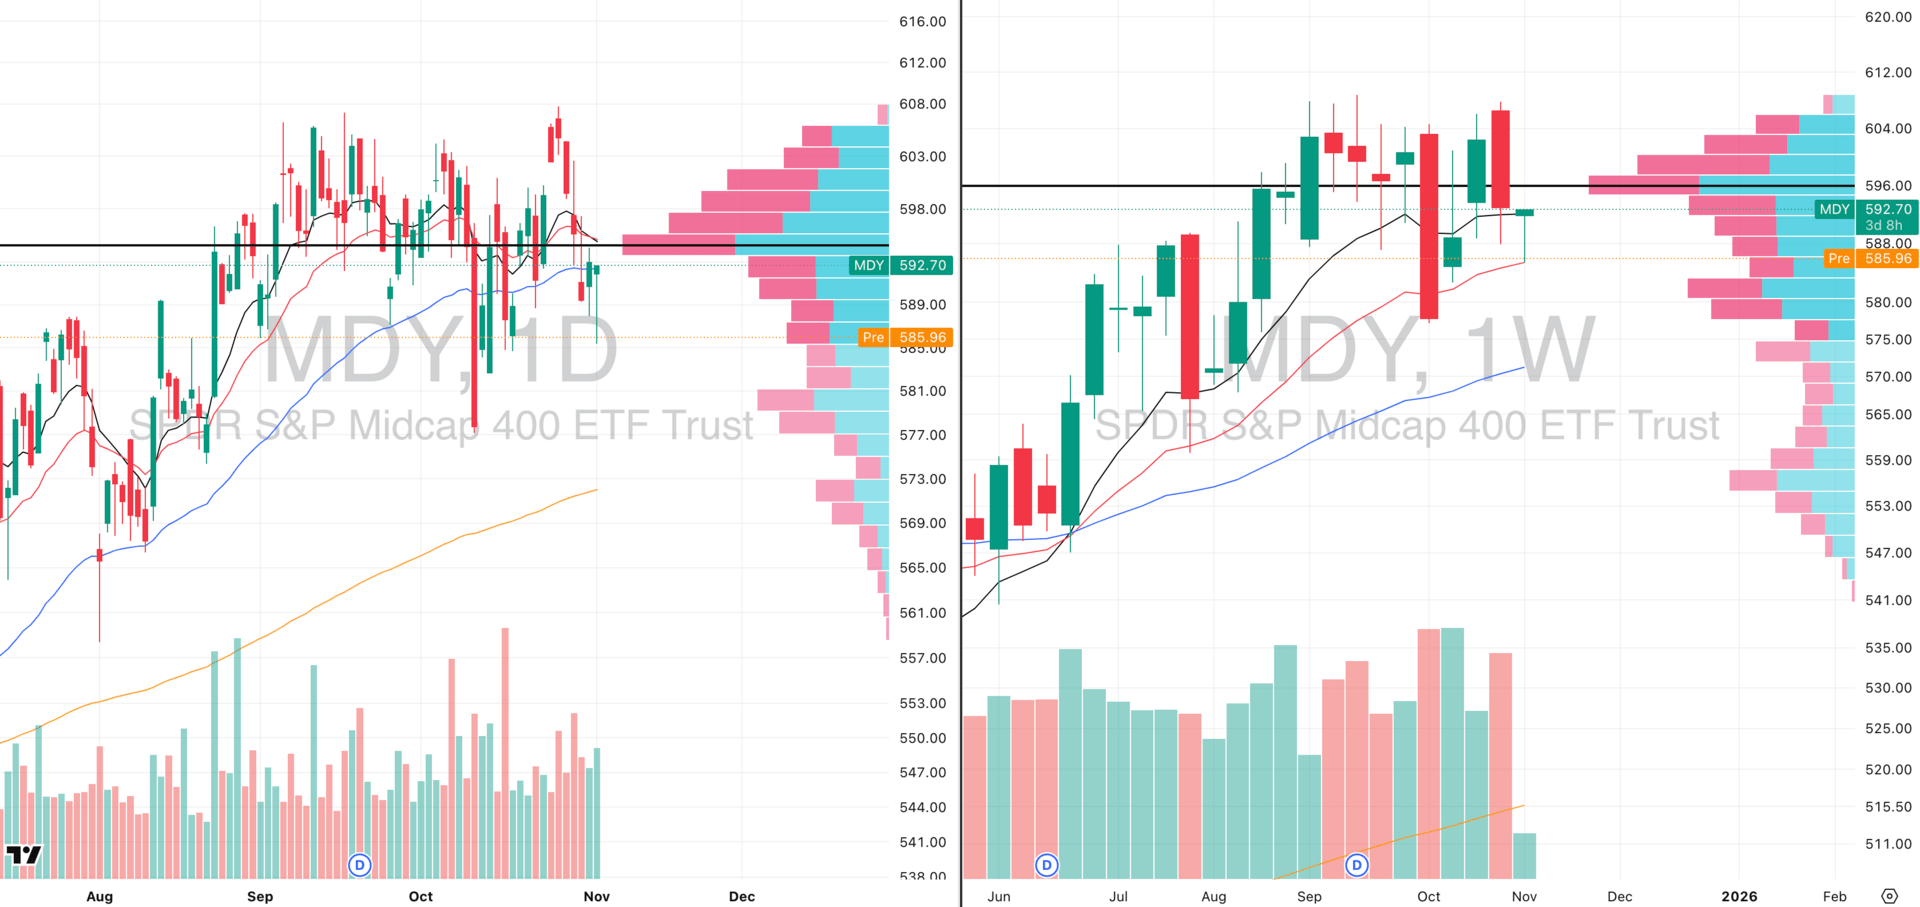
MDY VRVP Daily & Weekly Chart
MDY VRVP Daily & Weekly Chart
% over 20 EMA: 38.90% | % over 50 EMA: 34.66% | % over 200 EMA: 49.62%
MDY showed an initial responsive-buyer reaction yesterday at the 20-week EMA, printing a long-tailed hammer on the daily as price pushed into the rising 50-day EMA.
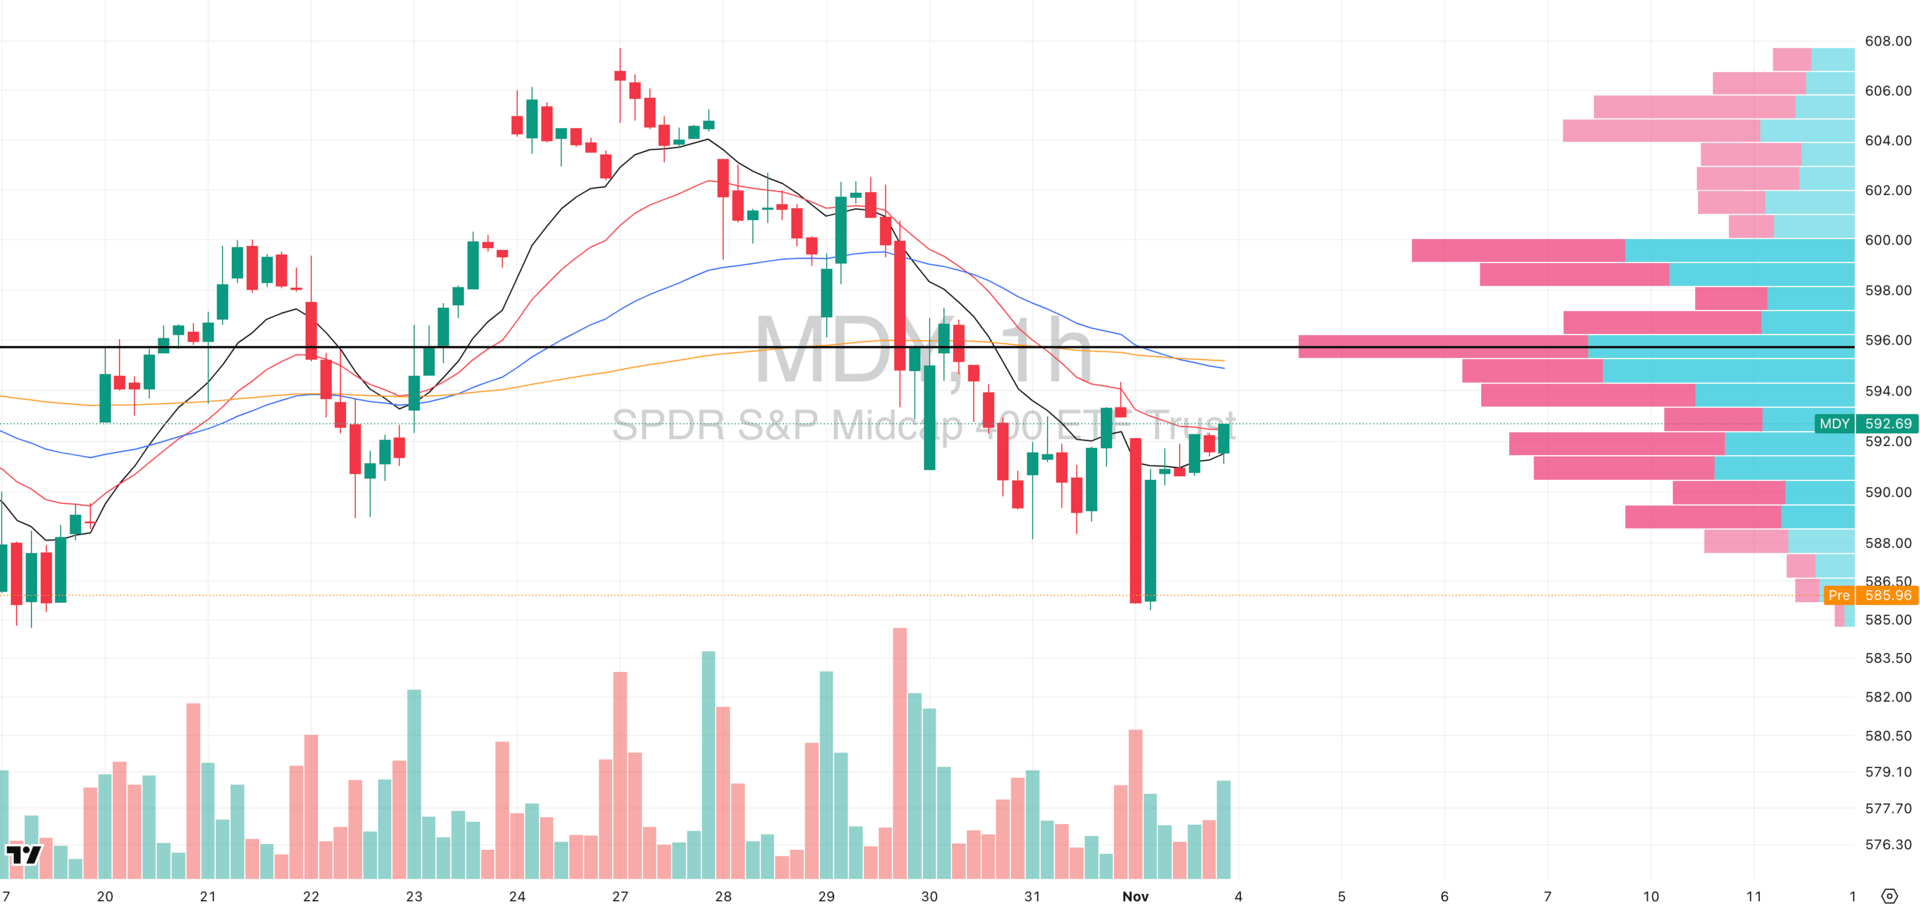
However, pre-market is fully unwinding that move, and the intraday tape confirms why as yesterday’s attempted hourly bullish engulfing failed as the green bar never took out the prior sell bar and did not come on higher volume, meaning no confirmation from demand.
Behaviour here remains weak and distributive, and unless buyers defend this 20-week EMA again this week, the structure risks shifting into a deeper intermediate-term markdown on the weekly chart.
This is the polar opposite of QQQ’s leadership profile, and if midcaps cannot re-bid from here, it reinforces that breadth leadership has narrowed aggressively into mega-cap tech (which above we can see are weakening themselves).
Russell 2000
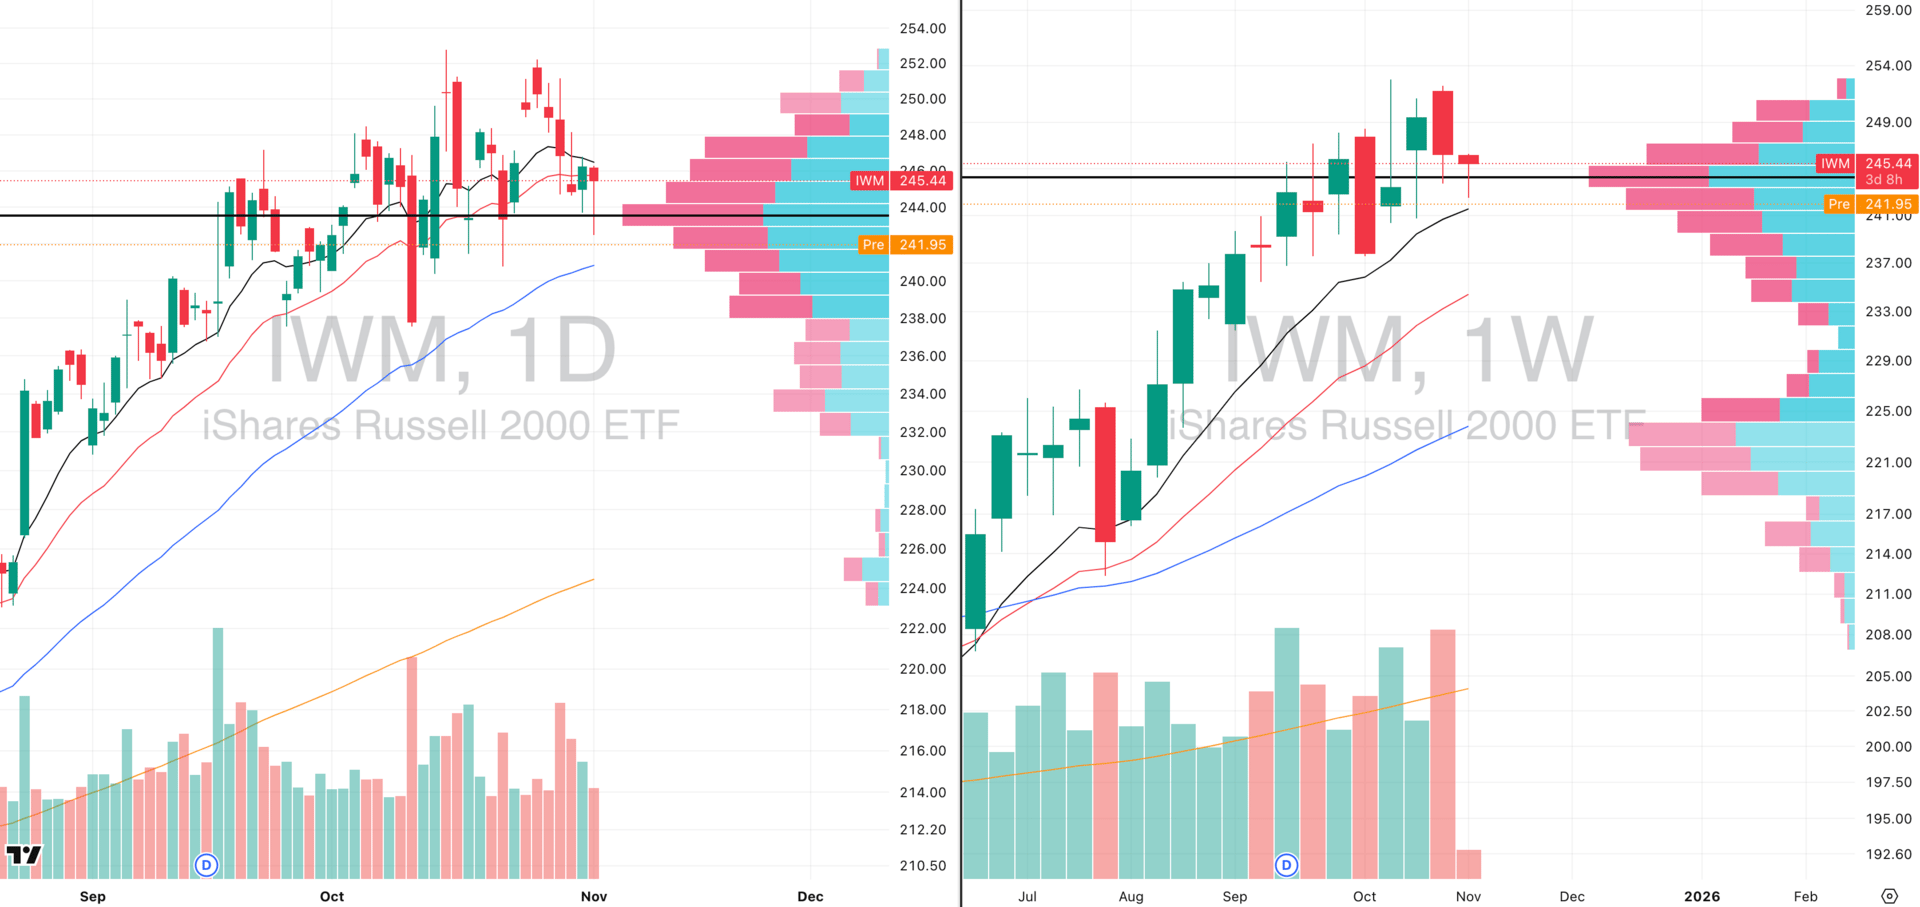
IWM VRVP Daily & Weekly Chart
% over 20 EMA: 39.47% | % over 50 EMA: 37.73% | % over 200 EMA: 53.25%
IWM continues to hold a slight relative-strength edge vs MDY, staying a step ahead in trend structure.
Yesterday saw a defense of the $240 zone on the key 50-day EMA + 10-week EMA confluence, which has been the cycle support area since April.
That bounce came on 77% of 20-day relative volume, signaling reactionary dip-buying rather than sponsored accumulation.
Pre-market is erasing that bounce, reinforcing fragility and showing buyers are not pressing follow-through.
10-week EMA remains the level to watch with every pullback since the summer has held here; losing it would mark an intermediate-trend violation (we are not confident this will hold).
VRVP shows a low-volume pocket below ~$240, meaning a clean break risks fast momentum into $223 on the 20 week EMA.
Looking for unbiased, fact-based news? Join 1440 today.
Join over 4 million Americans who start their day with 1440 – your daily digest for unbiased, fact-centric news. From politics to sports, we cover it all by analyzing over 100 sources. Our concise, 5-minute read lands in your inbox each morning at no cost. Experience news without the noise; let 1440 help you make up your own mind. Sign up now and invite your friends and family to be part of the informed.
FOCUSED STOCK
PLTR: A Potential Intraday Gap Fill Long
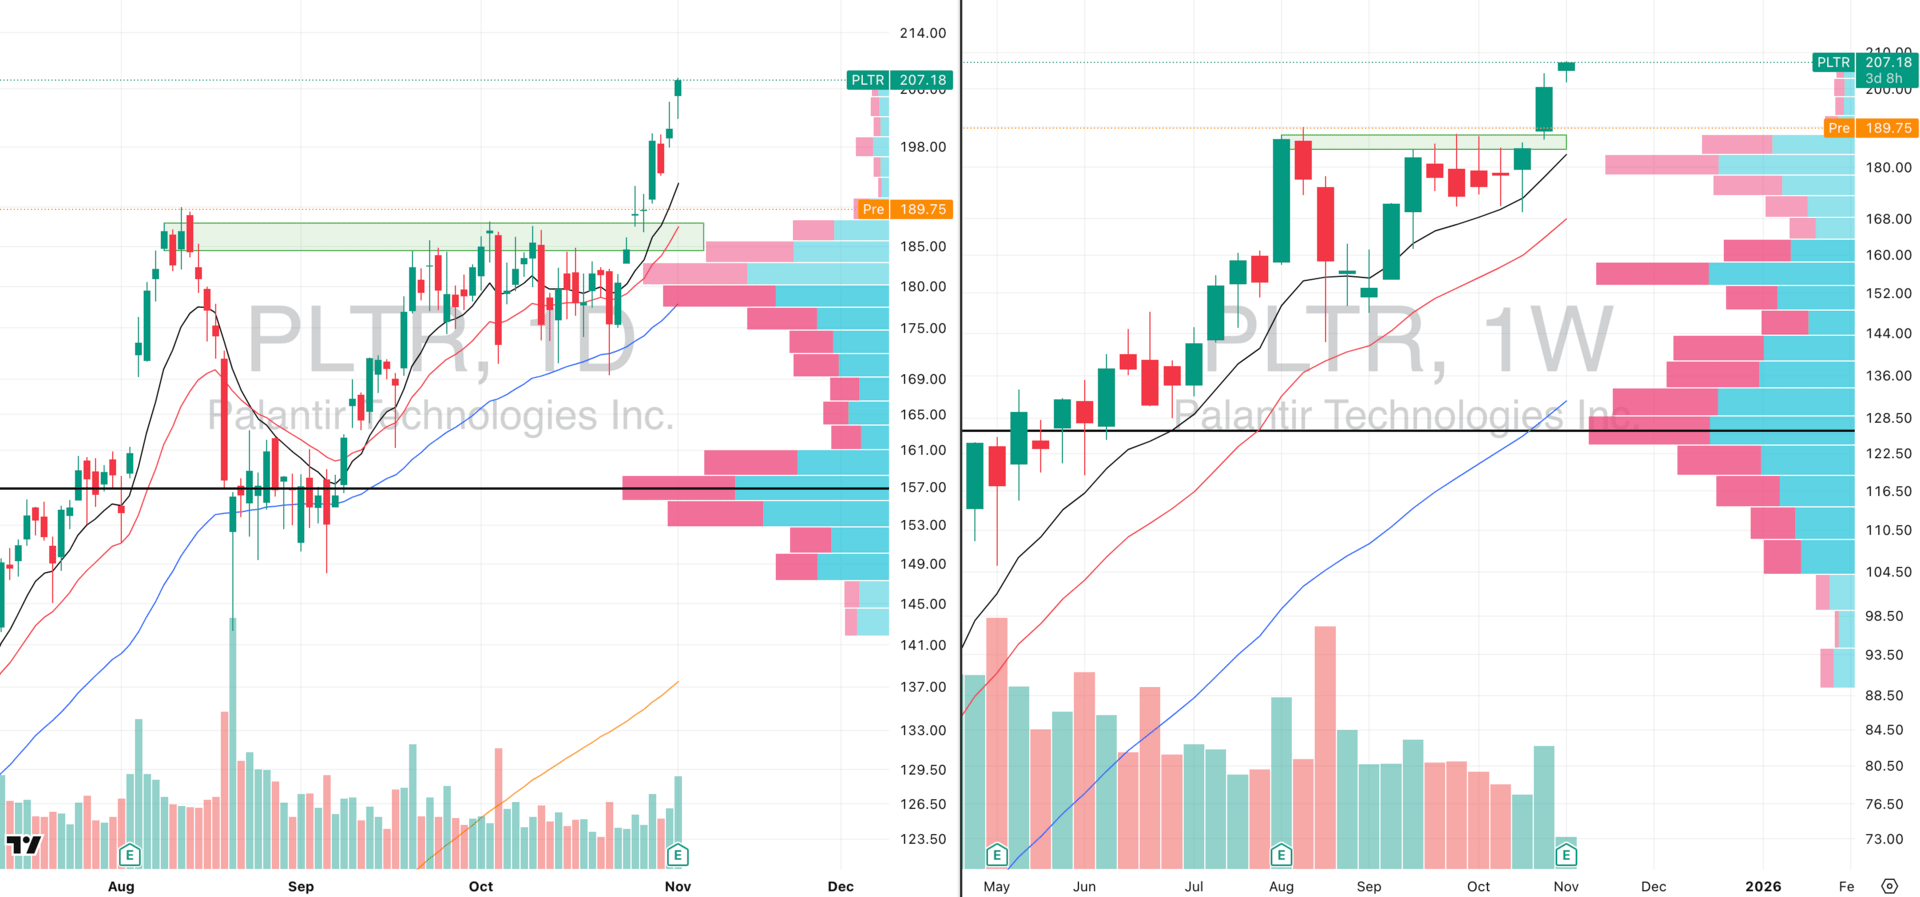
PLTR VRVP Daily & Weekly Chart
ADR%: 3.96% | Off 52-week high: +1.5% | Above 52-week low: +404.9%
PLTR delivered another strong quarterly print, reaffirming its position as one of the top-3 relative strength leaders in the entire market this cycle.
Despite the earnings beat, price is pulling back into $189, now sitting below the rising 10-day EMA which is not ideal tactically, but expected digestion after a vertical thrust (and also why we never gamble into an earnings event).
This pullback is a retest of the prior August–October supply shelf, which flipped to demand on the 10/27 earnings-driven breakout.
The zone $185-$187 represents the former ceiling that acted as resistance for months and is now serving as a first real post-breakout demand test.
We are looking for responsive dip-buyers to emerge here; if they show up, the setup remains a post-breakout retest which is normal in uptrends and a great 1-3 momentum burst long play targeting prior day lows around $201 (with great asymmetry to the long sides; low risk vs high reward).
FOCUSED GROUP
XLU: Buyers Show Up Where They Should
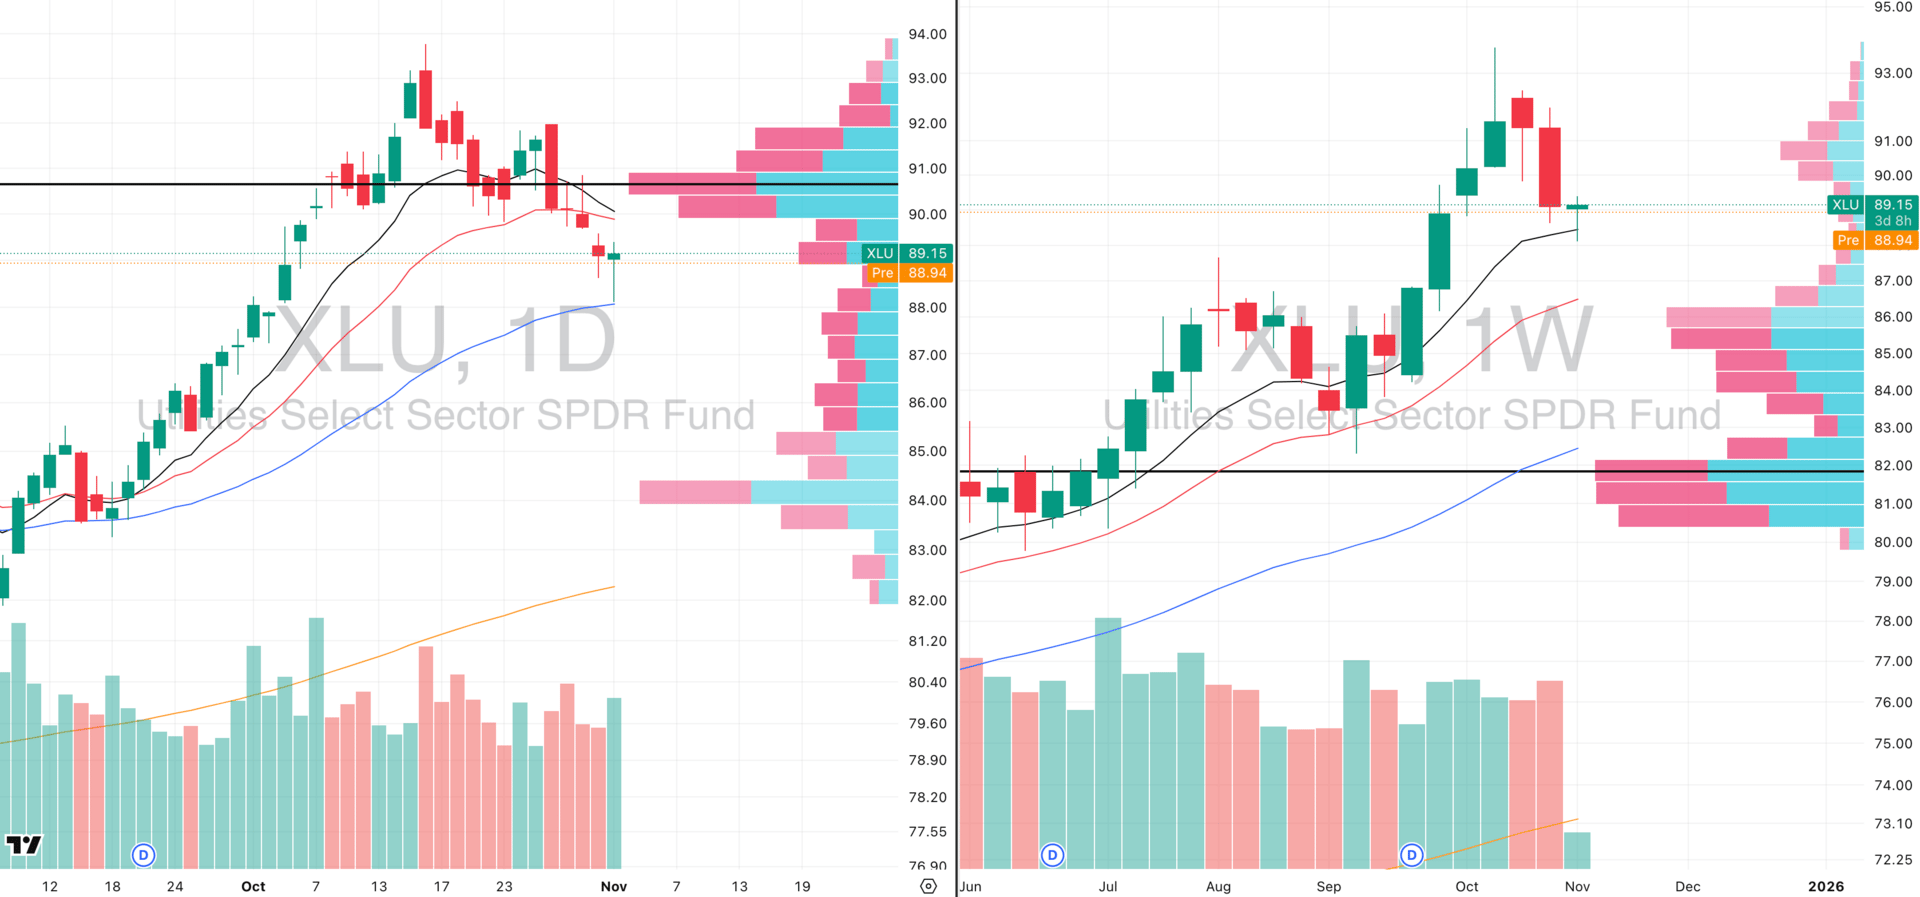
XLU VRVP Daily & Weekly Chart
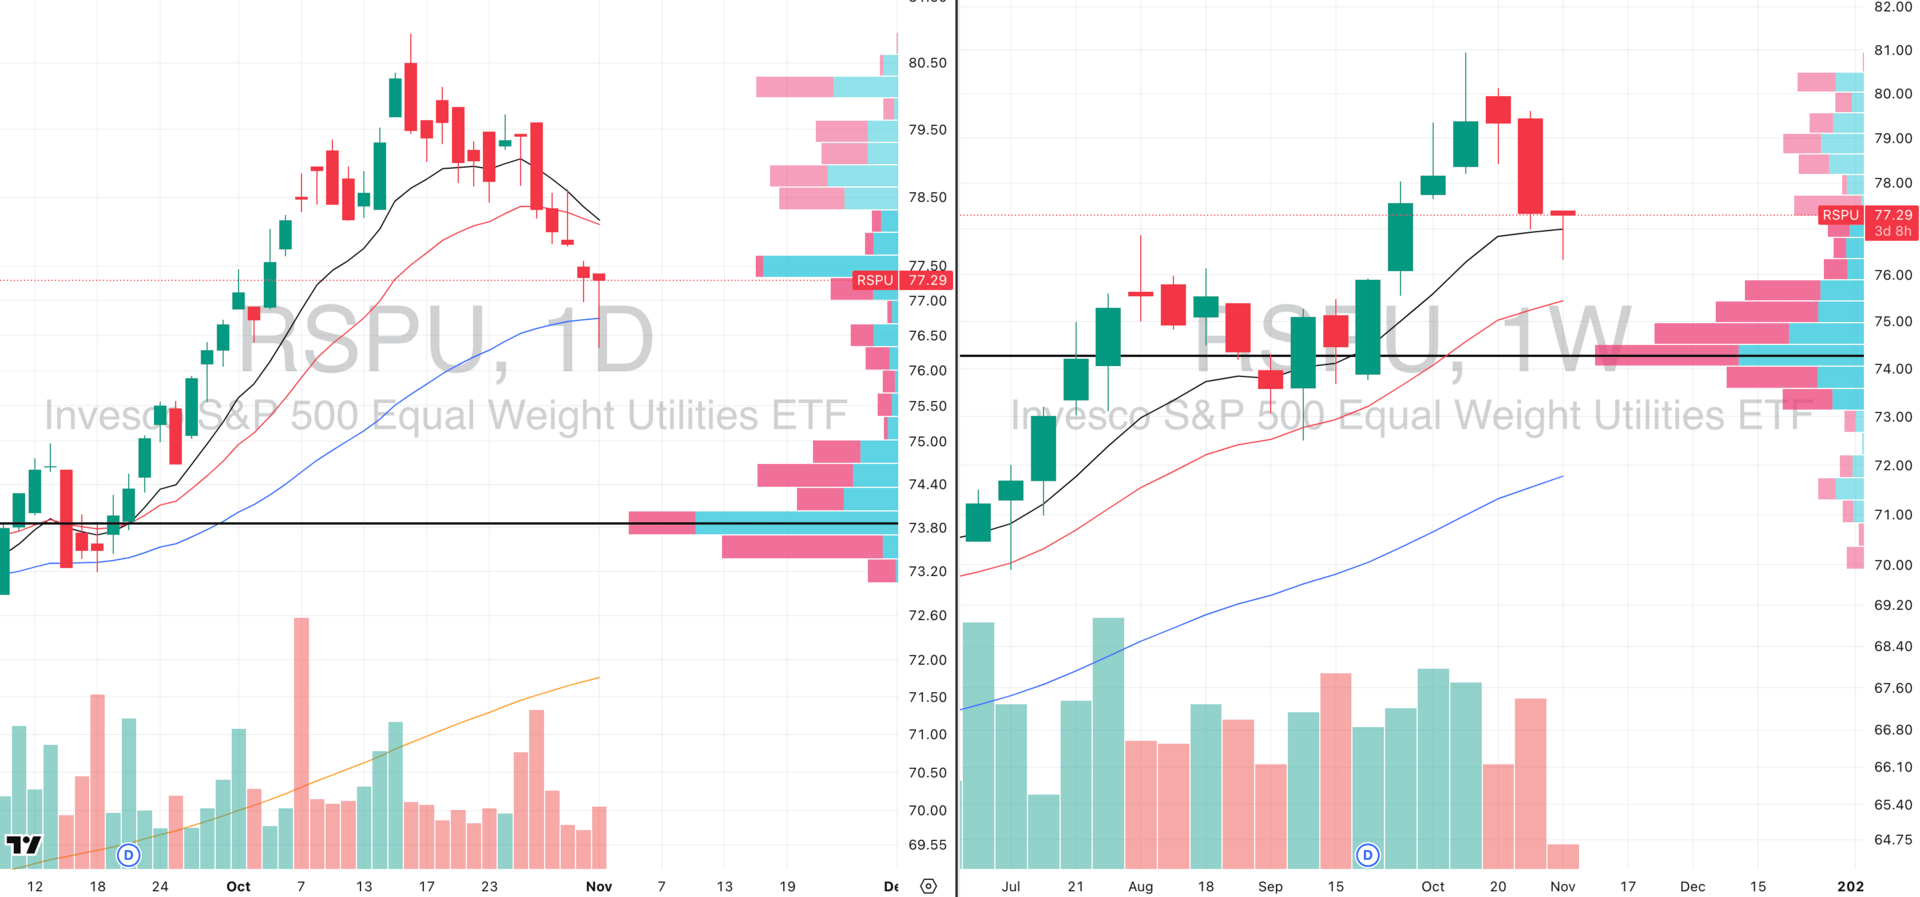
RSPU VRVP Daily & Weekly Chart
Utilities printed hammer-type reversal candles right at the 50-day / 10-week EMA cluster on important short term + intermediary trend cycle supports
Volume expanded on both XLU and RSPU into the reversal telling us active buyers stepped in
RSPU (equal-weight) led the turn, signaling broad participation across the group which is very important for a wide spread utilities bounce as it was not just cap-weighted leadership.
These reversal structures tend to follow through with positive expectancy:
Hammer patterns historically resolve bullish ~60% of the time
Meet projected targets ~88% in bull-market upward breakouts
Mid-tier follow-through rank (65 / 103), meaning decent edge, modest continuation
Yesterday fits that profile with a trend-pullback + hammer + rising MAs + volume confirmation.
We would now be scanning all leading groups and stocks inside utilitie to see how the individual components are behaving.

Did you find value in today's publication?This helps us better design our content for our readers |
Reply