- Swingly
- Posts
- How Hedge Funds Positioned Last Week
How Hedge Funds Positioned Last Week

SECTOR ANALYSIS
Technology (XLK)
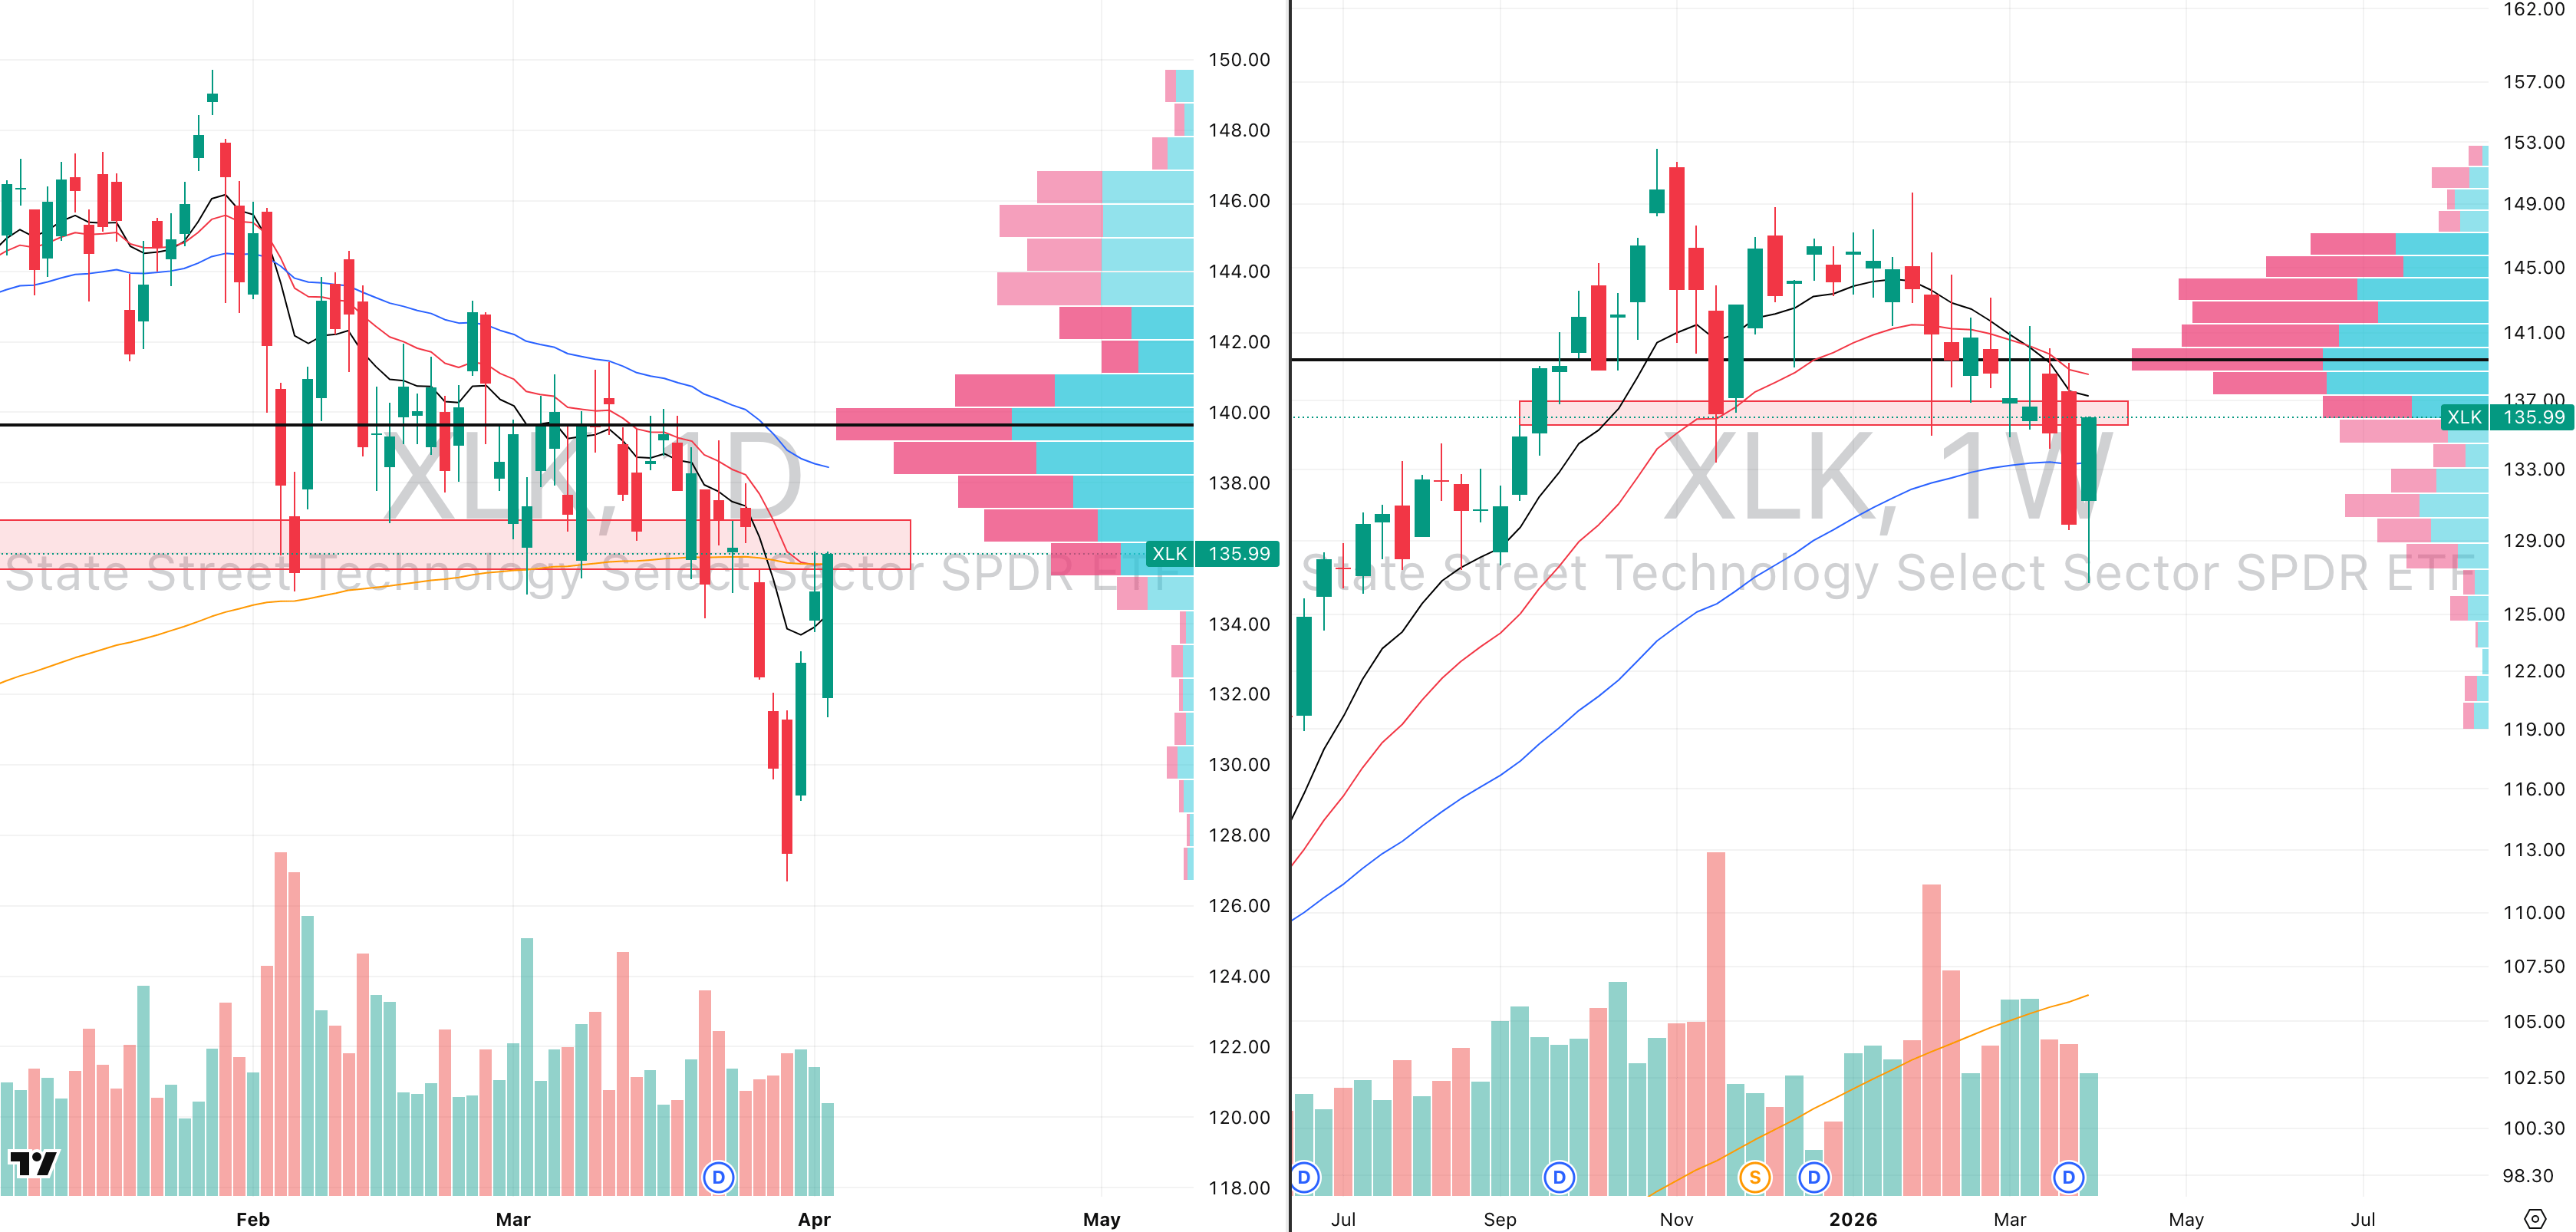
XLK VRVP Daily & Weekly Chart
Performance: 1W: +2.4% | 1M: -3.1% | 3M: -5.7% | 6M: -6.5% | 1Y: +29.2% | YTD: -5.7%
Friday's bounce in XLK came on only 60% relative volume — meaning less than two-thirds of the typical daily participation showed up to push price higher. That matters because the bounce produced an ATR of 3.53%, nearly 40% larger than the average daily range, which tells you price moved a lot on very little conviction. Low volume moves into supply are the basic definition of a bull trap rather than a genuine recovery.
The supply zone between $136.32 and $137 contains approximately 5.3 million shares traded red against 8.6 million green — trapped buyers at break-even who are likely to sell into any further strength. On the weekly chart, volume came in at only 88% of average for the entire week, and price only just recovered the 50-week EMA at $133.53.
The best case scenario from here is sideways consolidation above the 200-day EMA at $135.60, which was reclaimed on Thursday's session.
Industry group internals show the weekly bounce was selective — Semiconductors +3.4% and Electronic Components +4.7% led the recovery while Software - Application +0.4% and Software - Infrastructure +1.8% lagged, a 430 basis point spread; YTD the damage remains deep — Software - Application -26.2%, Information Technology Services -20.1%, and Semiconductors -4.2% are the structural underperformers while Semiconductor Equipment & Materials +28.9% remains the lone outlier.
Until relative volume expands meaningfully on an upside move, treat every bounce in XLK with extreme skepticism.

Financials (XLF)
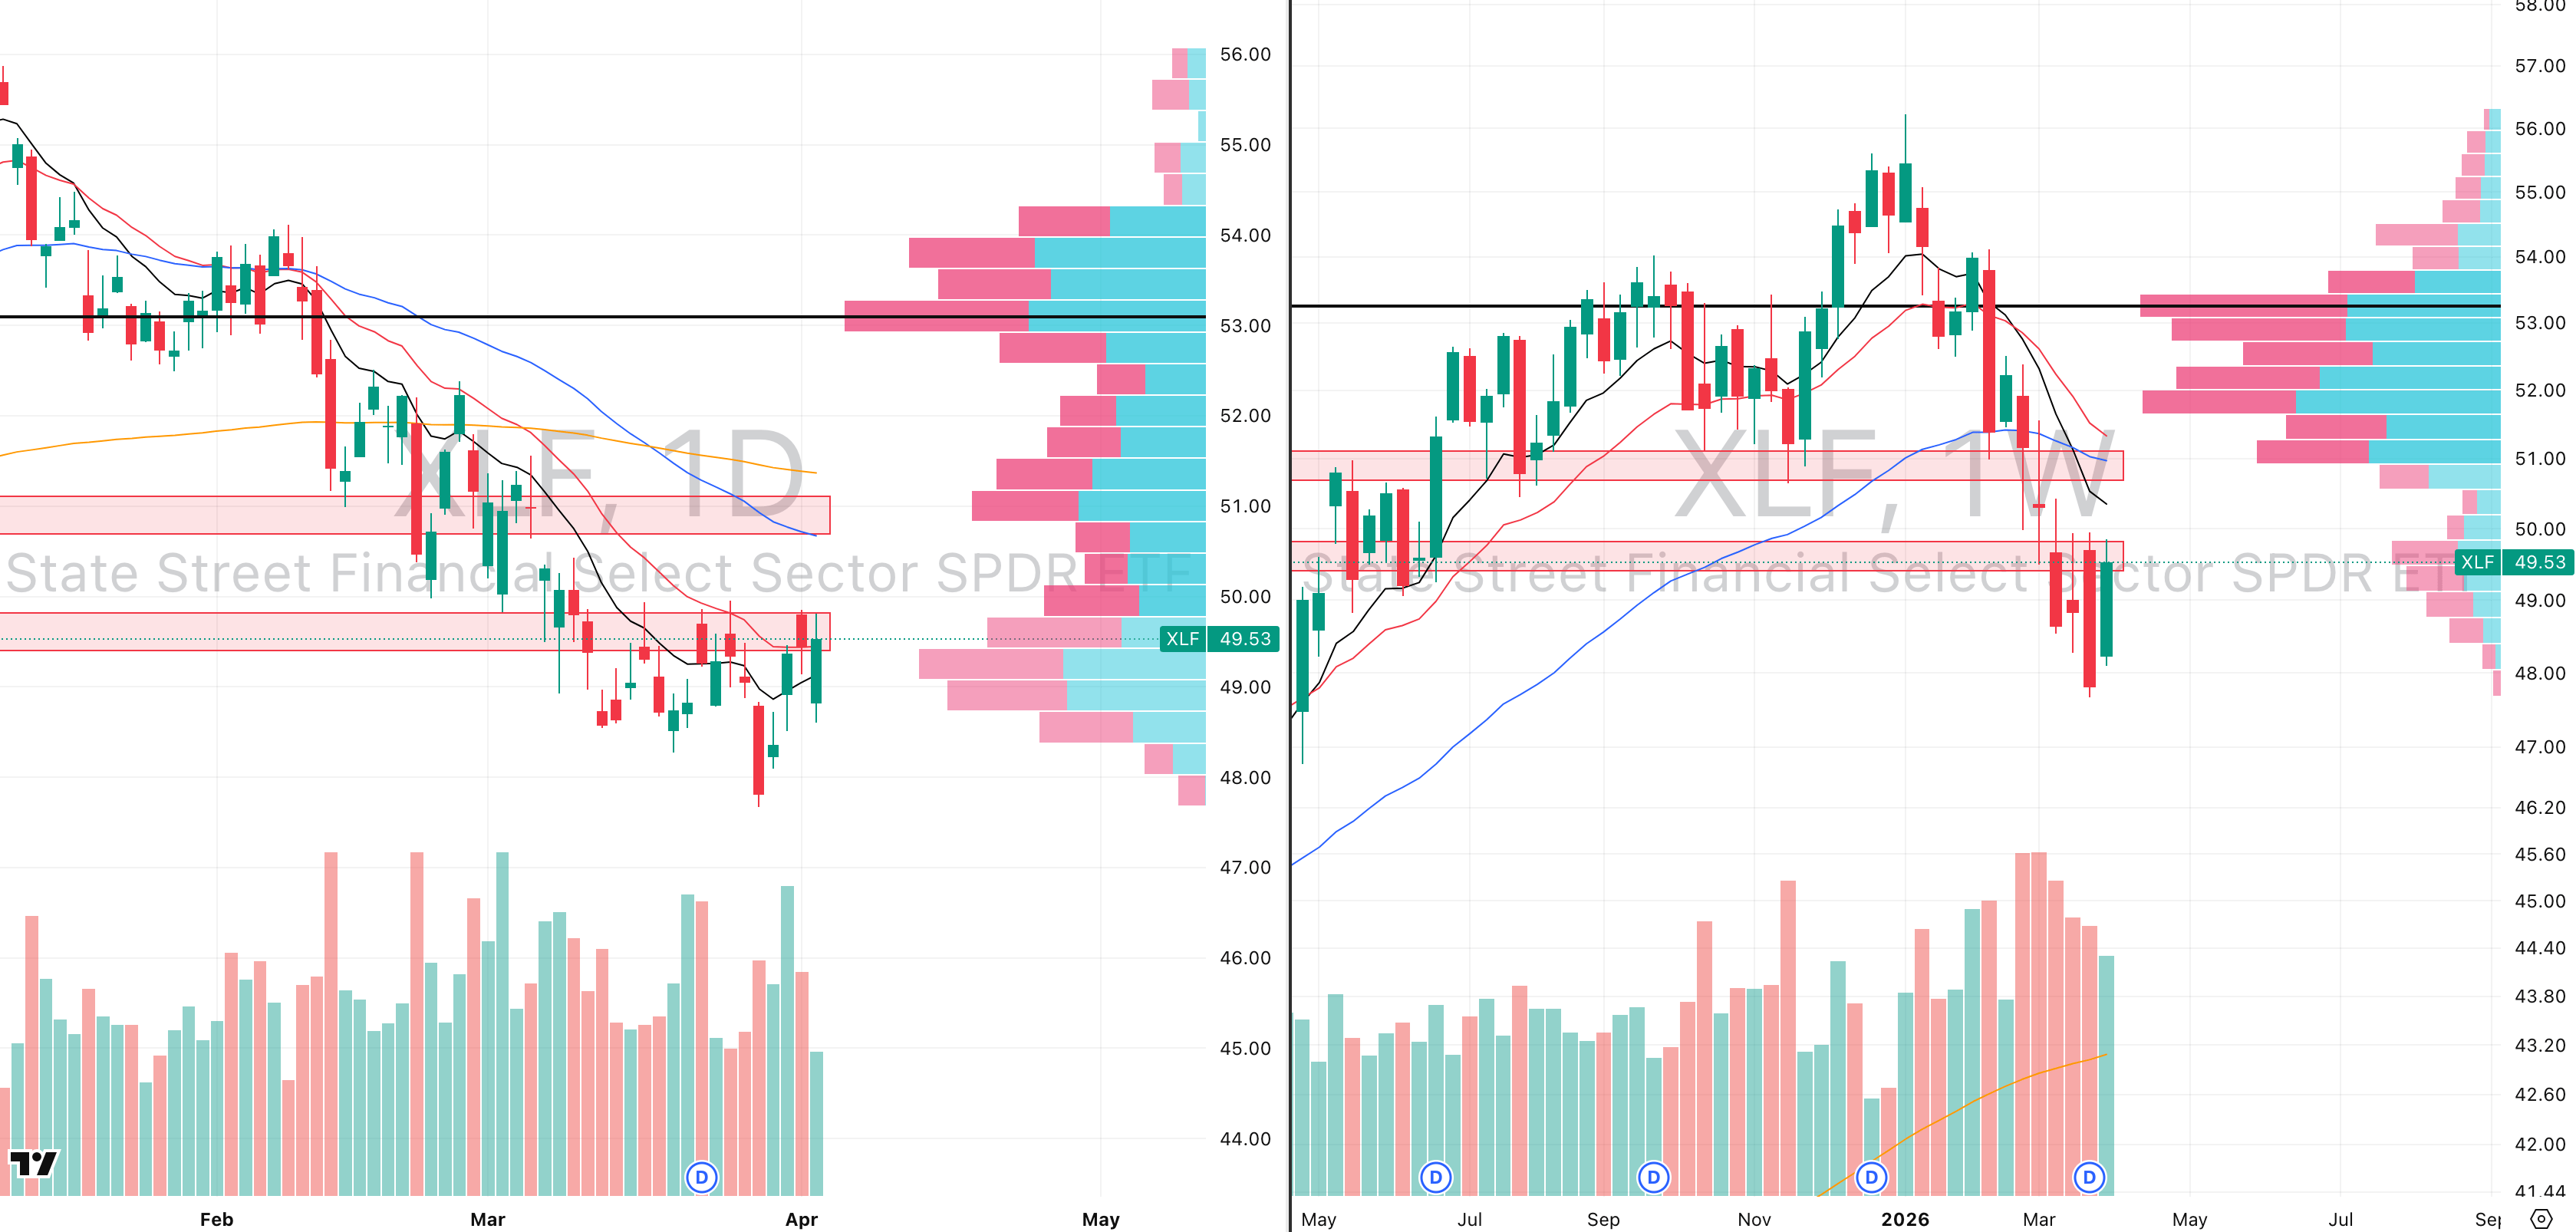
XLF VRVP Daily & Weekly Chart
Performance: 1W: +1.6% | 1M: -3.8% | 3M: -7.7% | 6M: -4.2% | 1Y: +8.1% | YTD: -7.7%
XLF is forming a textbook bear flag — one of the most reliably bearish continuation patterns in technical analysis. A bear flag forms when a sharp decline pauses and price consolidates sideways or slightly higher before resuming lower.
That is precisely what is happening here over approximately four trading weeks, with clear resistance at the $49.90 supply level where approximately 12 million shares have been traded to the downside against only 7 million green — sellers are actively defending that level.
The 20-month EMA at $49.19 is providing a temporary consolidation anchor, but this is not a support story as it is just a pause in a downtrend. The only scenario that changes the bear flag thesis is a high-volume close above $50 on expanding relative volume, which would open a move toward the $51 prior support-turned-resistance level.
Until that occurs, every upside move inside this flag is a potential short entry rather than a recovery signal. Industry group internals show marginal stabilisation rather than genuine recovery — Banks - Diversified +3.1% and Banks - Regional +2.5% on the week led the bounce while Capital Markets -2.8% and Insurance Brokers -3.6% lagged; YTD, Asset Management -15.4% and Credit Services -18.5% remain the deepest wounds while Capital Markets -12.1% has given back much of its earlier relative strength advantage.
A high-volume break above $50 is the bull signal — everything else is noise inside a bear flag.
Healthcare (XLV)
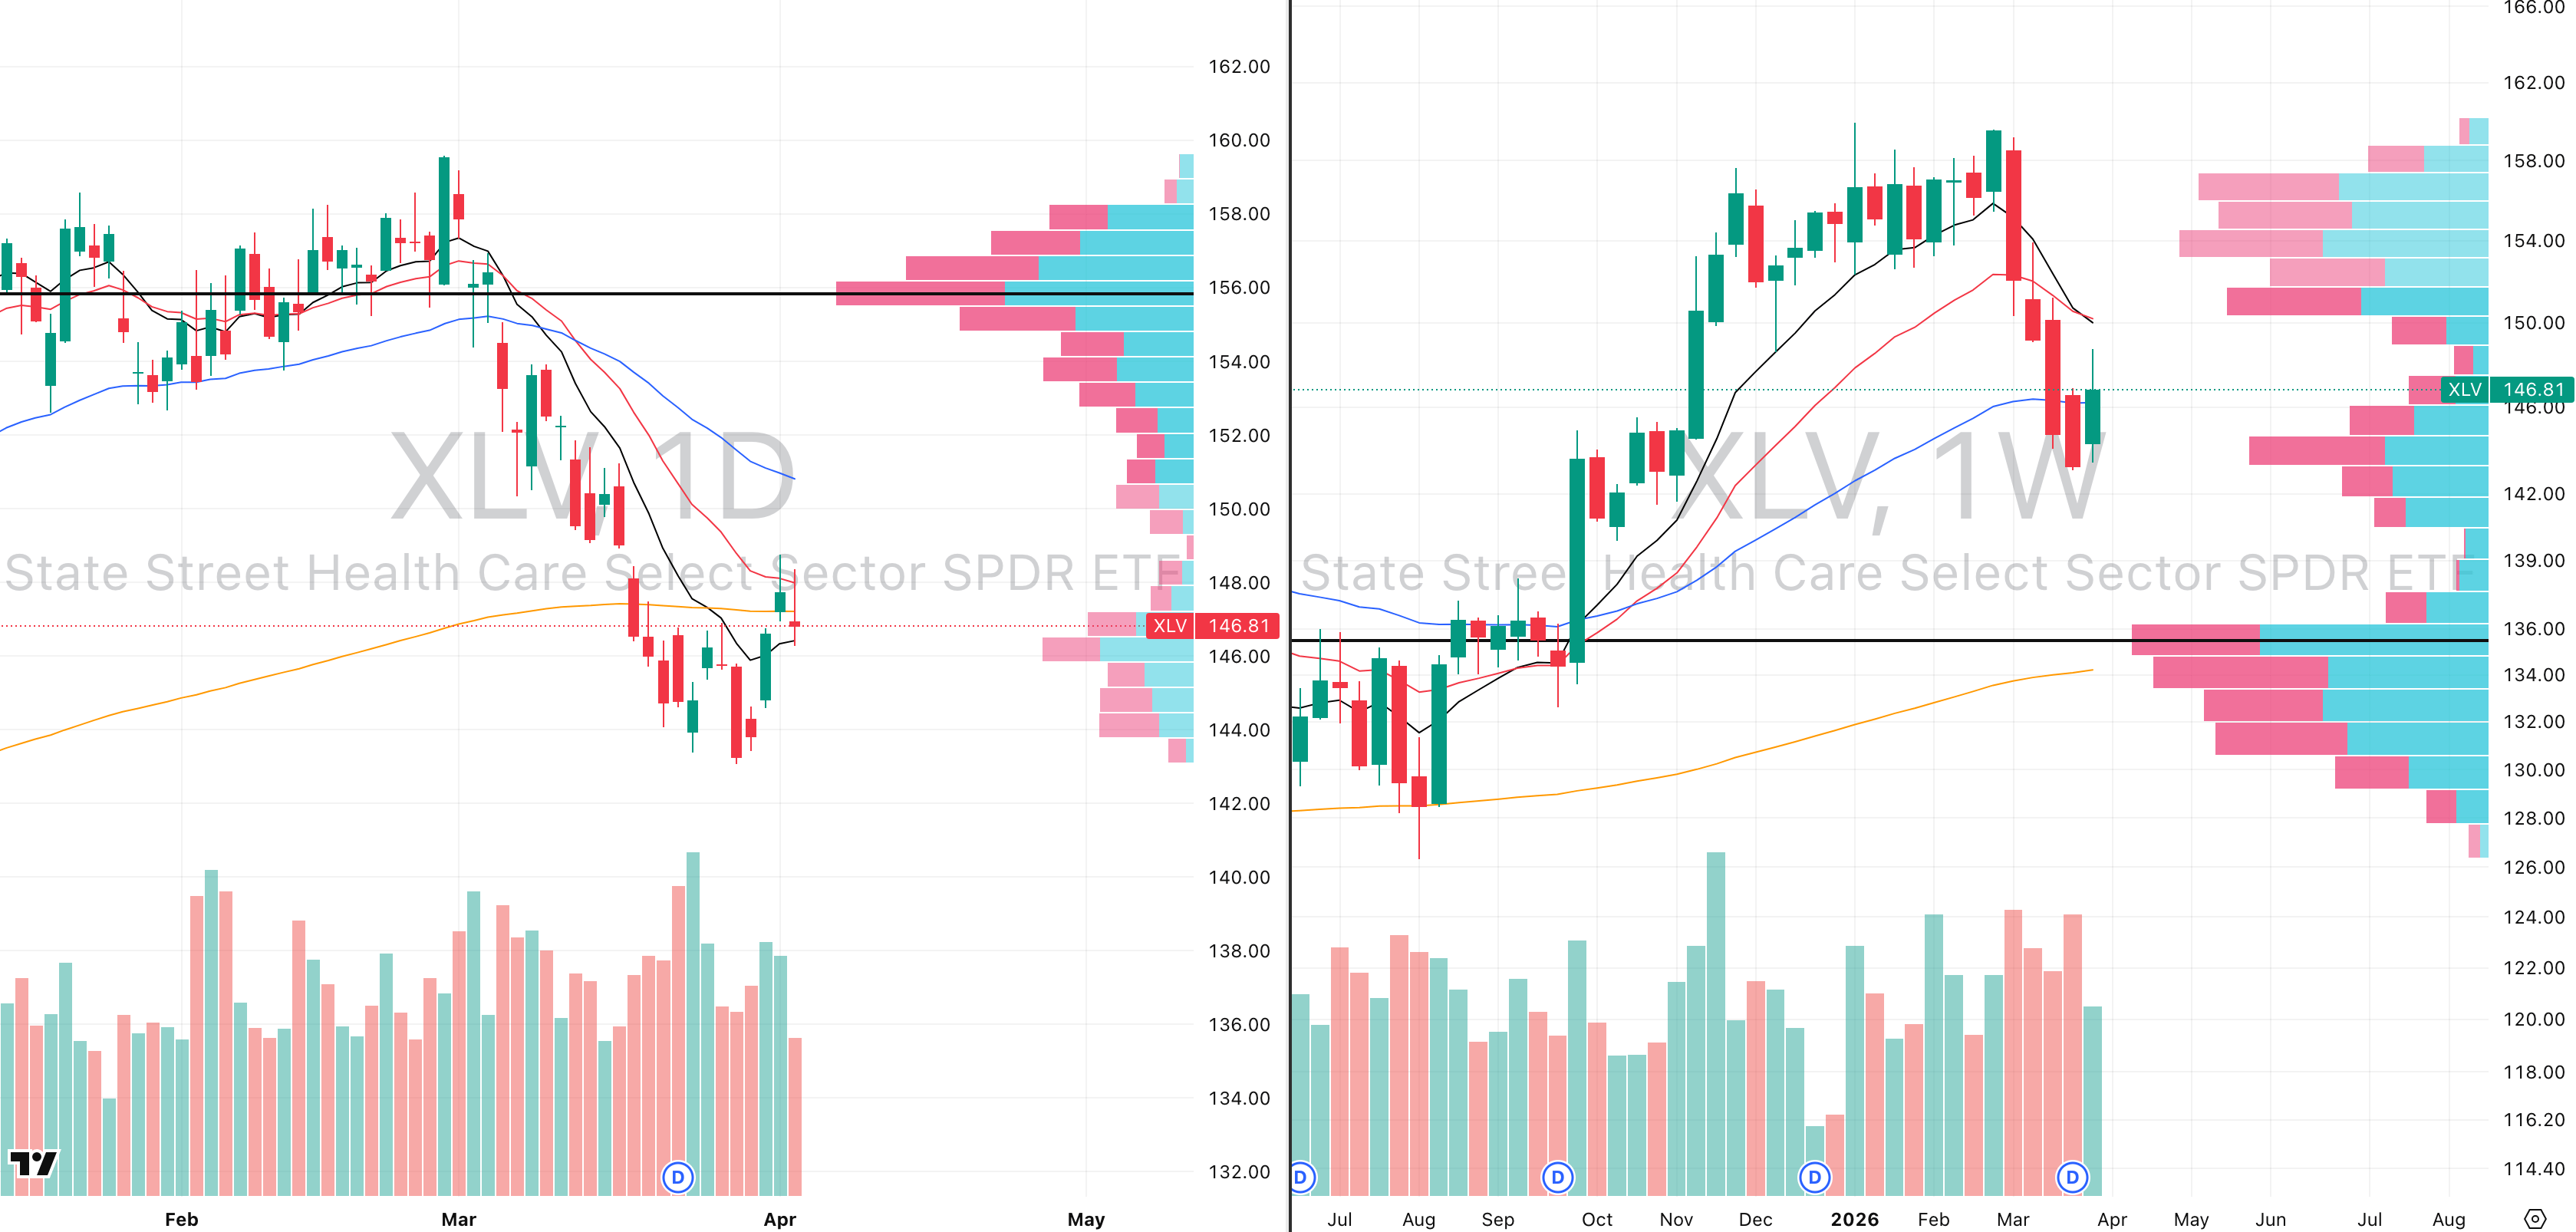
XLV VRVP Daily & Weekly Chart
Performance: 1W: +1.8% | 1M: -5.1% | 3M: -3.8% | 6M: +3.2% | 1Y: +7.5% | YTD: -3.8%
XLV's bounce mid-week was rejected precisely at the declining 20-day EMA on Thursday, and the three-day rally into that rejection came on consistently declining relative volume and is the hallmark of a bull trap rather than a genuine reversal.
The aggressive 22-day Stage 4 decline below the 50-day EMA which was broken at $155 off the double top reversal moved this sharply because it knifed through a low volume pocket on the VRVP between the declining 10 and 20-week EMAs at $150 down to the 50-week EMA at $147. Low volume pockets are zones where historical transaction volume is minimal, meaning price moves through them rapidly with almost no natural support. That pocket is now filled.
Going forward, the focus shifts to the $143.40 dense VRVP support cluster at the next meaningful demand zone and the price target for the coming week, representing approximately a 2.55% further decline from current levels. Above that level, consolidation is the base case; below it, the next leg lower opens.
Industry group internals show the bounce was narrow — Biotechnology +3.1% and Drug Manufacturers - General +2.7% on the week led while Health Information Services -4.2% and Healthcare Plans -3.9% continued declining; YTD, Health Information Services -20.9% and Healthcare Plans -18.3% remain the most damaged groups while Medical Distribution +0.3% holds near flat. Watch $143.40 as the critical support — a close below it with volume reopens the deeper downside.
Consumer Discretionary (XLY)
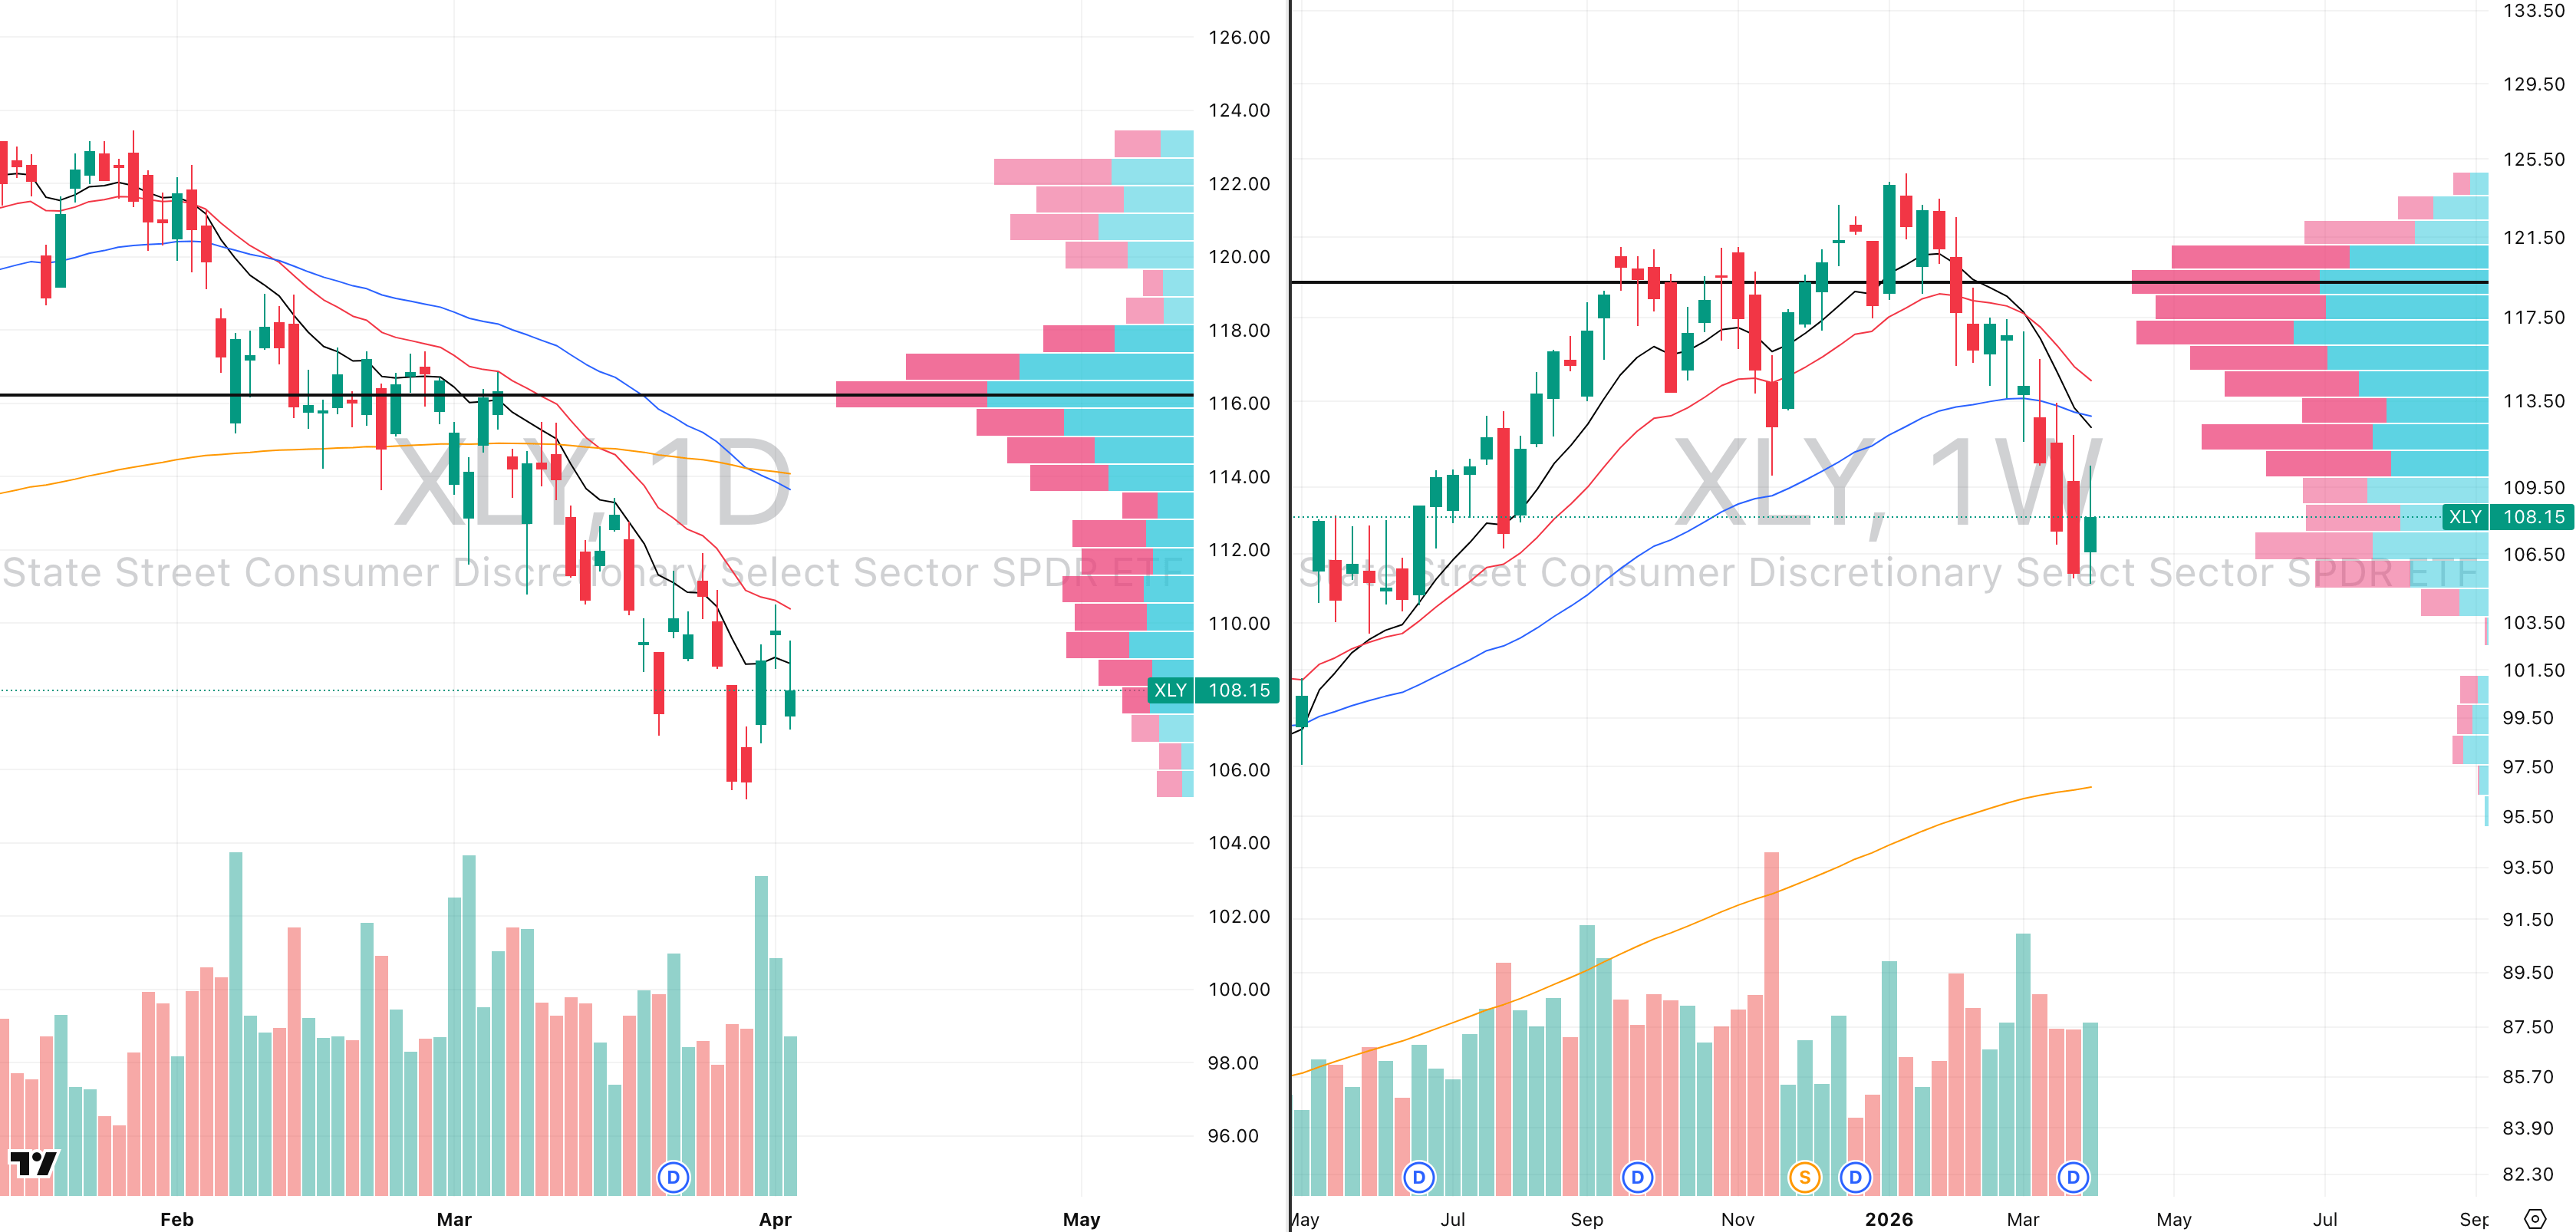
XLY VRVP Daily & Weekly Chart
Performance: 1W: -0.2% | 1M: -6.5% | 3M: -10.4% | 6M: -12.1% | 1Y: +6.7% | YTD: -10.4%
XLY is in an extremely linear sell-off with one notable technical characteristic that is worth paying attention to as the relative volume is not expanding on the decline. When a sector falls persistently on shrinking volume, it increases the probability of a bounce because it signals that selling is becoming exhausted rather than accelerating.
However, the critical question is whether that bounce is tradeable and the answer right now is no. XLY is at approximately -3.8 ATR multiples from its 50-week EMA, approaching oversold territory, and is consolidating above the 20-month EMA at $108.45. That level must hold but the problem is that every technical signal — stage 4 breakdown, declining EMAs, the prior $112 support flipped to resistance — argues against trying to catch this move.
On the monthly structure, relative volume is actually expanding on the sell-off, meaning the primary trend participants are actively selling. Industry group internals show the weakness is broad — Internet Retail -2.2% and Gambling -4.6% on the week led declines while Auto & Truck Dealerships +4.5% and Furnishings, Fixtures & Appliances +0.7% showed pockets of resilience; YTD, Auto & Truck Dealerships -16.1%, Footwear & Accessories -24.6%, and Internet Retail -11.3% carry the heaviest damage.
The 20-month EMA at $108.45 is the level — consolidation above it is the minimum requirement before any recovery thesis can be considered.
Industrials (XLI)
XLI VRVP Daily & Weekly Chart
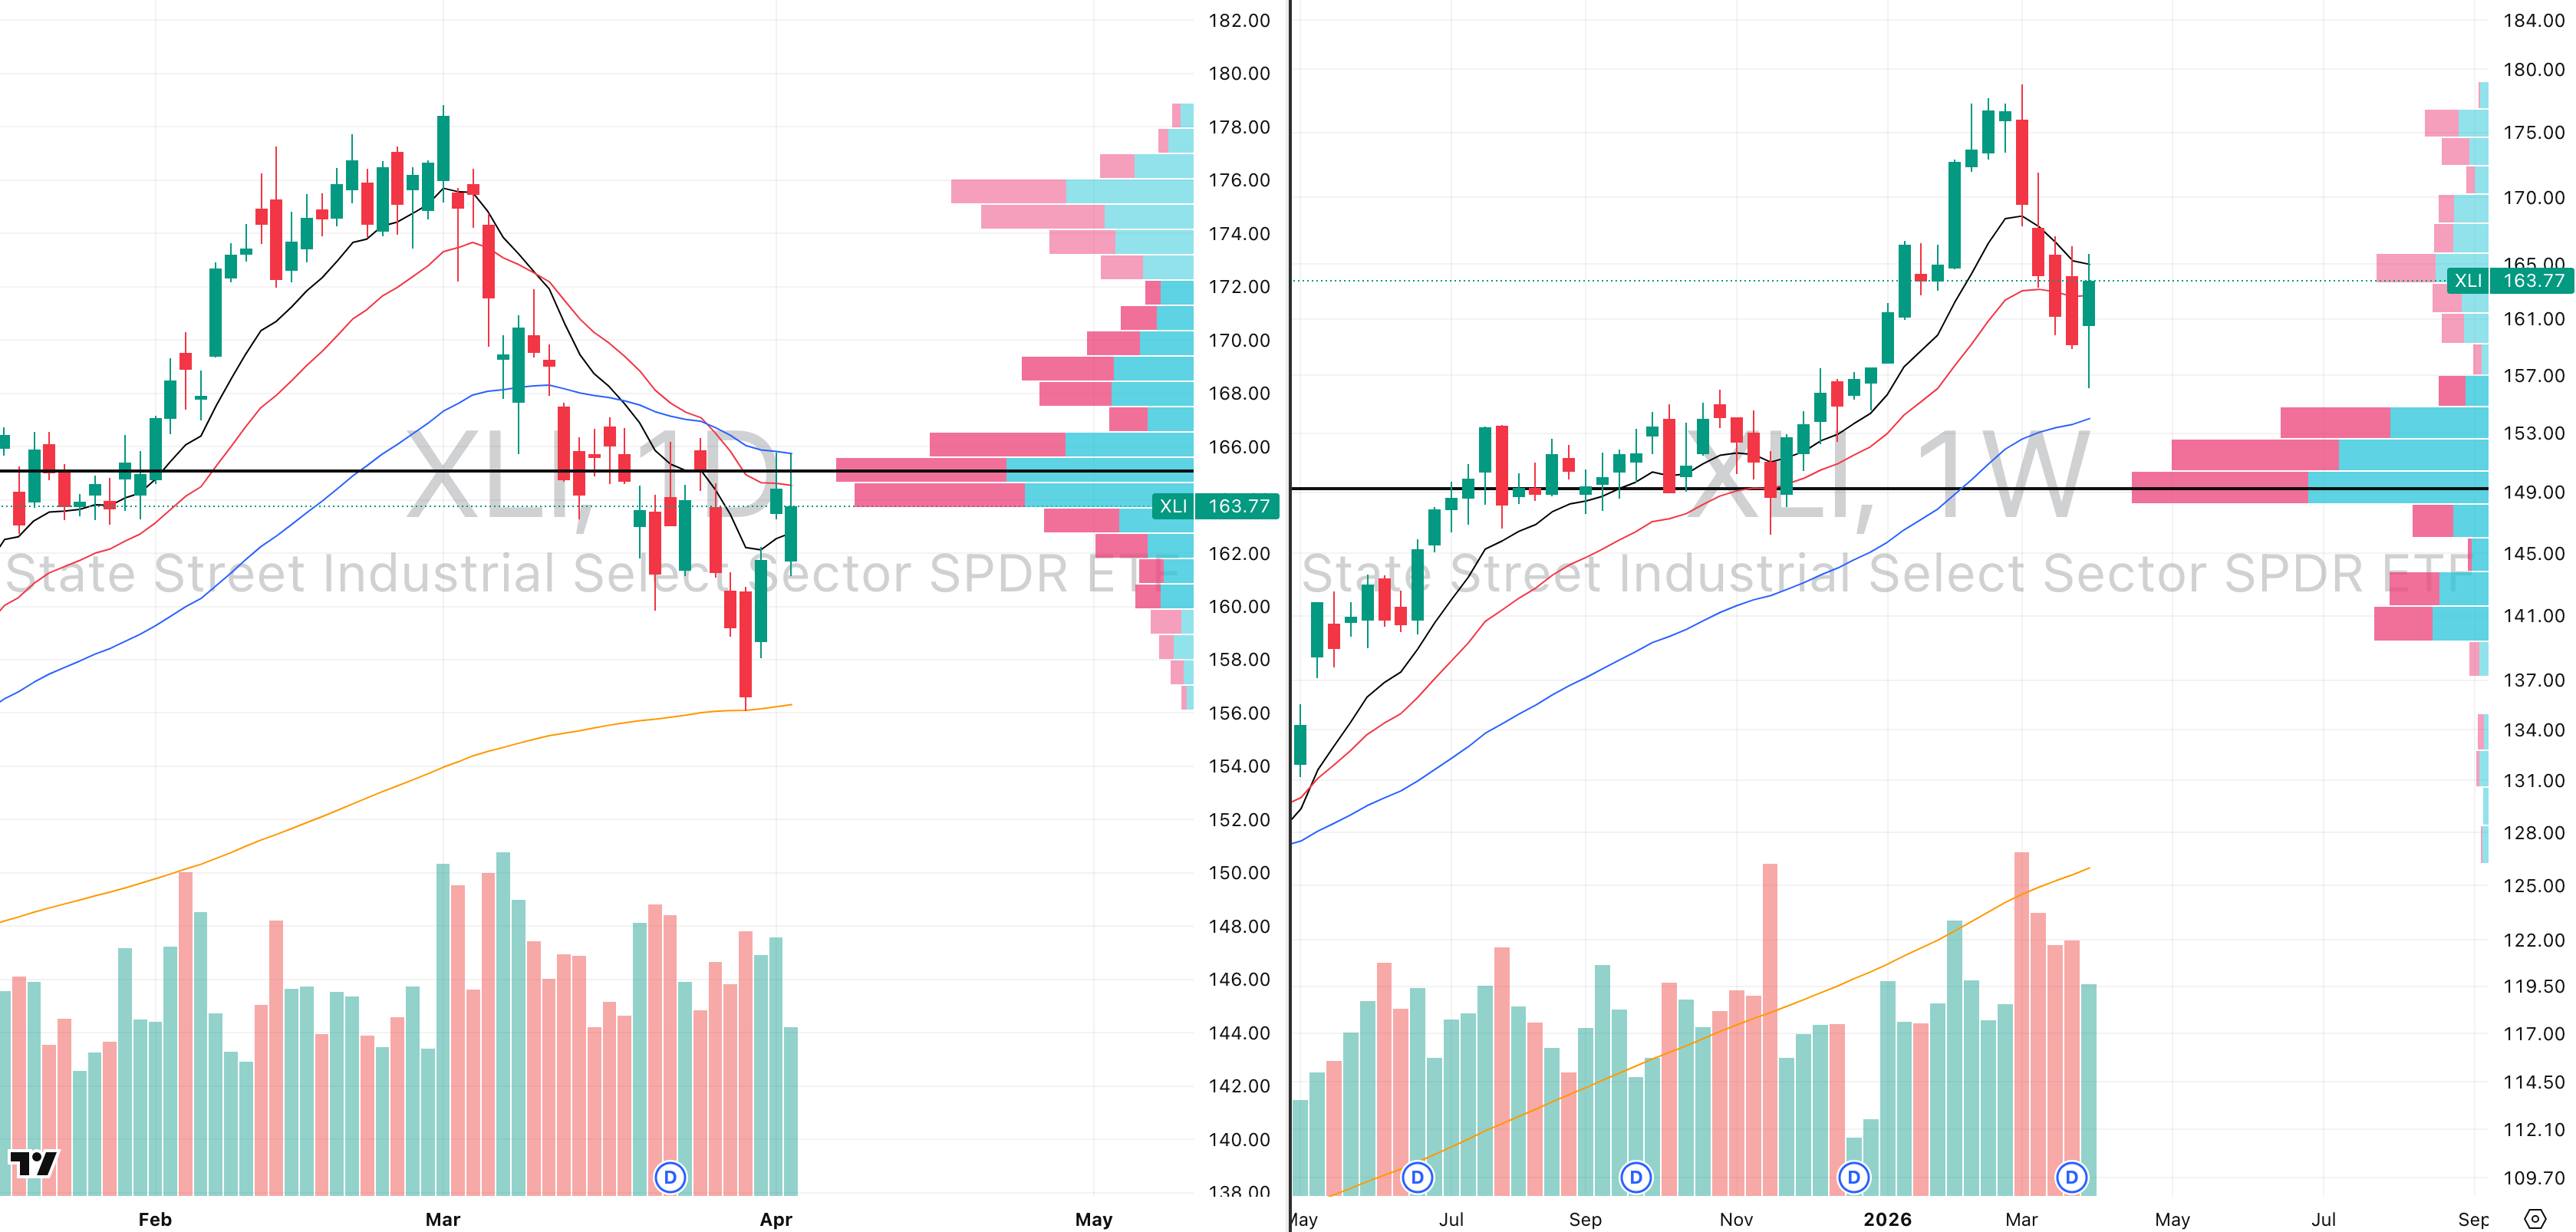
Performance: 1W: +1.8% | 1M: -6.6% | 3M: +6.8% | 6M: +8.3% | 1Y: +28.4% | YTD: +6.8%
XLI bounced this week but the bounce has no technical credibility. The rally from the March 31st lows ran directly into the 50-day EMA at $165.87 and was rejected there for two consecutive sessions on only 70% relative volume and less than three-quarters of normal participation on the very candle that should have shown demand if the move were genuine.
The 10-week and 20-week EMAs are both declining and price is trading below them, meaning every rally attempt is simply running into a wall of overhead supply rather than breaking through it.
The breakout level that would change the thesis is $166.65, a close above that on expanding volume would signal genuine demand returning, but given the weakness in Russell 2000 constituents that make up a significant portion of industrial names, the probability of that breakout is low.
The base case is a retest of the $156 lows from last week, where the rising 200-day EMA is converging and which could form a double bottom if demand shows up there on volume. Industry group internals show the bounce was selectively driven — Engineering & Construction +1.5% and Aerospace & Defense -3.1% on the week showed the dispersion while Farm & Heavy Construction Machinery +1.9% and Railroads +1.9% added modest positive contributions; YTD, Engineering & Construction +19.2% and Farm & Heavy Construction Machinery +21.5% remain the structural leaders while Airlines -13.2% and Consulting Services -16.6% carry the heaviest damage.
Watch $156 and the 200-day EMA — that is where the double bottom either forms or fails.
Consumer Staples (XLP)
XLP VRVP Daily & Weekly Chart
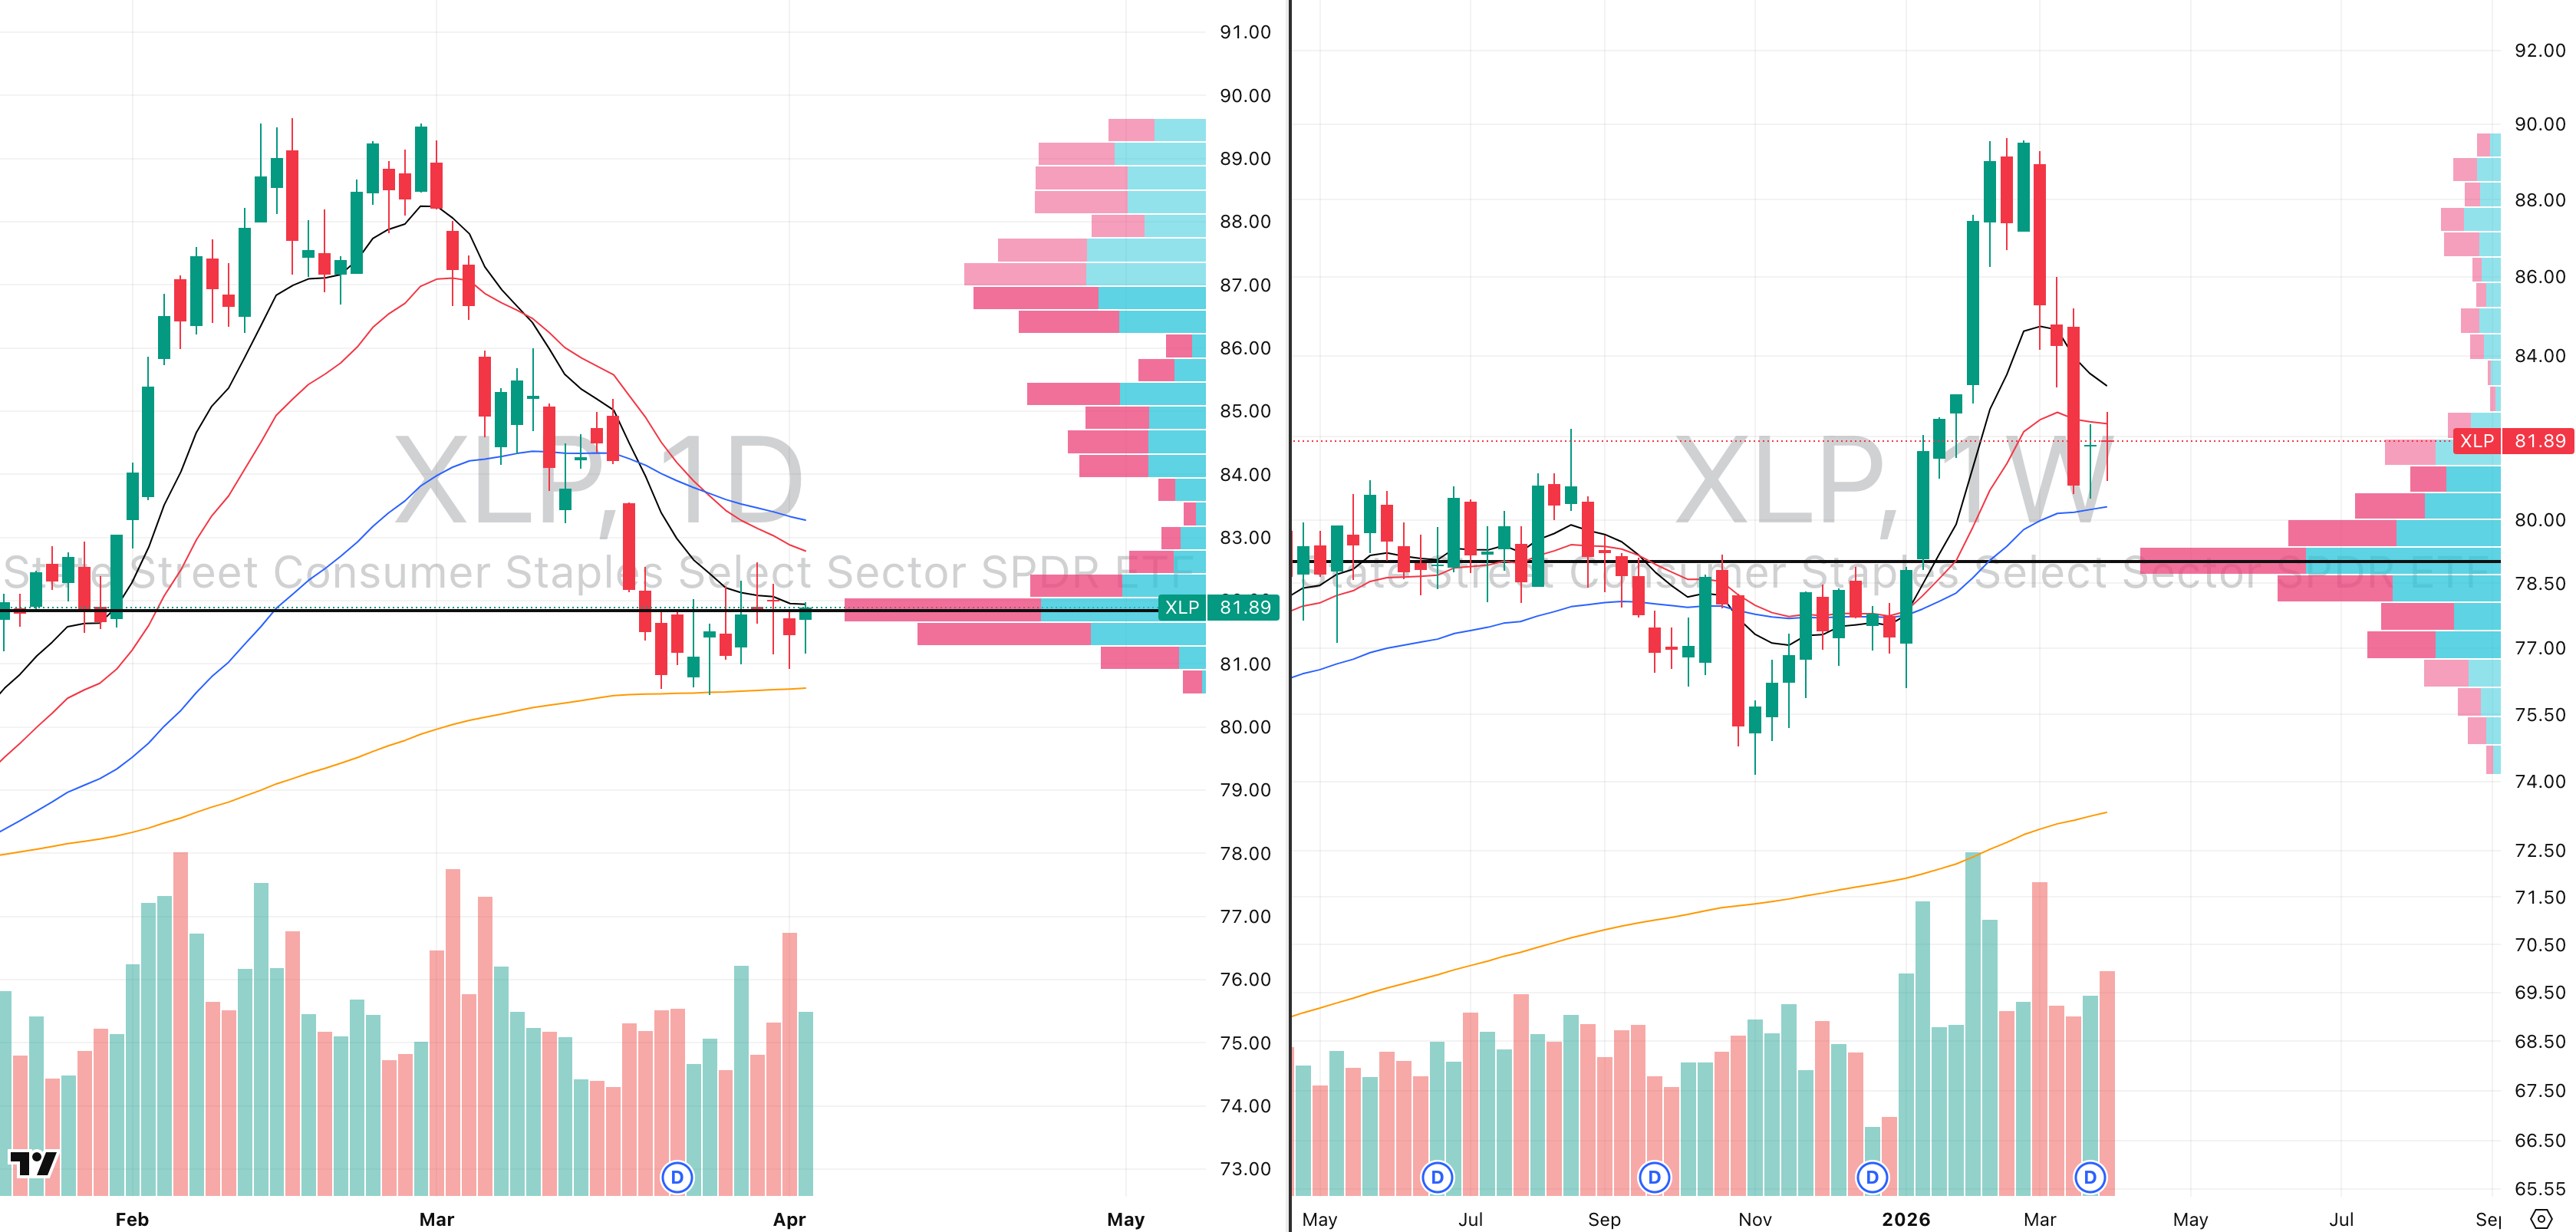
Performance: 1W: +1.4% | 1M: -5.0% | 3M: +6.4% | 6M: +6.8% | 1Y: +5.9% | YTD: +6.4%
XLP is the most constructive technical setup in the equity market right now. An inverse head and shoulders pattern is forming, left shoulder between January 14th and February 2nd, right shoulder between March 19th and April 2nd, with price trending along the 200-day EMA and showing genuine buying pressure at the lows.
On the weekly VRVP, the three recent weekly lows show approximately 24 million shares traded green against 18 million red — buyers are actively showing up at this level, which is a measurable demand signal rather than a hope-based support thesis.
The rising 50-week EMA at $80.25 is the critical anchor, and a near-term retest of $80.30, approximately 1.57% lower and the confluence of the 20-day EMA and 50-week EMA, would not be surprising and would likely represent the final shakeout before any recovery.
Industry group internals reflect the sector's relative resilience — Beverages - Brewers +4.5% and Beverages - Non-Alcoholic +2.4% on the week led while Household & Personal Products -1.4% lagged; YTD, Grocery Stores +10.4% and Beverages - Non-Alcoholic +6.0% are the strongest subsectors while Household & Personal Products -4.2% and Tobacco -1.0% are the notable underperformers.
Consumer Staples is the one sector where the technical evidence suggests a near-term floor may be forming — the inverse head and shoulders, the 50-week EMA support, and measurable VRVP demand all point in the same direction.
Energy (XLE)
XLE VRVP Daily & Weekly Chart
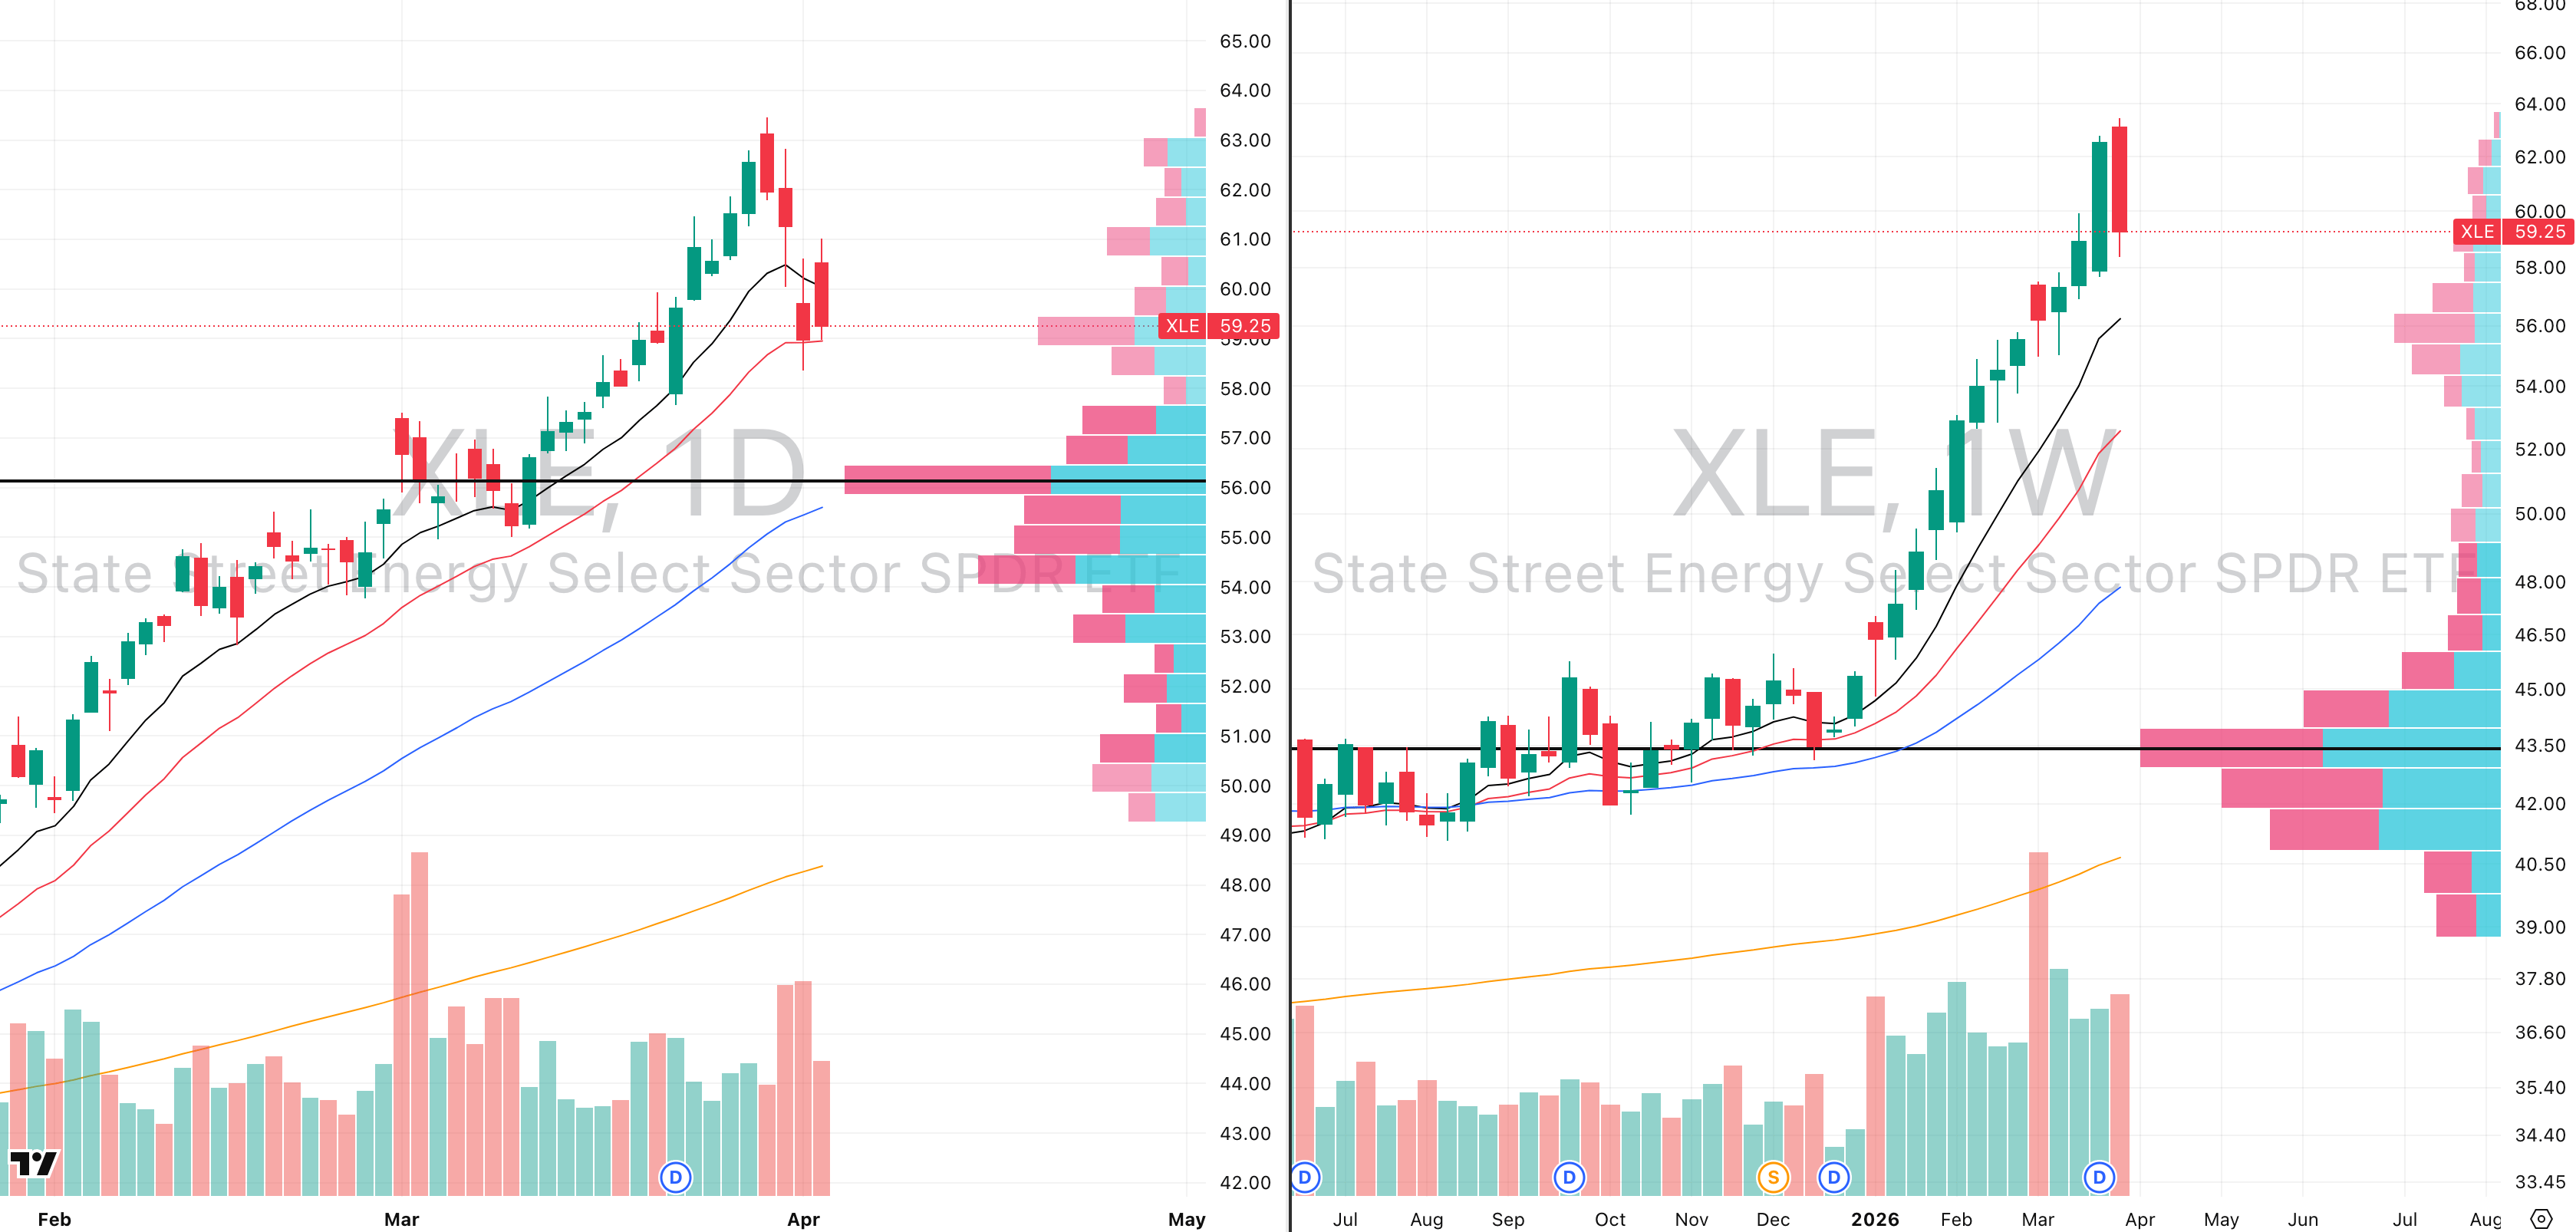
Performance: 1W: -1.8% | 1M: +8.1% | 3M: +33.6% | 6M: +34.6% | 1Y: +31.9% | YTD: +33.6%
Last week delivered the mean reversion that extended positioning warranted — a 161% relative volume pullback week down approximately 8%, nearly twice the average weekly range, unwinding from 7 ATR multiples above the 50-week EMA at the Monday peak.
That extension has now compressed to approximately 3 ATR multiples, which is a meaningful reset and energy is no longer in the danger zone for new long entries that it was at 7-8 ATR multiples. The 20-day EMA is holding at current levels, and with crude oil continuing to push higher driven by an escalating Middle East situation that shows no sign of de-escalation, the bull case for energy remains structurally intact.
The downside scenario, approximately 5.4% to the 10-week EMA, is possible but not the base case as long as crude holds its bid. The critical shift this week is that energy has moved from a "hold only" situation back into a "can look for long entries" situation, specifically on pullbacks to the rising 10 and 20-day EMAs.
Industry group internals remain broadly positive despite the weekly pullback — Oil & Gas E&P -3.7% and Oil & Gas Drilling -4.2% led the mean reversion while Oil & Gas Midstream -2.7% and Oil & Gas Integrated -0.6% showed relative resilience; YTD the readings remain extraordinary across the board — Oil & Gas Drilling +54.7%, Oil & Gas E&P +36.0%, Oil & Gas Equipment & Services +36.3%, and Oil & Gas Refining & Marketing +41.2%.
At 3 ATR multiples from the 50-week EMA with crude oil still pushing, pullbacks to the 10 and 20-day EMAs are now the tactical entry framework.
Materials (XLB)
XLB VRVP Daily & Weekly Chart
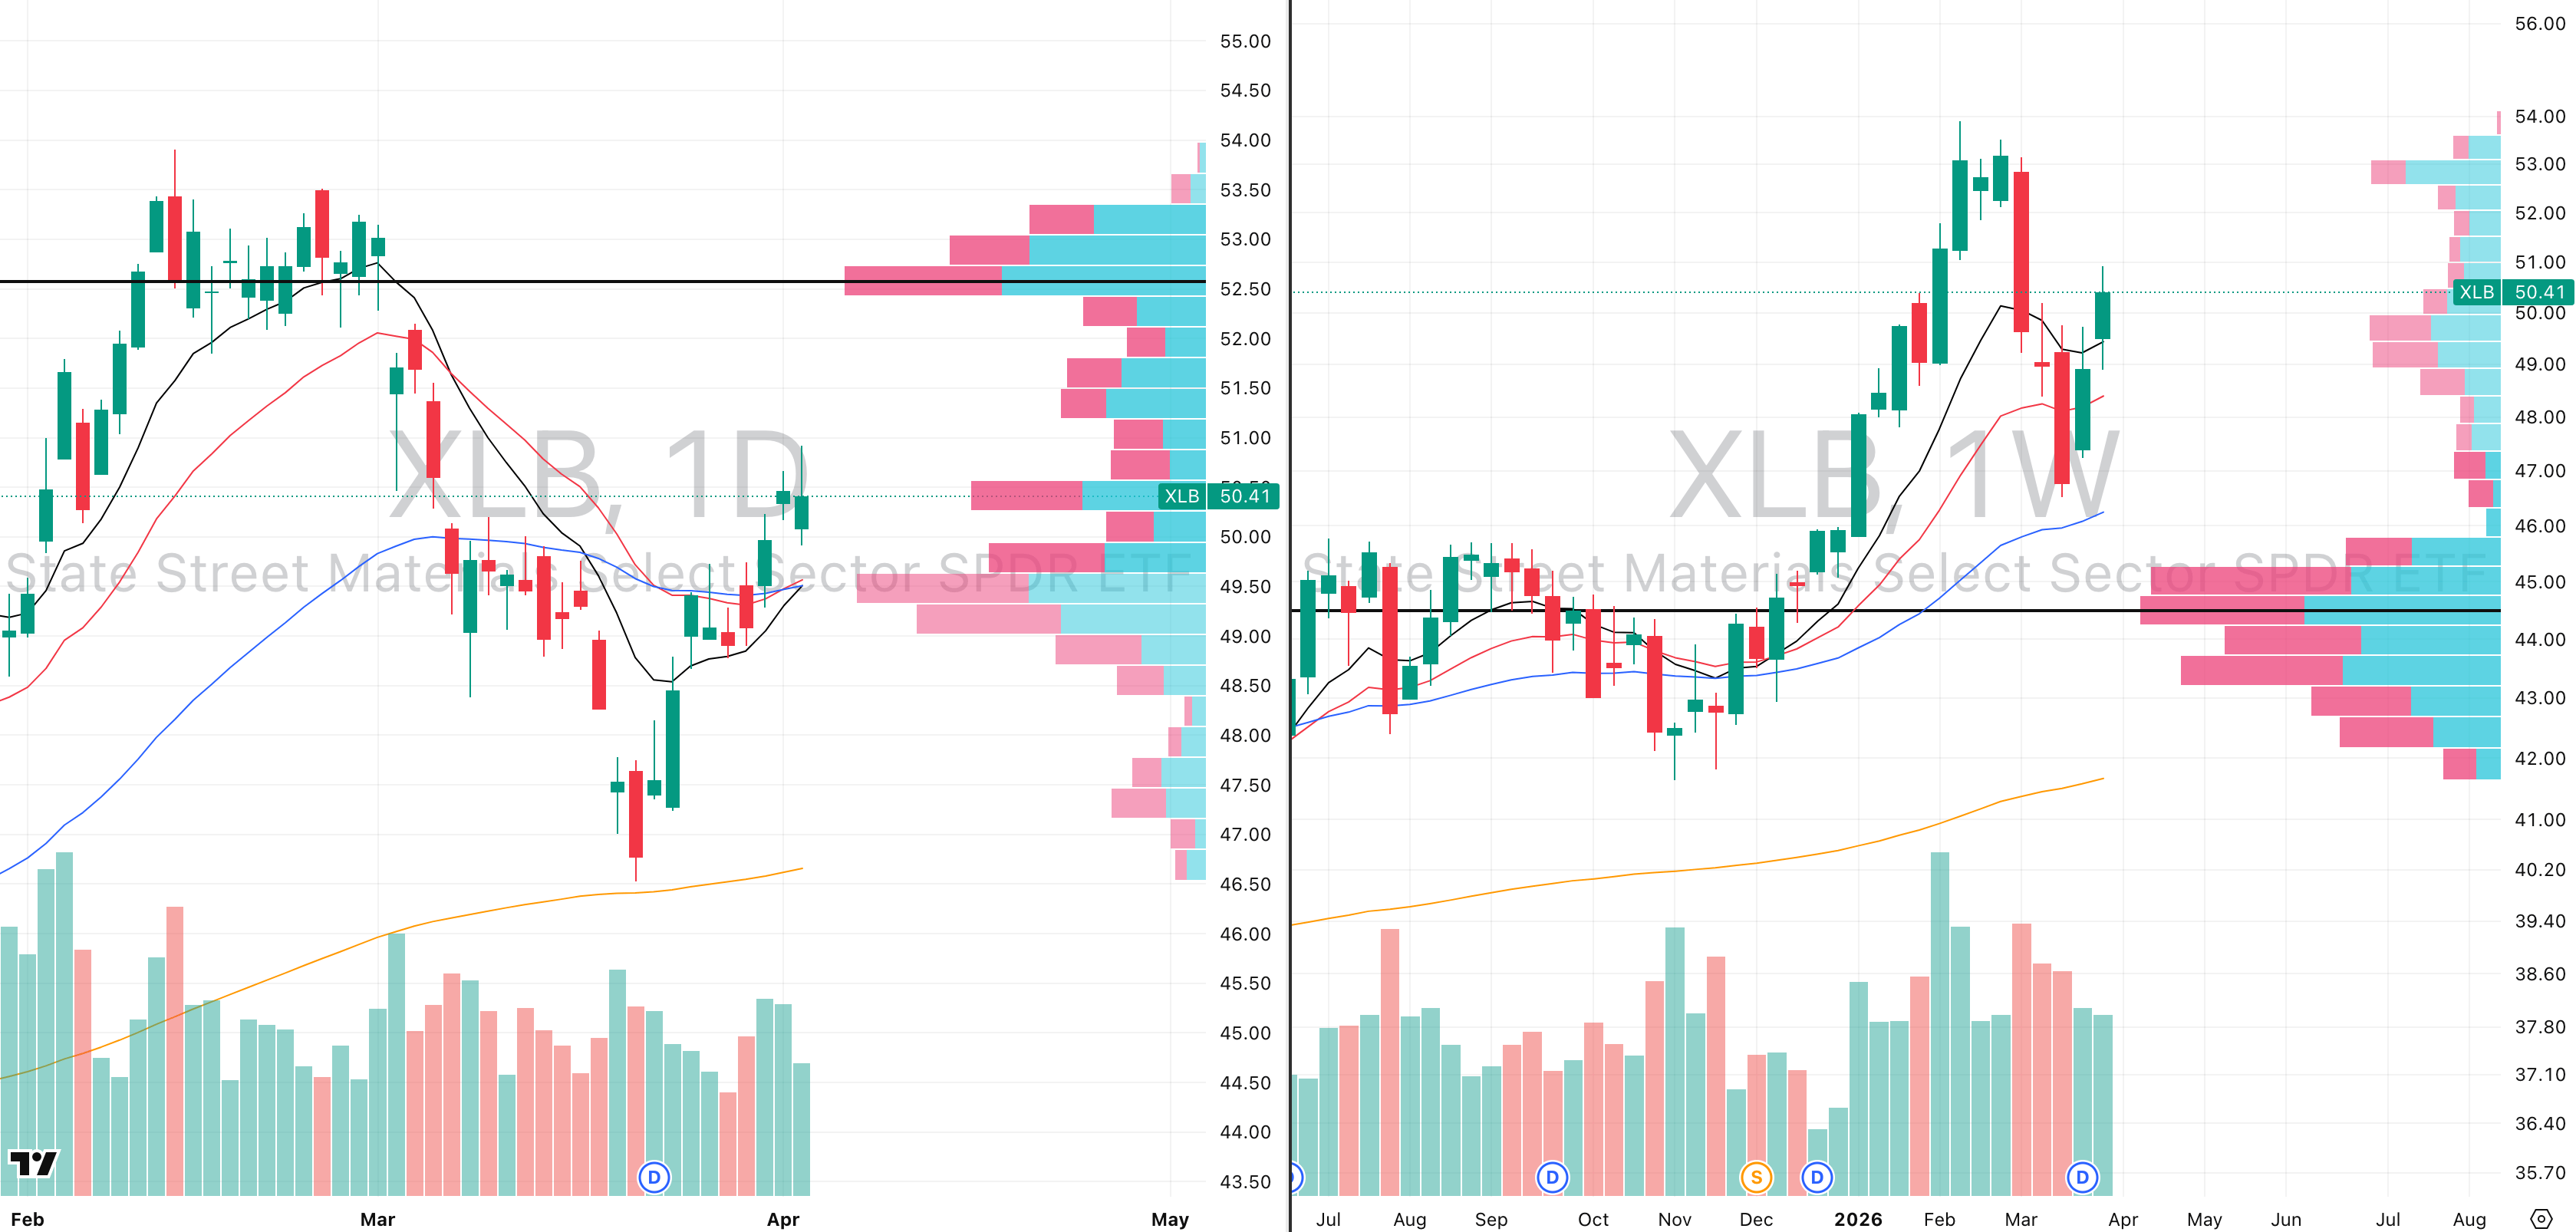
Performance: 1W: +6.9% | 1M: -5.5% | 3M: +13.7% | 6M: +21.7% | 1Y: +46.1% | YTD: +13.7%
Materials is now one of the market's relative strength leaders at approximately 75 RS against the SPX, and the technical structure has shifted meaningfully. The inverse head and shoulders pattern, left shoulder March 9th to 17th, head March 19th to 24th, right shoulder March 25th to 31st, has now broken out, invalidating the prior head and shoulders topping structure and pushing XLB up to $50.41, an 8.55% rally from the March 20th low.
The near-term expectation is a pullback to approximately $49.73 where the rising 10-day, 20-day, and 10-week EMAs are converging — this is a normal and healthy retest of the breakout level rather than a reversal signal, and that confluence of moving averages is expected to hold.
One important distinction for traders: Materials is heavily weighted toward chemicals, not gold and silver, those wanting precious metals exposure should be looking at XME rather than XLB. Industry group internals confirm chemicals are doing the heavy lifting — Chemicals +12.8% and Coking Coal +12.6% on the week led the sector while Gold +14.3% and Silver +13.2% surged independently; YTD, Chemicals +60.5% is the dominant driver while Aluminum +38.7% and Other Precious Metals +4.99% add further breadth; the laggards are concentrated in packaging — Packaging & Containers -2.3% and Paper & Paper Products +2.4% trail significantly.
The inverse head and shoulders breakout with a 75 RS rating makes Materials one of the few sectors with a constructive technical setup — watch the $49.73 EMA confluence as the retest level.
Communication Services (XLC)
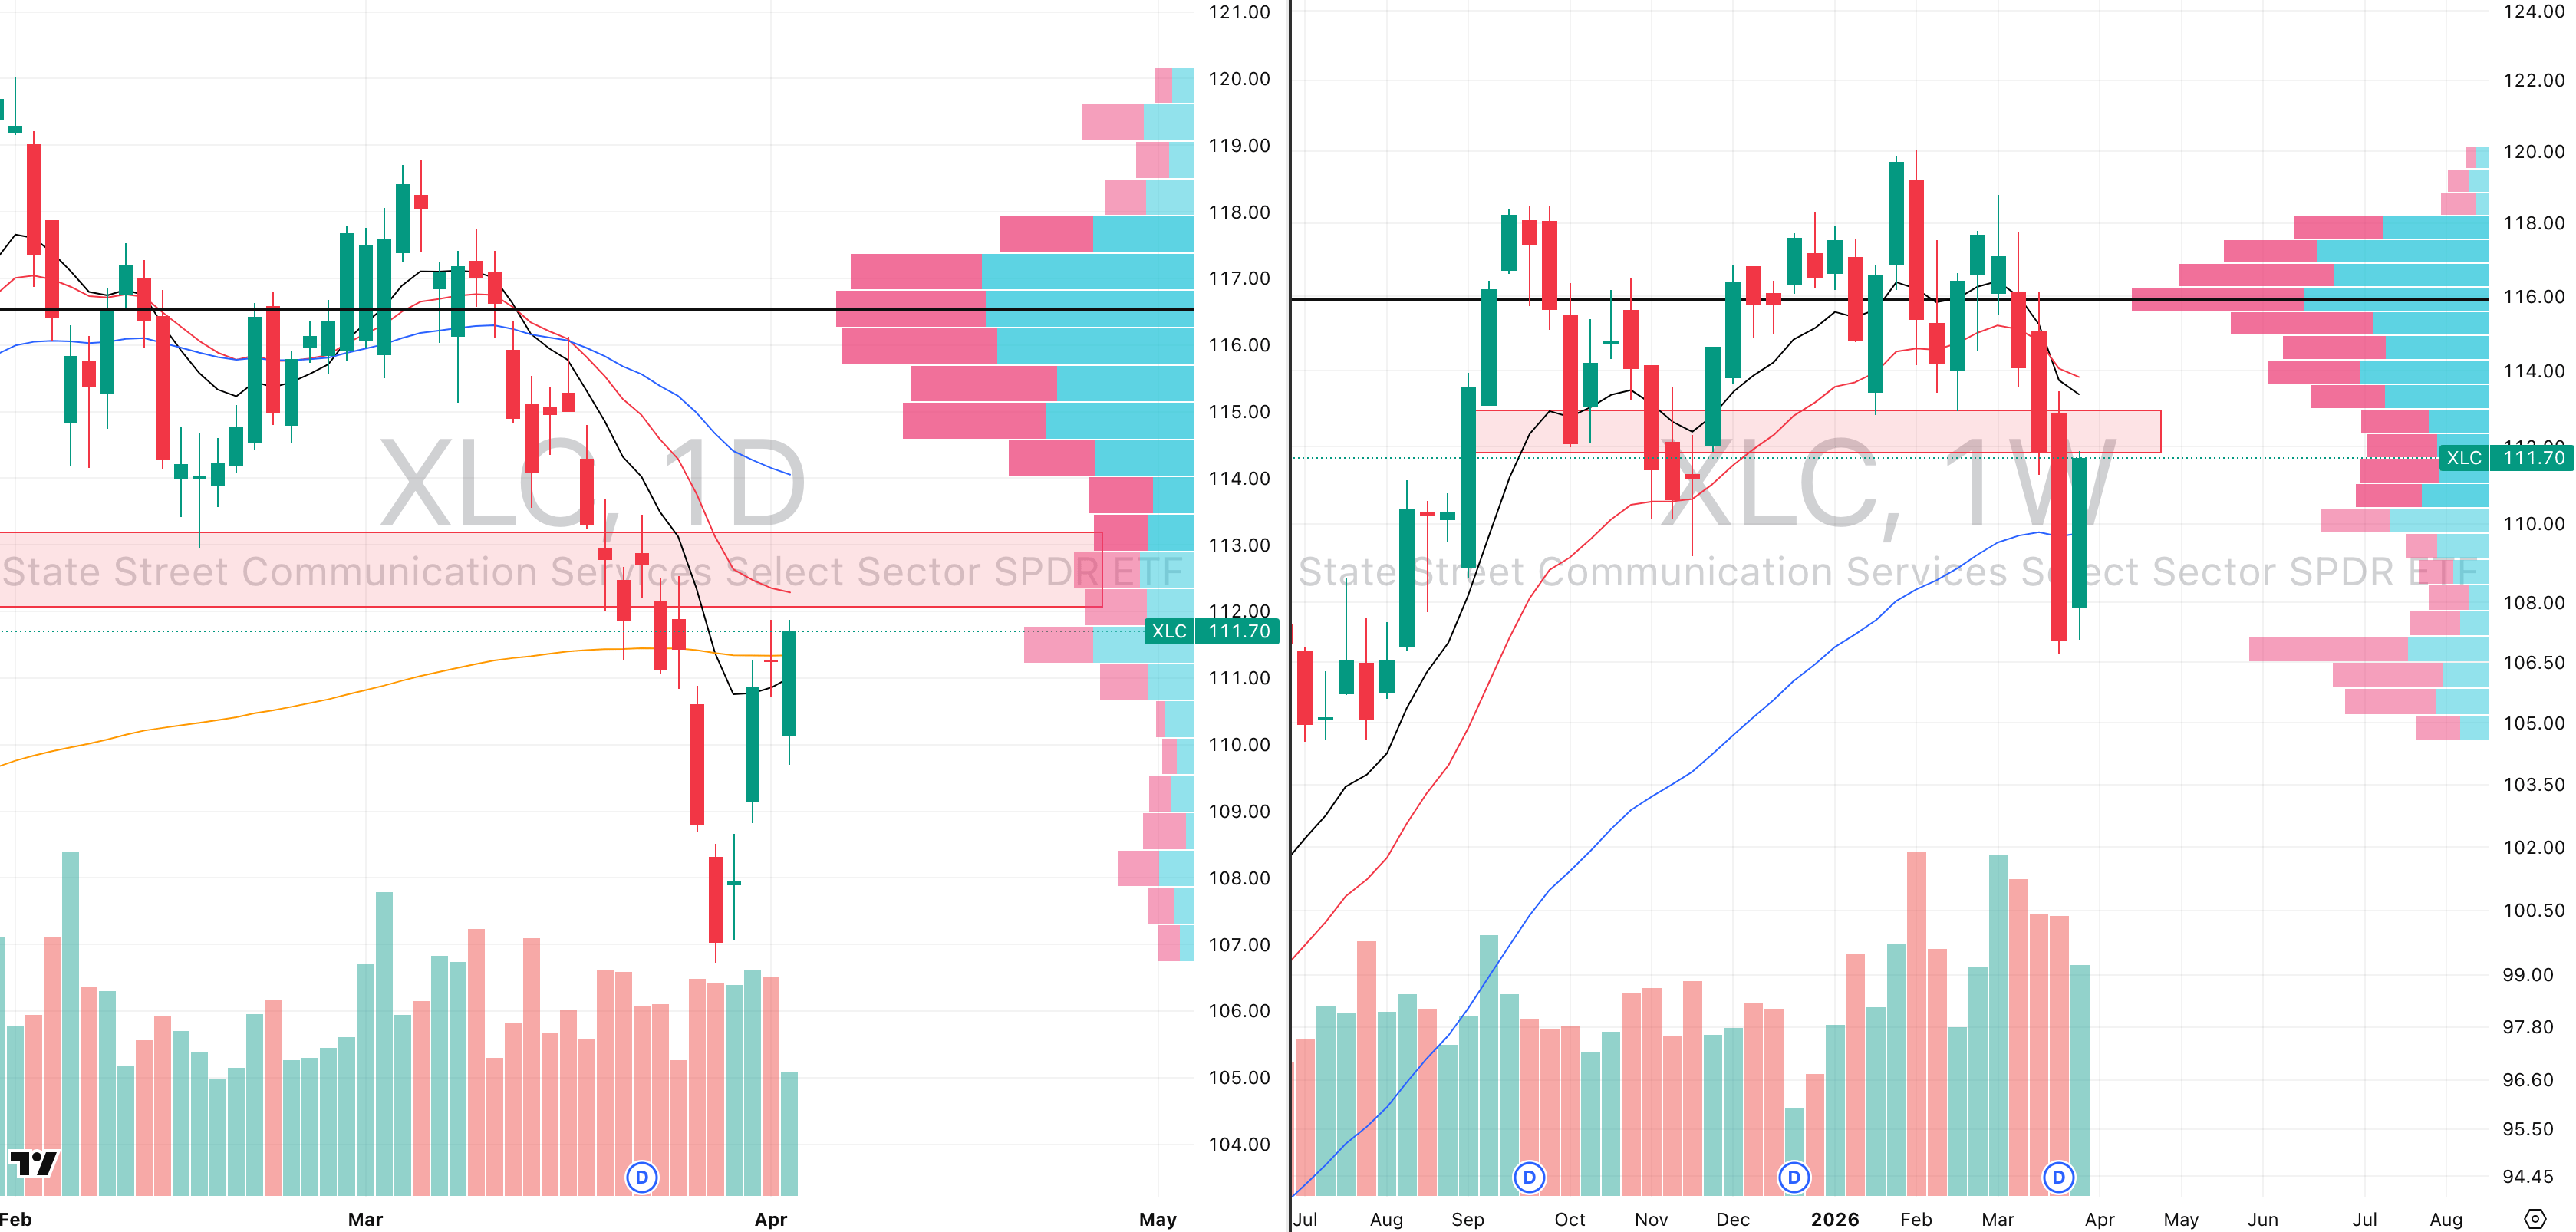
XLC VRVP Daily & Weekly Chart
Performance: 1W: +3.6% | 1M: -5.7% | 3M: -6.8% | 6M: -1.8% | 1Y: +28.0% | YTD: -6.8%
XLC managed a bounce back above the 50-week EMA and 200-day EMA, but the quality of that recovery is immediately questionable, Friday's bounce came on only 66% relative volume, meaning a third of normal market participation was absent on the day the sector most needed to show demand conviction.
The supply zone up to approximately $113.15 contains significant trapped selling pressure, and consolidation below that level is the base case for the coming week rather than any sustained recovery. The correct framework for trading XLC right now is not to watch the ETF itself, it is to watch Google and Meta directly, as the two highest cap-weighted names will determine where XLC goes regardless of what the remaining constituents do.
Google did produce a tradeable bounce off its rising 200-day EMA, which is a constructive development worth monitoring. Industry group internals show the weekly bounce was driven by a narrow group — Internet Content & Information -9.2% YTD remains deeply damaged while Telecom Services +10.9% YTD continues to be the only consistent positive contributor; on the week, Broadcasting -5.5% continued its severe underperformance while Entertainment -0.9% showed marginal resilience; Advertising Agencies -38.2% YTD remains the most structurally damaged group in the entire sector. Google and Meta are the proxies — watch them, not XLC.
Utilities (XLU)
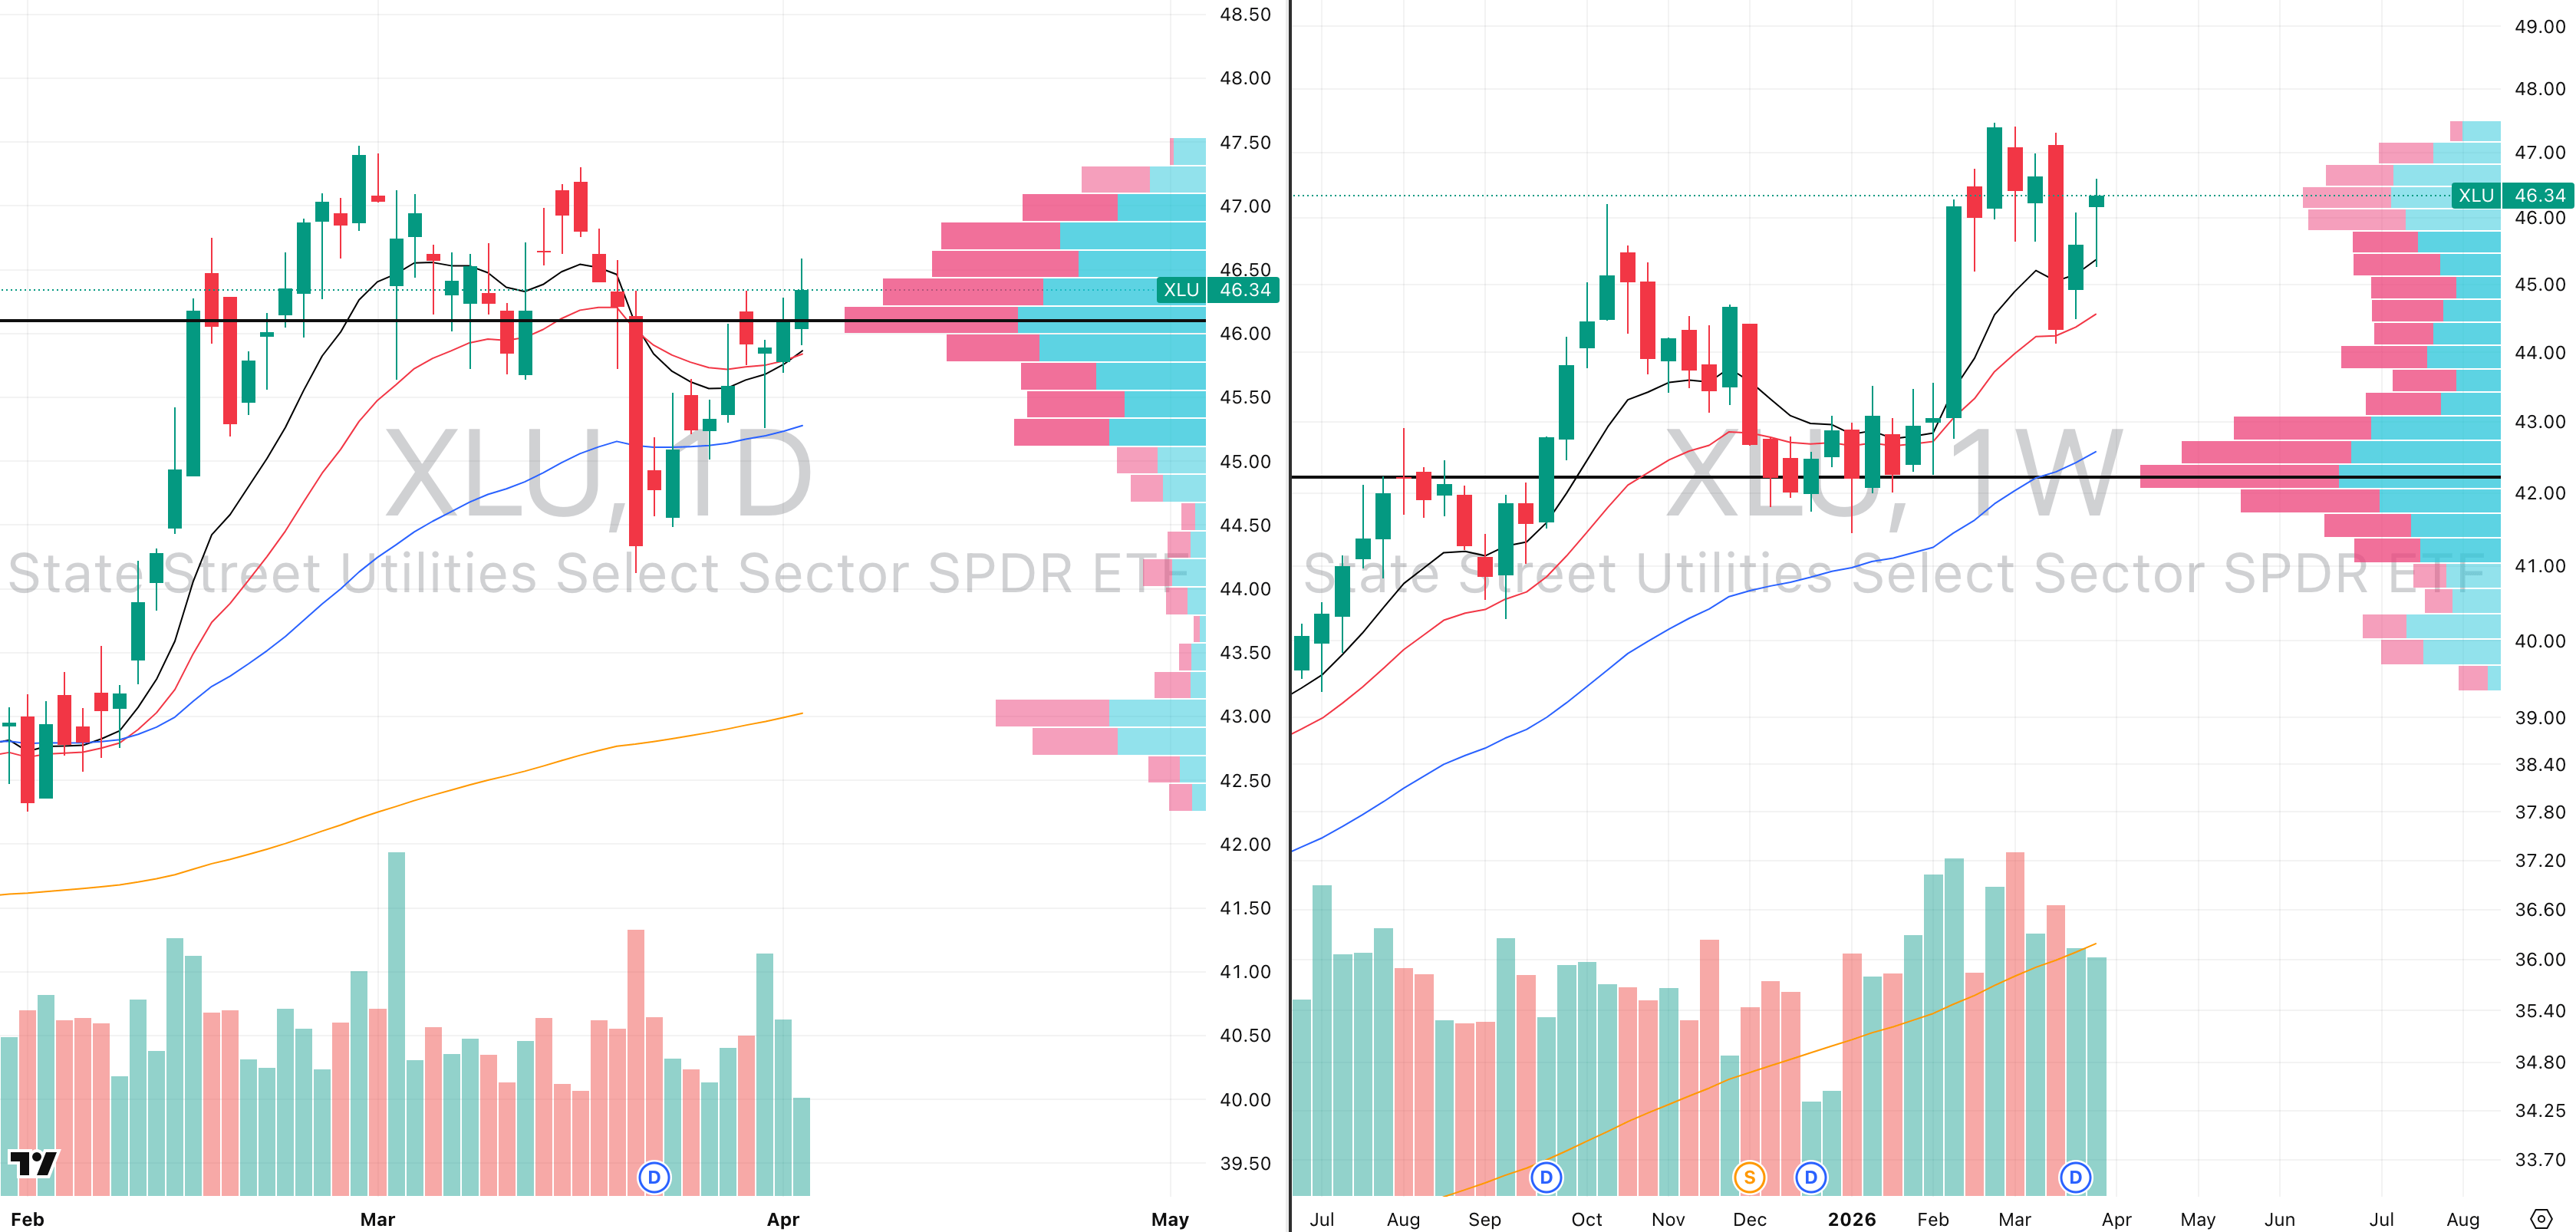
XLU VRVP Daily & Weekly Chart
Performance: 1W: +2.4% | 1M: -1.8% | 3M: +8.3% | 6M: +6.6% | 1Y: +20.9% | YTD: +8.3%
Utilities are now the second strongest sector in the market behind energy, carrying a 72 relative strength rating against the SPX and producing an impressive bounce off the 10-week EMA at $45.35 last week. The 20-week EMA trend has held as support going all the way back to the Stage 2 rally that began in April 2025, approximately 378 days of evidence, with the rare undercuts always resolving back above rather than breaking down, which is an unusually consistent technical track record.
Friday's session did produce a low volume bounce at approximately 60% relative volume, which means a breakout attempt should not be expected imminently — the sector needs volume to confirm any move higher before it becomes actionable on the long side.
The opportunity in utilities right now is not at the index level — it is in identifying the individual stocks within the sector that are showing the strongest relative strength, as those names are most likely to lead any broader market recovery. Industry group internals show broad participation in the strength — Utilities - Independent Power Producers +5.3% and Utilities - Diversified +3.6% on the week led while Utilities - Renewable +3.8% and Utilities - Regulated Electric +3.1% added broad participation; YTD, Utilities - Renewable +18.7% and Utilities - Regulated Water +12.0% lead the complex while Utilities - Independent Power Producers -11.2% remains the notable YTD laggard despite recent bounce.
Stock selection within utilities is the edge — find the RS leaders within the sector and those are your recovery trade candidates.
Real Estate (XLRE)
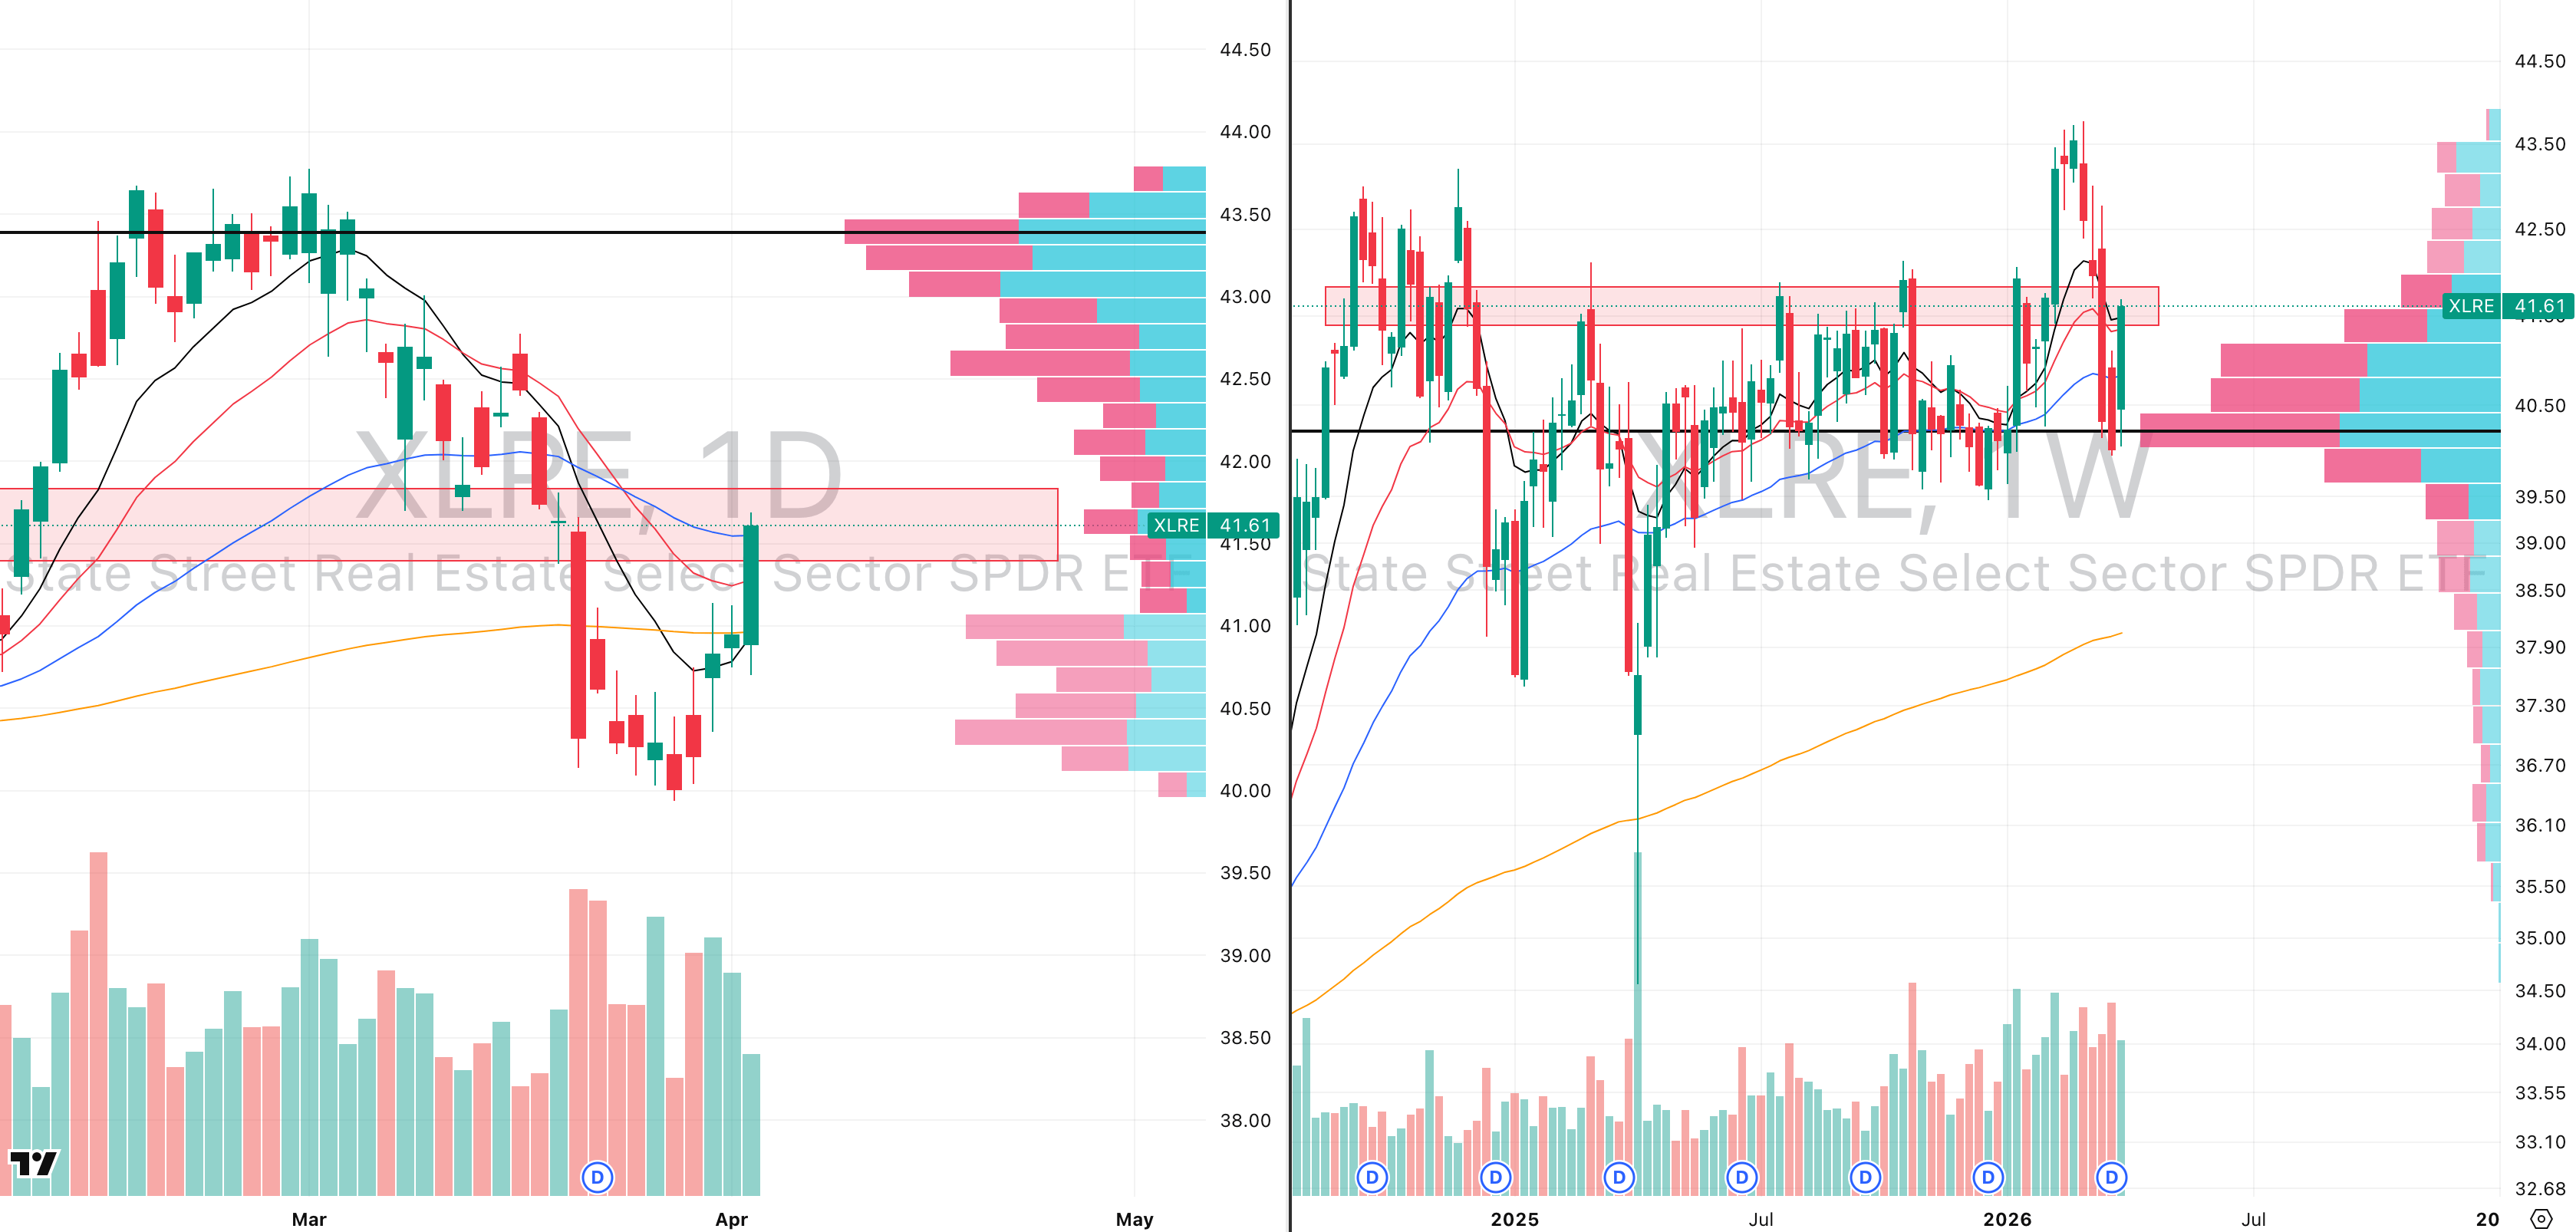
XLRE VRVP Daily & Weekly Chart
Performance: 1W: +2.5% | 1M: -5.4% | 3M: +1.8% | 6M: -2.5% | 1Y: -1.5% | YTD: +1.8%
Real estate bounced off approximately $40.50 on Thursday at 75% relative volume, a below-average participation bounce in a sector that is notorious for choppiness and rate sensitivity. The weekly chart shows significant trapped supply overhead, and the primary trend breakout from February that was triggered by the Iran situation has now fully reversed.
The sector is not one to be actively trading in either direction right now given the noise in the price structure. The level being watched is approximately $41, where the 200-day EMA and 50-week EMA are converging — a pullback to that level is the base case, and it would represent a cleaner technical setup to assess whether genuine demand exists at that confluence.
The potential Eve-Adam double top structure — Eve top September 9th 2024 through December 2nd 2024, Adam top February 9th through March 9th 2026 — remains in play with the $39.67 trigger level still intact below current price.
Industry group internals show mixed signals consistent with the choppy price action — REIT - Specialty +2.2% and REIT - Residential +1.7% on the week led modest gains while REIT - Office -2.1% and REIT - Mortgage +0.3% lagged; YTD, REIT - Healthcare Facilities +7.3% and REIT - Retail +6.7% remain the relative bright spots while REIT - Mortgage -8.3% and REIT - Office -15.8% carry the heaviest structural damage. Wait for the $41 level and the 200-day/50-week EMA confluence — that is the next meaningful decision point for real estate.
COMMITMENT OF TRADERS ANALYSIS
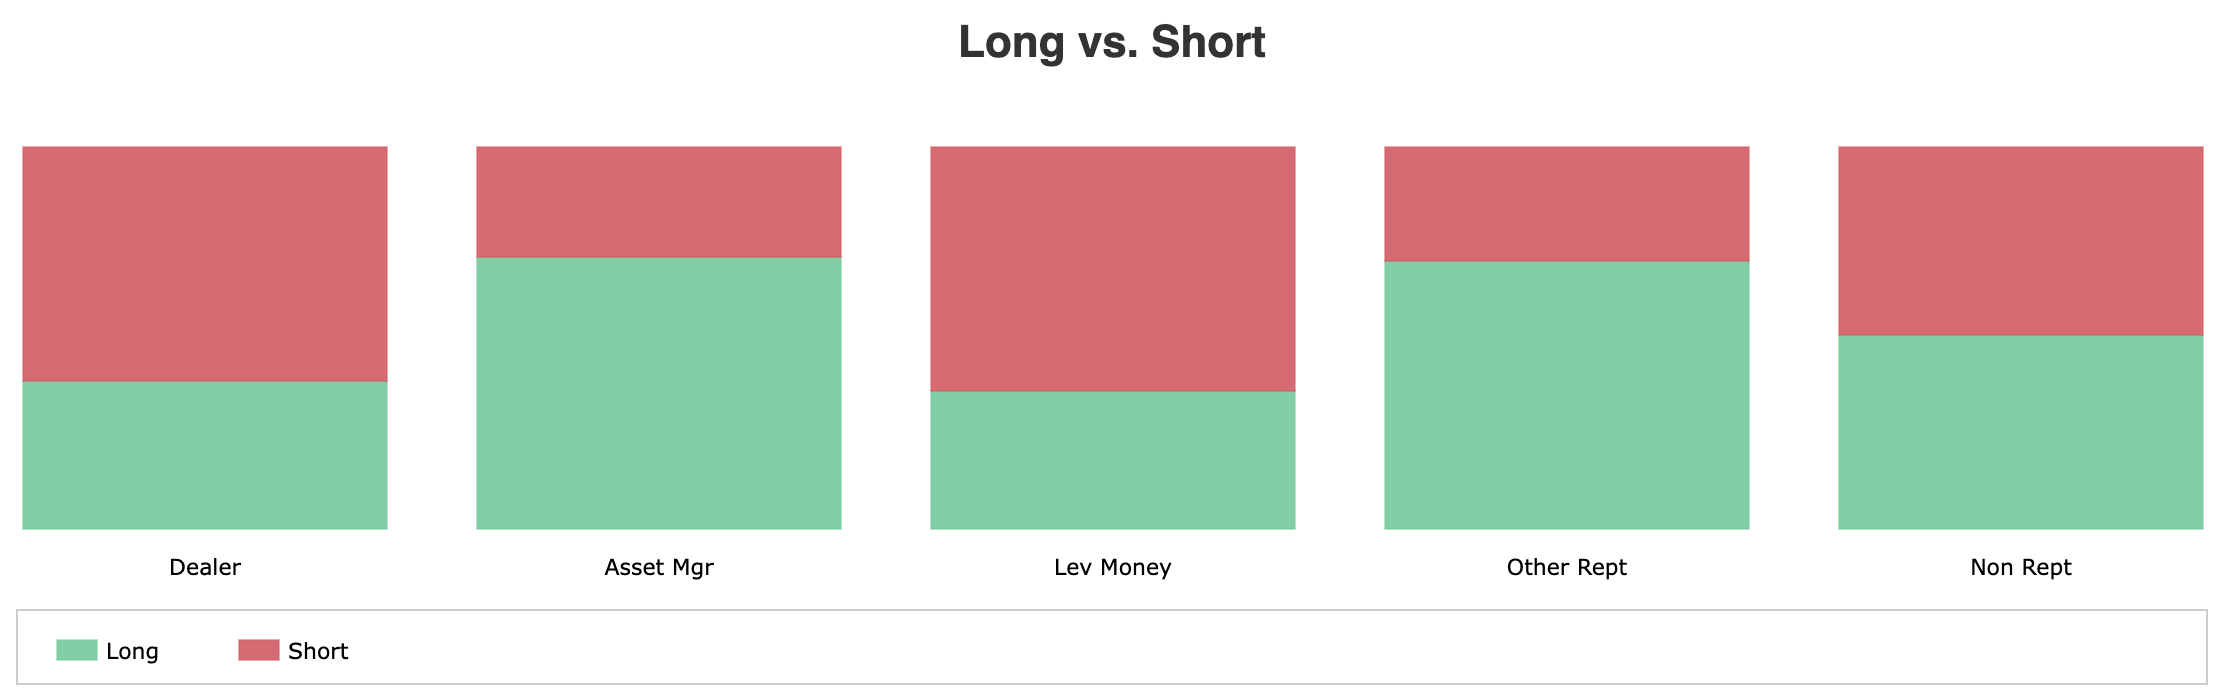
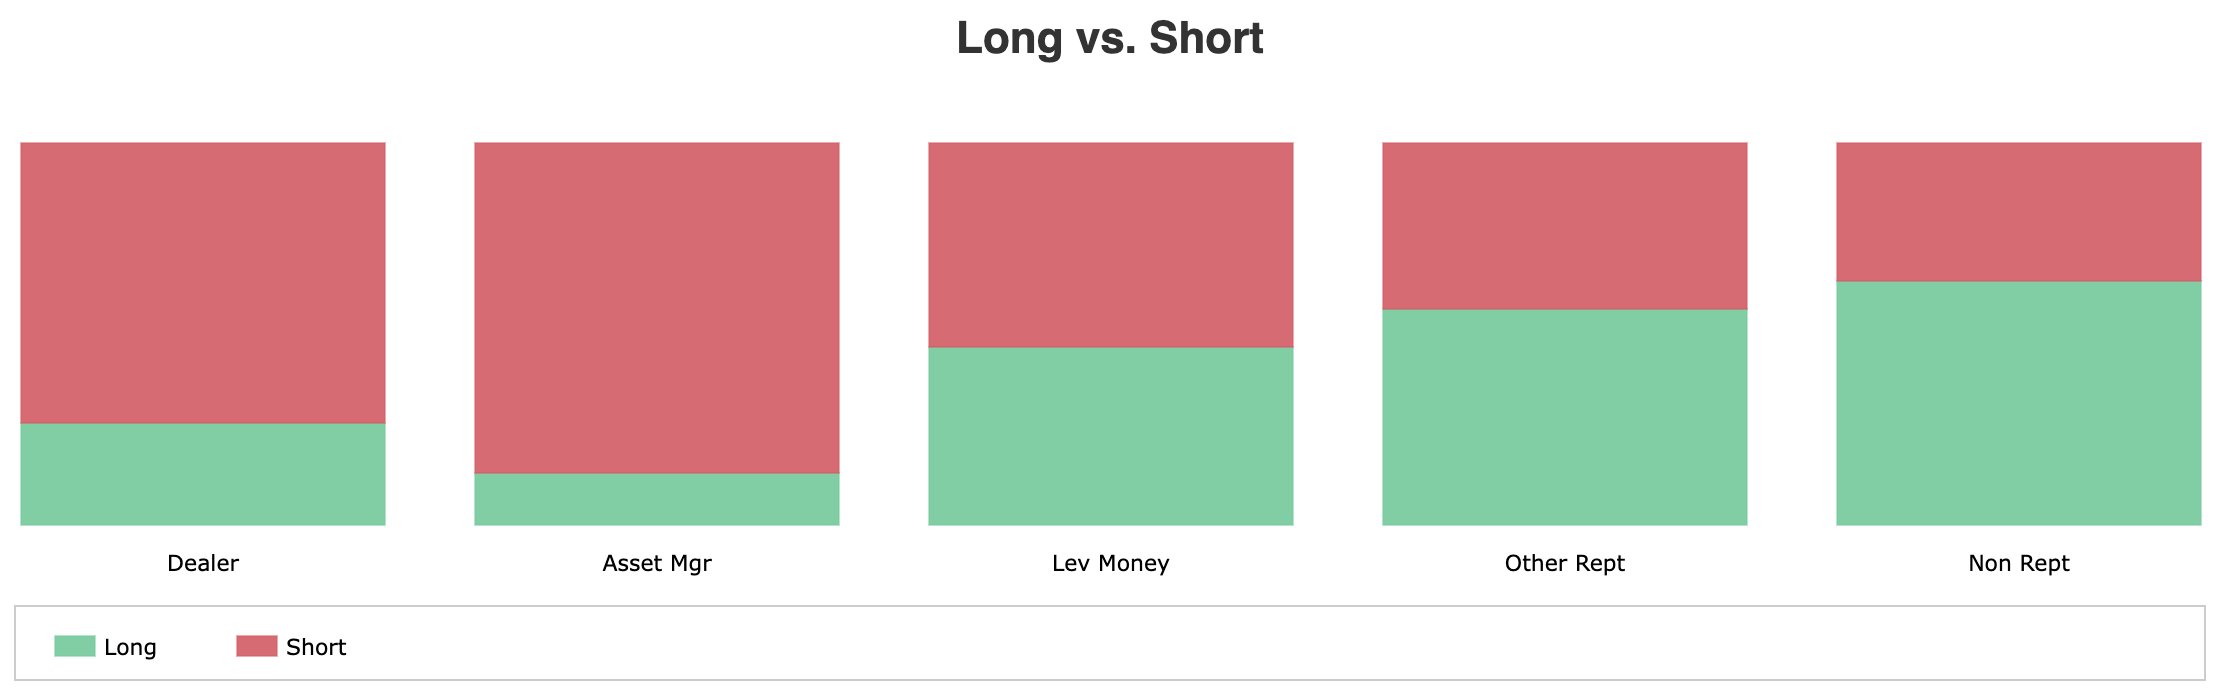
S&P 500 E-mini
Positioning: Dealers -41.6% | Asset Mgrs +46.7% | Leveraged Funds -11.7% | Other Rept +3.1% | Nonrept +3.5%
WoW Change: Dealers +1.3% | Asset Mgrs +2.4% | Leveraged Funds +2.5% | Other Rept +0.7% | Nonrept -0.8%
Open Interest: 1,966,743 (+69,431)
OI expanded by 69,431 contracts this week — a complete reversal from last week's massive 462,409 contraction. New money is re-entering the S&P 500 futures market, which is the first constructive structural signal we have seen in several weeks. The question is who is driving that re-entry and whether it represents genuine conviction.
Leveraged Funds — hedge funds — covered 84,947 shorts while adding 26,321 new longs. This is the most important flow in this week's entire equity COT report. Hedge funds aggressively covering shorts is not the same as going long — but at this scale it removes a significant source of selling pressure that has been weighing on the market. Short covering of nearly 85,000 contracts in a single week is a meaningful positioning reset.
Asset Managers added 34,368 longs while covering 2,931 shorts — the largest institutional long addition among all participant categories. The biggest long-term buyers in the market increased exposure while simultaneously reducing their hedges. That is a genuine bullish signal from the most well-capitalised participant group.
Dealers added 156,860 new shorts — a very large increase — while also adding 8,508 longs. Dealers are typically the counterparty to institutional buying, so this short addition is more likely a hedging response to Asset Manager long accumulation than an outright directional bet. However it is worth monitoring — dealer short positioning at this scale can become a headwind if it persists.
Overall the S&P 500 COT picture improved materially this week. Hedge fund short covering, Asset Manager long addition, and OI expansion together represent the most constructive positioning configuration we have seen in the equity indices in this reporting cycle.
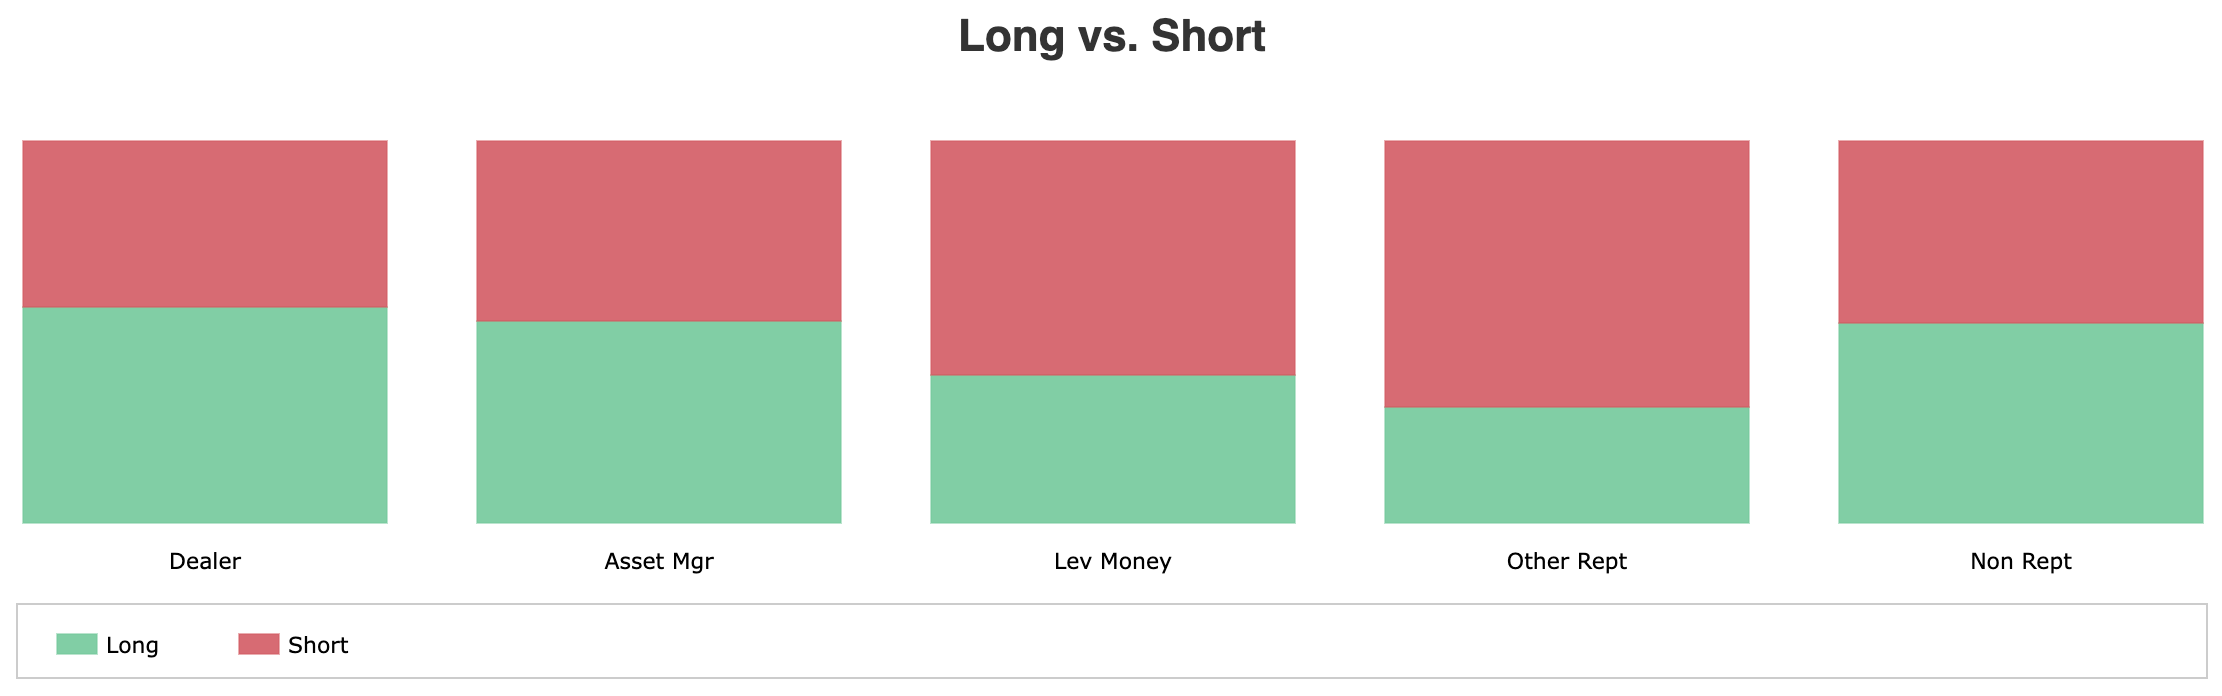
Nasdaq 100 E-mini
Positioning: Dealers -11.3% | Asset Mgrs +23.5% | Leveraged Funds -15.1% | Other Rept +2.4% | Nonrept +0.6%
WoW Change: Dealers +0.8% | Asset Mgrs +3.5% | Leveraged Funds +1.8% | Other Rept +0.9% | Nonrept -0.7%
Open Interest: 245,322 (+9,416)
Nasdaq OI expanded modestly by 9,416 contracts — a small but meaningful reversal from last week's 65,037 contraction. New positioning is being added rather than removed, which is a stabilisation signal even if the magnitude is modest.
Asset Managers added 5,443 longs while covering 1,937 shorts — a two-sided improvement that pushes their net long to +23.5%. After last week's bearish dual move of cutting longs and adding shorts simultaneously, this week's reversal to long accumulation and short covering is a meaningful shift in institutional sentiment toward Nasdaq.
Leveraged Funds covered 1,897 shorts while adding only 379 longs — predominantly short covering rather than fresh long conviction. Their net short of -15.1% remains substantial, meaning there is still significant hedge fund pessimism embedded in Nasdaq positioning. However the direction of change is constructive.
Dealers added 9,631 new shorts against 1,320 new longs — similar to the S&P, this dealer short addition is most likely a hedging response to Asset Manager buying rather than an outright directional short. The pattern across both S&P and Nasdaq is consistent: institutional longs being hedged by dealer shorts.
Nonreportables trimmed 270 longs while adding 2,616 new shorts — retail is still adding bearish bets on the Nasdaq. Retail positioning at sentiment extremes is often a contrarian signal, and retail adding shorts while Asset Managers add longs is a classic setup for a positioning squeeze if price moves higher.
Russell 2000 E-mini
Positioning: Dealers +6.4% | Asset Mgrs +3.9% | Leveraged Funds -9.9% | Other Rept -0.9% | Nonrept +0.6%
WoW Change: Dealers +4.5% | Asset Mgrs -2.1% | Leveraged Funds +3.4% | Other Rept -0.8% | Nonrept +0.1%
Open Interest: 399,456 (-5,077)
Russell OI contracted a further 5,077 contracts — the only index showing continued OI reduction this week while the S&P and Nasdaq both expanded. Small-cap futures participation continues to decline, which is consistent with institutional capital remaining cautious on the most economically sensitive area of the market.
Leveraged Funds covered 27,312 shorts while liquidating 17,422 longs — significant short covering that improves their net position to -9.9%, but the simultaneous long liquidation tells you this is pure position reduction rather than a bullish repositioning. Hedge funds are getting smaller in Russell 2000 exposure in both directions.
Asset Managers added 12,726 new shorts while cutting 4,562 longs — a bearish two-sided move that is the exact opposite of what they did in the S&P and Nasdaq this week. This divergence is critical: institutional money is selectively recovering large-cap exposure while continuing to hedge or exit small-cap exposure. That tells you the recovery conviction, if it exists, is concentrated at the large-cap end of the market.
Dealers added 15,895 longs against 5,884 new shorts — a net long addition that is the most constructive dealer flow of any index this week. Dealer long accumulation in small caps while Asset Managers add shorts creates an interesting tension that will resolve based on whether macro conditions improve enough to attract institutional small-cap demand.
The divergence between Russell and the other two indices is the most important cross-asset signal in this week's equity COT report — large-cap recovery positioning is underway, small-cap recovery positioning is not.
Gold
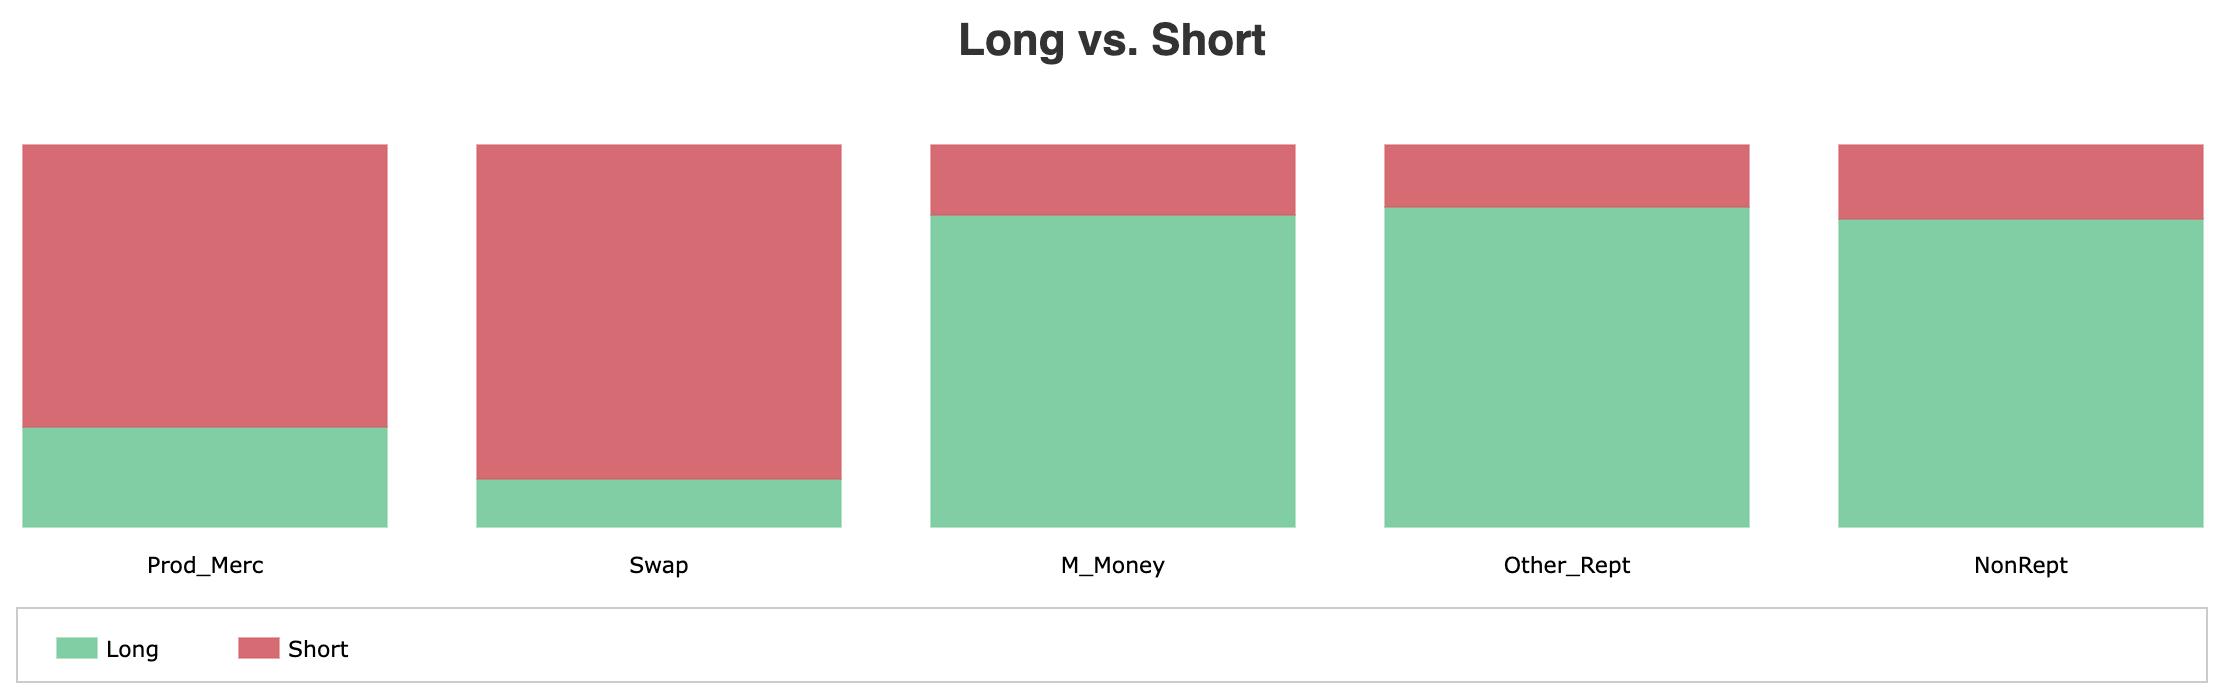
Positioning: Producers -5.5% | Swap Dealers -50.2% | Managed Money +25.7% | Other Rept +19.5% | Nonrept +10.6%
WoW Change: Producers -0.3% | Swap Dealers -1.7% | Managed Money +3.0% | Other Rept -4.7% | Nonrept +0.6%
Open Interest: 361,409 (-42,516)
OI contracted sharply by 42,516 contracts — one of the largest single-week reductions in gold futures participation. When this many positions are closed simultaneously, it typically signals forced liquidation rather than voluntary repositioning. The most likely explanation is institutional margin calls elsewhere in the portfolio driving gold selling to raise cash — a dynamic that has been visible across precious metals for several weeks now.
Other Reportables — the slower-moving institutional money like pension funds — liquidated 13,789 longs while covering 7,471 shorts and unwinding 3,792 spread positions. This is broad-based exit across all position types, the largest gross reduction of any participant group this week. When pension-type money exits gold at this pace, it is almost always liquidity-driven rather than a change in gold's fundamental outlook.
Managed Money — the systematic hedge funds that have been gold's primary bull — added only 530 longs while covering 663 shorts and collapsing spread positions by 8,509. The near-flat directional change combined with massive spread liquidation tells you hedge funds are restructuring their gold book rather than making a fresh directional bet. Spread positions are often used to manage roll risk; unwinding them at this scale suggests a significant reduction in overall gold exposure.
Swap Dealers covered 5,750 shorts while also cutting 5,868 longs — both sides reducing simultaneously, consistent with the broad deleveraging theme. Their dominant 58.6% short position remains structurally intact despite the cover.
The key takeaway: gold's OI collapse is a liquidity event, not a trend reversal signal. Managed Money's net long at +25.7% remains constructive, but until forced selling pressure abates and OI stabilises, gold faces headwinds regardless of the fundamental case.
Oil
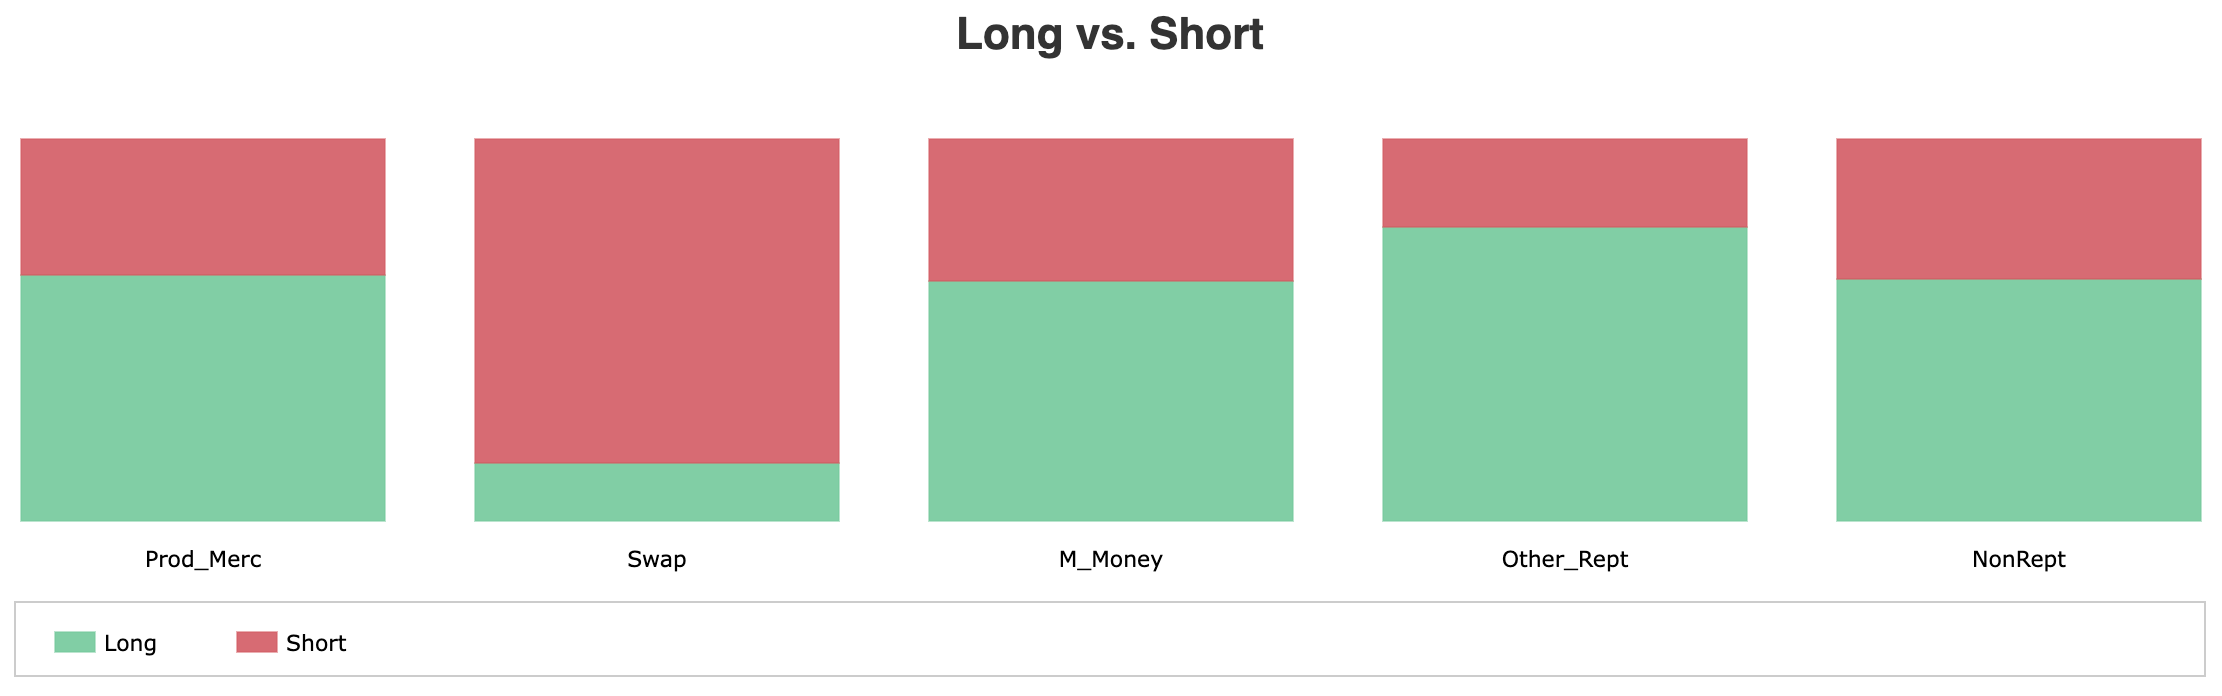
Positioning: Producers +14.2% | Swap Dealers -26.2% | Managed Money +3.7% | Other Rept +6.9% | Nonrept +1.5%
WoW Change: Producers +1.7% | Swap Dealers +0.1% | Managed Money -0.5% | Other Rept +0.8% | Nonrept -0.3%
Open Interest: 2,030,970 (+28,905)
Crude OI expanded by 28,905 contracts — a meaningful reversal from last week's 79,511 contraction. New money is returning to crude oil futures, and crucially the composition of that return is constructive. This is the first week in several where OI expansion rather than liquidation is the headline story in crude.
Producers and merchants — the physical oil companies who hedge their actual production — added 17,836 longs while covering 2,604 shorts. When the people who actually produce oil increase their long hedges, it means they are locking in prices because they believe current levels are attractive. This is one of the most credible bullish signals available in commodity markets because it reflects real-world commercial conviction rather than speculative positioning.
Other Reportables added 5,296 longs and 4,439 shorts while expanding spread positions by 16,569 — the spread expansion is large but the gross long addition alongside it suggests this group is building bullish structures rather than simply hedging.
Managed Money trimmed 3,359 longs while adding 17,630 new shorts and unwinding 18,455 spread positions. Hedge funds adding shorts while producers add longs creates a direct institutional divergence — the smart money in physical markets is bullish while speculative money is turning more cautious. Historically producer conviction has been the more reliable signal in crude.
Swap Dealers added both longs and shorts modestly — essentially neutral with a slight short lean. Their 31.9% net short remains the structural ceiling for crude prices.
Bottom line: producer long accumulation on expanding OI is the most credible bullish signal in crude this week. With oil prices still pushing higher driven by Middle East escalation, the futures market structure is beginning to align with the price trend.
Bitcoin Futures
Positioning: Dealers -9.6% | Asset Mgrs -6.0% | Leveraged Funds -3.8% | Other Rept +6.3% | Nonrept +13.0%
WoW Change: Dealers -2.6% | Asset Mgrs -0.4% | Leveraged Funds -6.4% | Other Rept -1.4% | Nonrept -2.0%
Open Interest: 17,446 (-7,530)
Bitcoin OI collapsed 7,530 contracts — a massive 30% reduction in total open interest in a single week. To put that in context, nearly a third of all active Bitcoin futures positions were closed simultaneously. This is not normal repositioning — it is a significant deleveraging event that signals broad-based loss of conviction across all participant categories.
Leveraged Funds liquidated 2,190 longs while covering 4,792 shorts and unwinding 1,542 spread positions — the largest gross position reduction of any participant group. Last week they were adding longs; this week they reversed course entirely. The speed of that reversal — from accumulation to liquidation in one week — reflects how quickly sentiment has deteriorated in crypto relative to the brief stabilisation signal from the prior report.
Dealers liquidated 1,417 longs while covering 380 shorts — both sides reducing, consistent with the broad deleveraging theme. With zero spread positions, dealers have minimal structural presence in bitcoin futures right now.
Nonreportables — retail — liquidated 1,197 longs while adding 529 new shorts. Retail simultaneously exiting longs and adding shorts is typically a late-cycle bearish signal rather than a leading one, but the scale of long liquidation alongside Leveraged Fund exits amplifies the near-term bearish read.
Other Reportables remain the only group with a meaningful net long at +6.3%, but they also liquidated 942 longs and 1,152 shorts this week — reducing exposure rather than adding conviction.
With Dealers, Asset Managers, and Leveraged Funds all net short simultaneously and OI at its lowest level in this reporting cycle, Bitcoin's positioning structure offers no natural support base. The 30% OI collapse in a single week is the most alarming data point in this week's entire COT report.
Did you find value in today's publication?This helps us better design our content for our readers |
Reply