- Swingly
- Posts
- Growth Stocks Explode Higher
Growth Stocks Explode Higher
In partnership with

OVERVIEW
What You Need To Know
Inflation cools: September CPI came in below expectations, lifting rate-cut hopes and sparking a premarket rally, led by tech.
Market tone improving: Yields slipped, the dollar softened, and equities are gaining momentum as traders price in easier policy ahead.
Nasdaq (QQQ & QQQE): Both invalidated prior double-top patterns and held their 10-day MAs — QQQE is even outperforming, showing improving breadth.
Midcaps (MDY): Strong rebound off 10/20-day EMA cluster and breakout above $597 POC — impressive action but gap-up favors pullback entries, not chases.
Small caps (IWM): Bounced sharply from $243 POC but on light volume; price flipped short-term bullish, yet open gaps may trap eager buyers.
Focused Stock (APP): Perfect pullback to 10-week and 50-day EMA, now breaking above $600 POC; remains a top market leader, but avoid chasing the early gap.
Focused Group (XLK & RSPT): Tech complex rebounding strongly post-CPI, invalidating head-and-shoulders setups — synchronized leadership between mega-cap and equal-weight tech confirms broad institutional support.

MARKET ANALYSIS
The Bulls Are Making A Major Comeback

Inflation cools slightly: The September CPI report came in softer than expected, with headline inflation rising 0.3% MoM (vs 0.4% forecast) and 3% YoY (vs 3.1% expected). Core CPI, which strips out food and energy, also eased to 0.2% MoM and 3% YoY, both below forecasts. The data suggests inflation pressures are continuing to moderate, reinforcing expectations for further Fed rate cuts this year.
Market reaction: Equities ticked higher following the release as traders priced in a greater likelihood of easing at the Fed’s upcoming meeting. Treasury yields slipped, while the dollar softened modestly on the dovish signal.
Earnings moves: Tesla missed earnings expectations and gapped lower at the open, but buyers quickly stepped in, pushing shares back toward breakeven — a sign of resilience in high-beta tech. Intel rallied on strong Q3 results, and Procter & Gamble gained after topping revenue and profit estimates.
Tone: With inflation cooling, rate-cut hopes rising, and earnings generally beating expectations, market sentiment is cautiously improving heading into the final week of October.
Nasdaq

QQQ VRVP Daily Chart
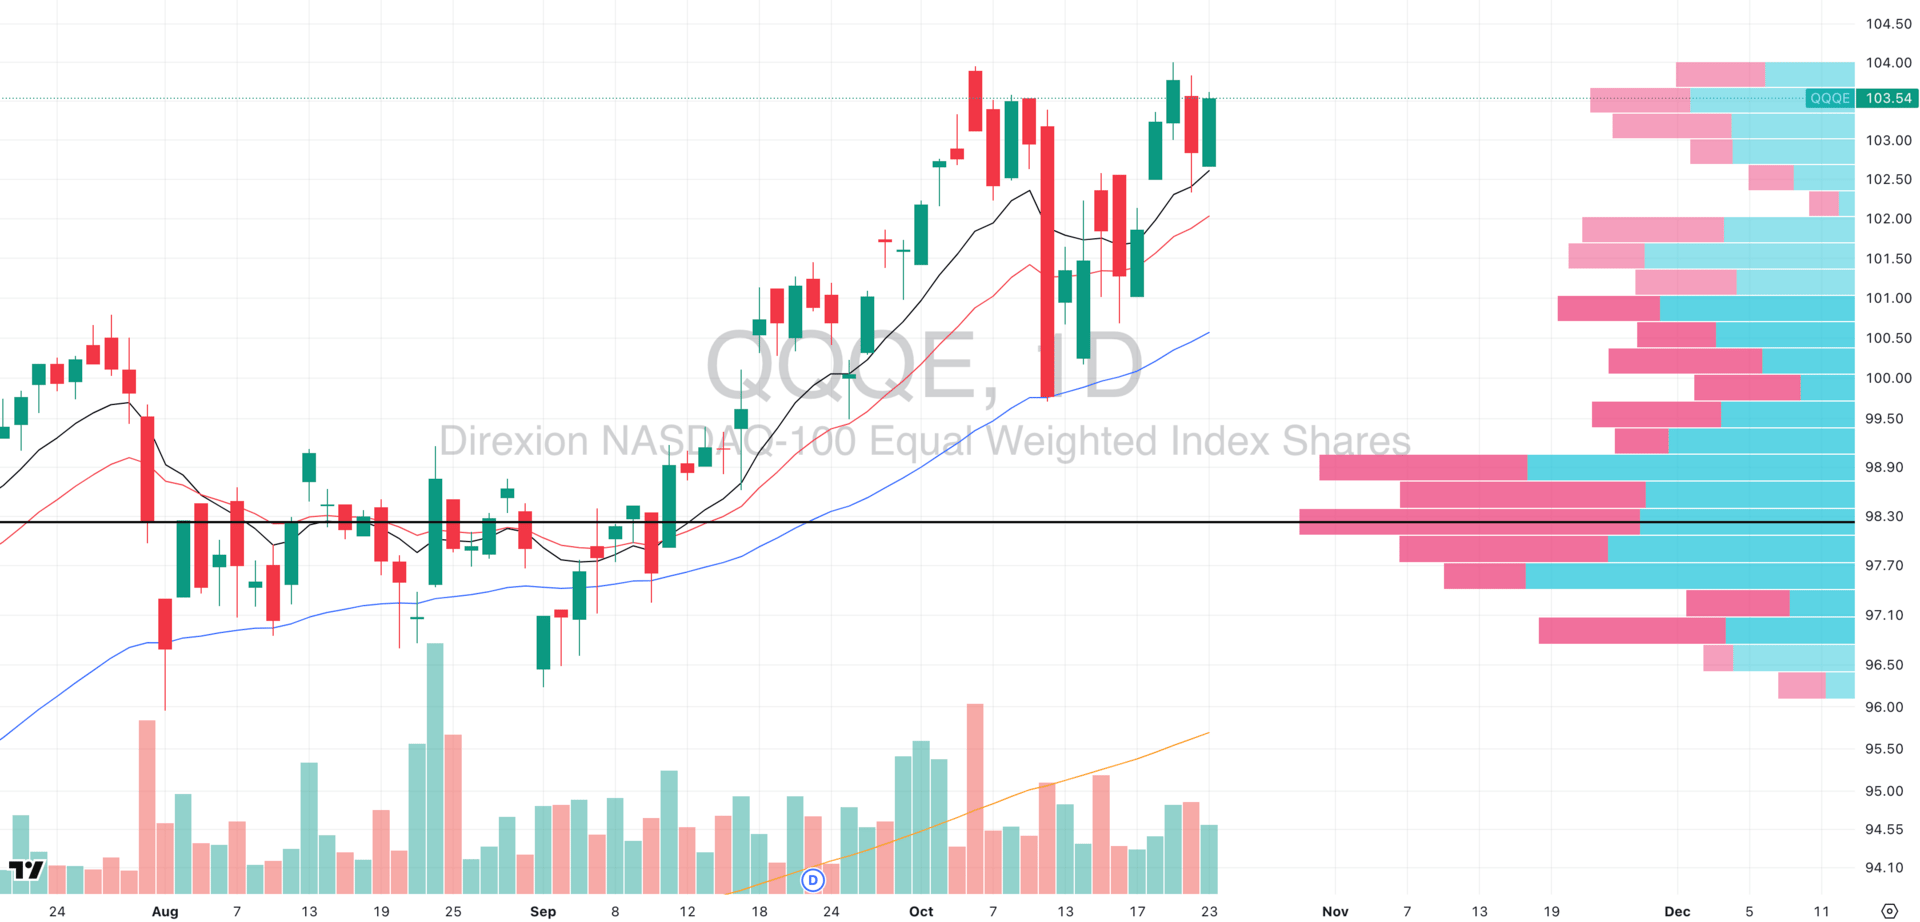
QQQE VRVP Daily Chart
% over 20 EMA: 65.34% | % over 50 EMA: 60.39% | % over 200 EMA: 63.36%
Both QQQ (cap-weighted) and QQQE (equal-weighted) moved in perfect tandem yesterday, with QQQE actually outperforming in the last few session which is a very healthy sign of improving breadth.
The “Eve & Eve” double-top pattern that had formed earlier in October now appears invalidated, as both ETFs held firmly above their rising 10-day MAs and rebounded decisively.
Volume remains moderate but supportive, confirming that buyers defended key trend levels despite earlier weakness- today will be the test to see if this is a bull trap on this rally, or not.
We must emphasise that all of the big tech complex (with NVDA being the exception) are posting earnings next week which doesn’t mean long exposure is a bad idea here, but it’s important to keep in mind they will dictate direction.
S&P 400 Midcap
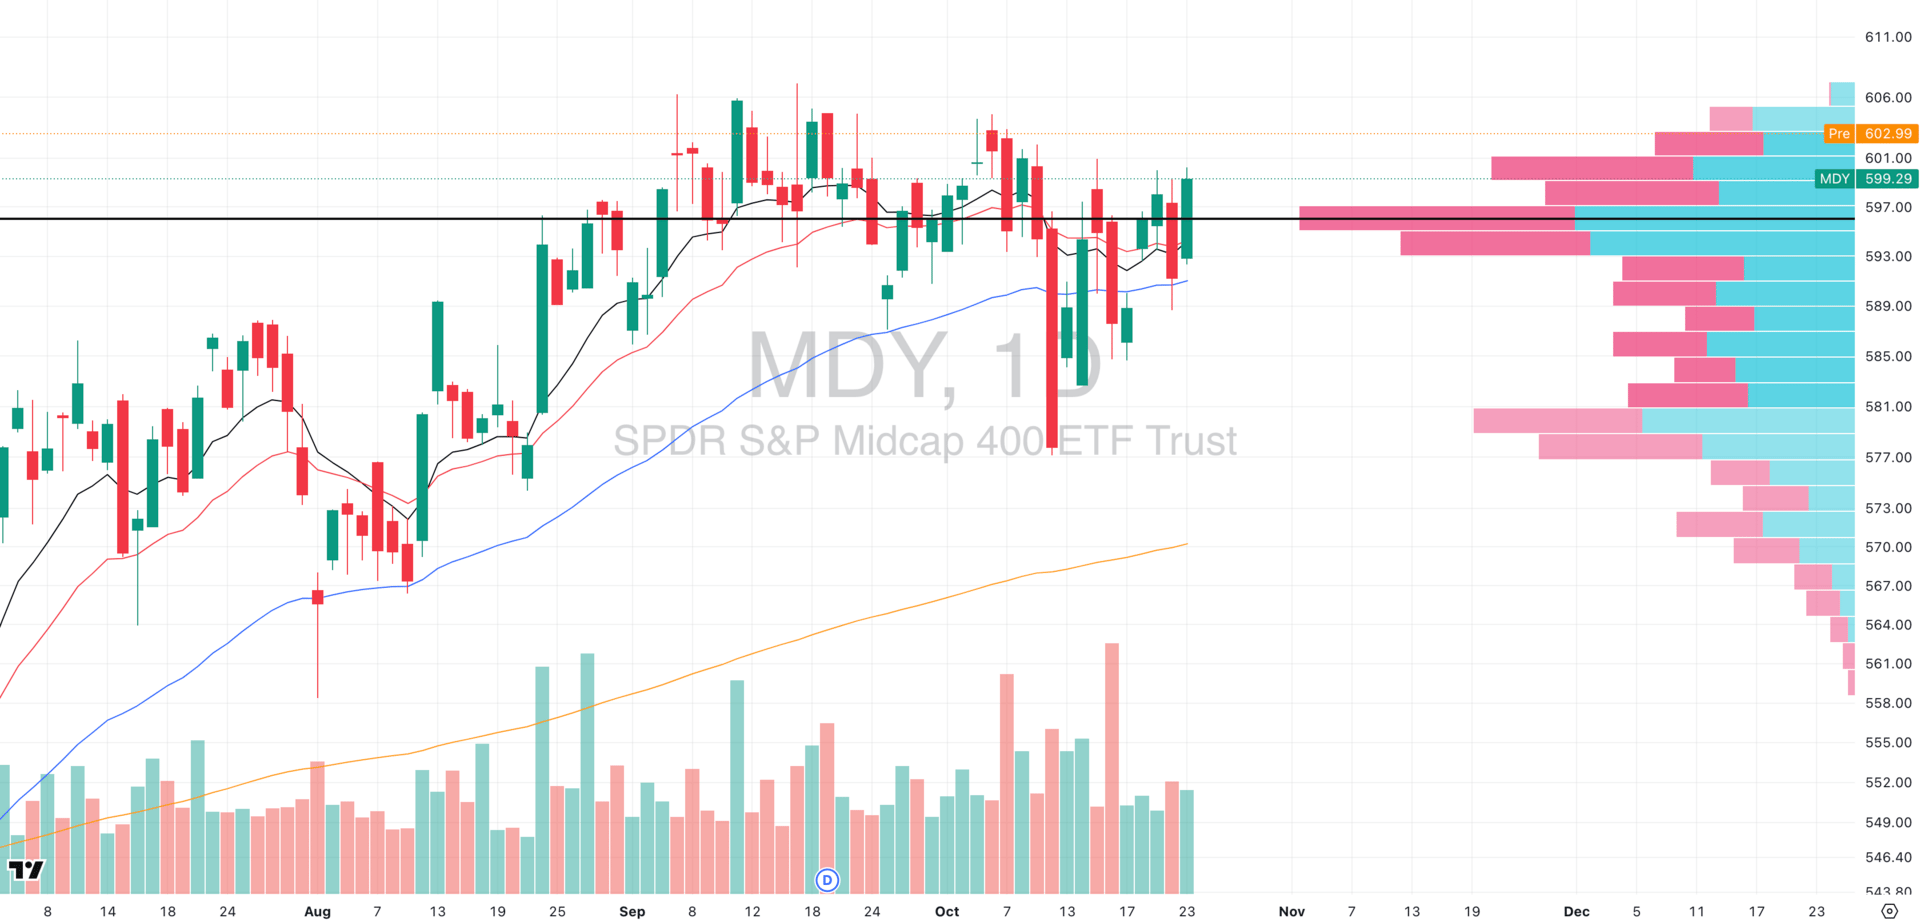
MDY VRVP Daily Chart
% over 20 EMA: 54.36% | % over 50 EMA: 45.88% | % over 200 EMA: 57.85%
MDY had an impressive session yesterday, bouncing cleanly off its 10- and 20-day EMA cluster and reclaiming its Point of Control (~$597).
In premarket, it’s now gapping above the densest part of its distribution zone that’s been forming since early September, signaling a strong shift in demand.
That said, we’re really urging discipline over euphoria as today’s gap-up favors pullback traders who entered stocks on weakness (more on this in the focused stock section), not breakout chasers.
Let the first 15–30 minutes establish direction before acting; volume confirmation is the key.
Russell 2000
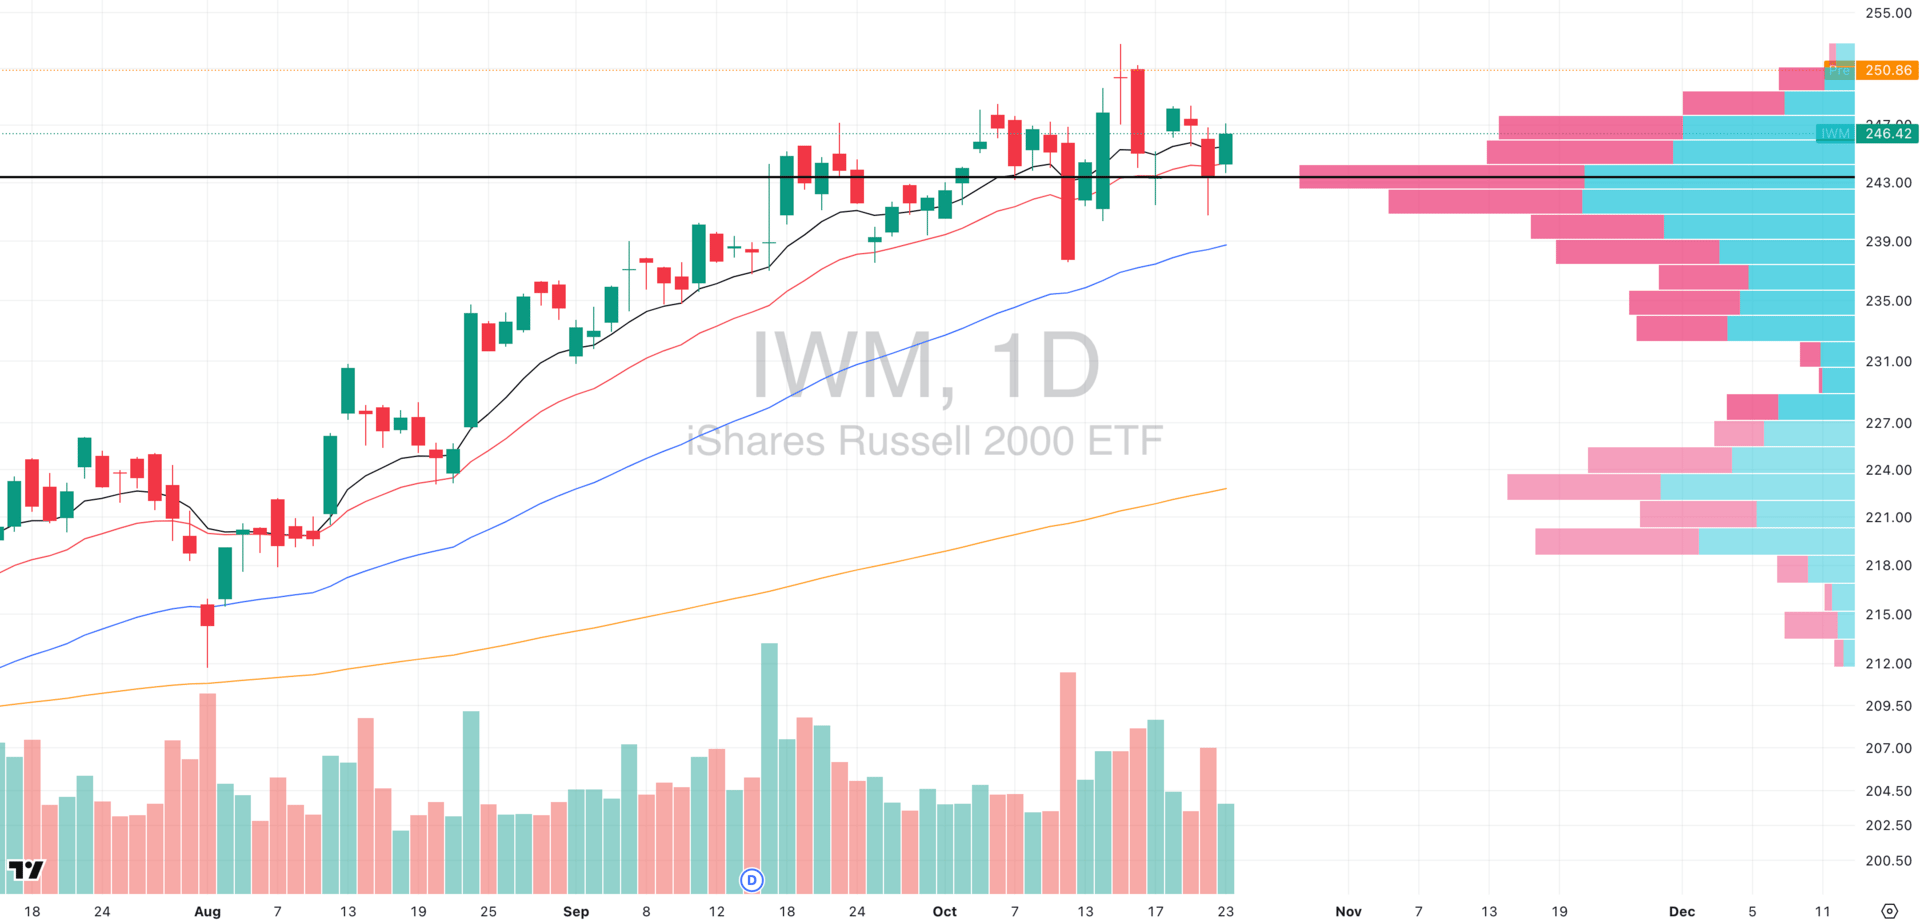
IWM VRVP Daily Chart
% over 20 EMA: 53.37% | % over 50 EMA: 48.46% | % over 200 EMA: 58.78%
IWM is gapping up this morning after an impressive reversal off its Point of Control (~$243), matching the strength seen across the broader market.
Yesterday’s bounce came on low relative volume, suggesting participation was thin despite the clean reclaim of short-term EMAs.
Structurally, both price and trend have flipped short-term bullish, confirming that buyers are defending key demand zones.
However, the risk of a bull trap is high at the open and so chasing the gap-up without confirmation can easily lead to whipsaws in this environment.
As with MDY, patience is key; let the opening range settle before considering any exposure.
The Real Traders Aren't on CNBC

Your current options for finding stock trades:
Option 1: Spend 4 hours daily reading everything online
Option 2: Pay $500/month for paywalled newsletters and pray
Option 3: Get yesterday's news from mainstream financial media
All three keep you broke.
Here's where the actual edge lives:
Twitter traders sharing real setups (not TV personalities)
Crowdfunding opportunities before they go mainstream
IPO alerts with actual timing
Reddit communities spotting trends early
Crypto insider takes (not corporate PR)
The problem? You'd need to be terminally online to track it all.
Stocks & Income monitors every corner where real money gets made. We send you only the actionable opportunities. No fluff, no yesterday's headlines.
Five minutes daily. Walk away with stock insights you can actually act on every time.
Stocks & Income is for informational purposes only and is not intended to be used as investment advice. Do your own research.
FOCUSED STOCK
APP: A Perfect Pullback
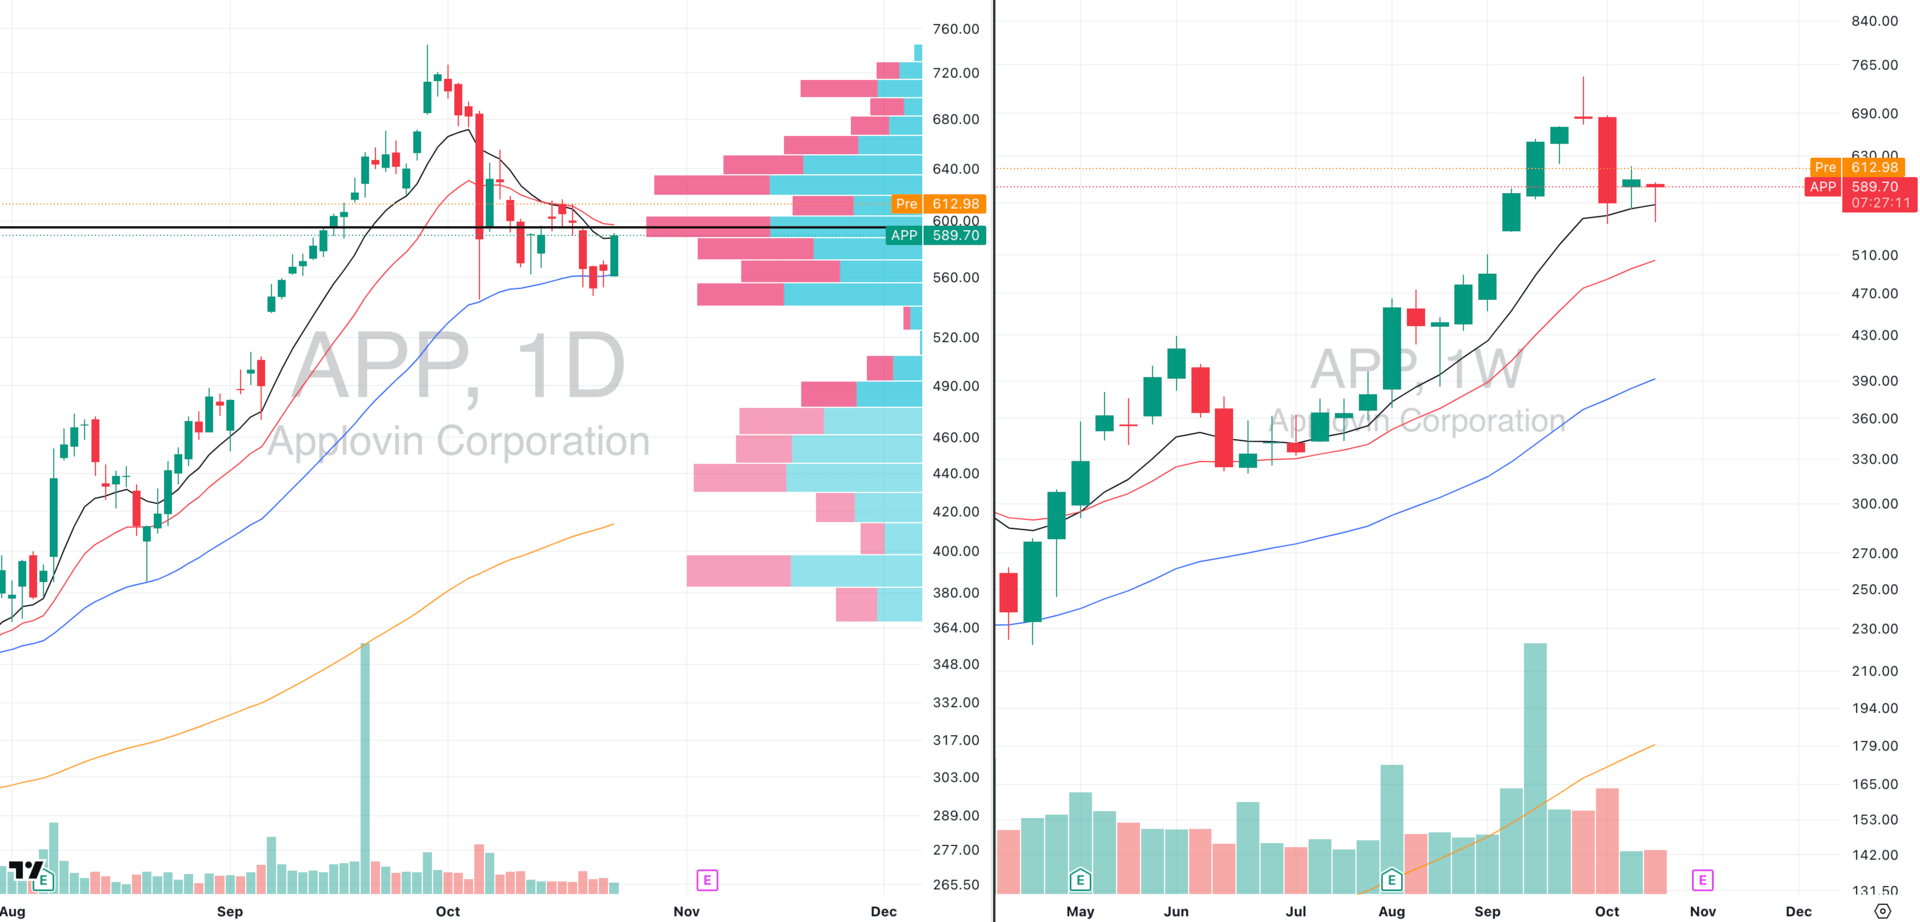
APP VRVP Daily & Weekly Chart
ADR%: 6.16% | Off 52-week high: -20.9% | Above 52-week low: 298.4%
APP just executed a very impressive pullback by retracing cleanly to its 10-week EMA and 50-day EMA, where buyers stepped in aggressively with a wide expansion candle yesterday.
This is a great example of how to buy on weakness as you always want to take the chance going long on a major intermediary trend support test (this case it was the 10 week EMA).
In premarket, euphoria is pushing it above its Point of Control (~$600), signaling a potential breakout through a major supply zone.
While this setup confirms trend integrity and obvious demand, avoid chasing the gap-up as this early strength can often fade as profit-takers step in during the first 15–30 minutes of trade.
On the weekly chart, APP remains one of the strongest stocks in the entire market, up nearly 300% over the past 52 weeks, making it a clear leadership name in the current cycle.
FOCUSED GROUP
XLK: The Tech Trade Is back
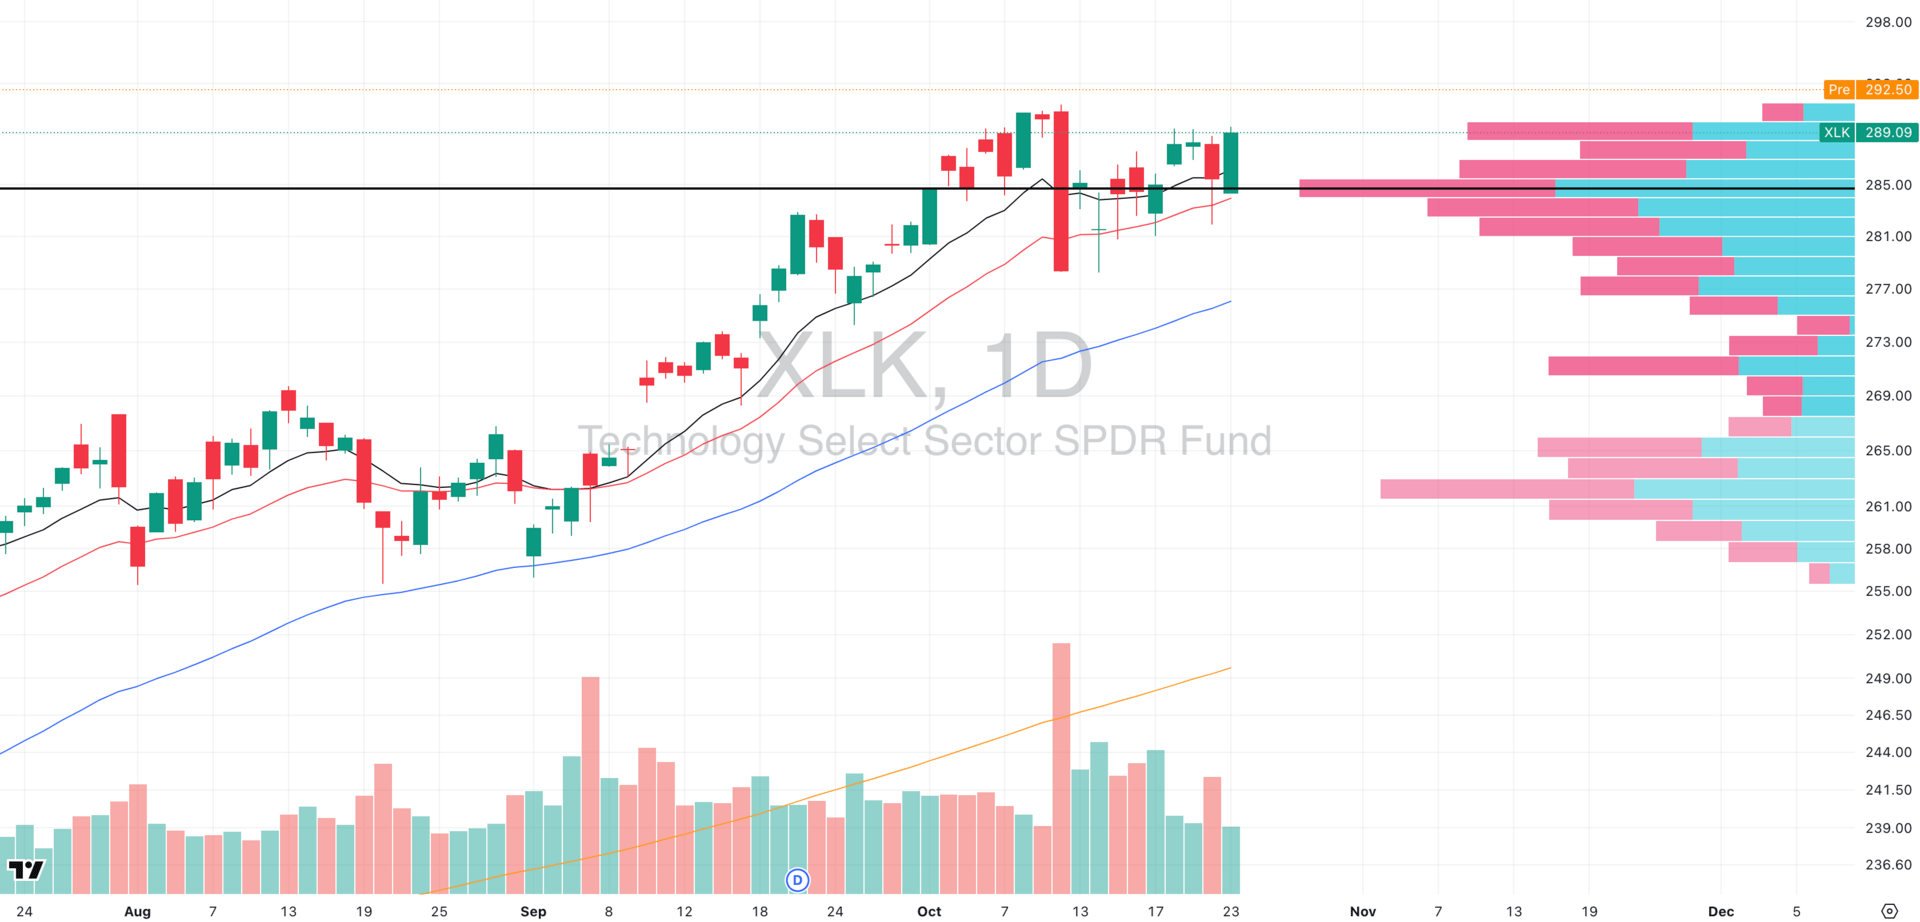
XLK VRVP Daily Chart
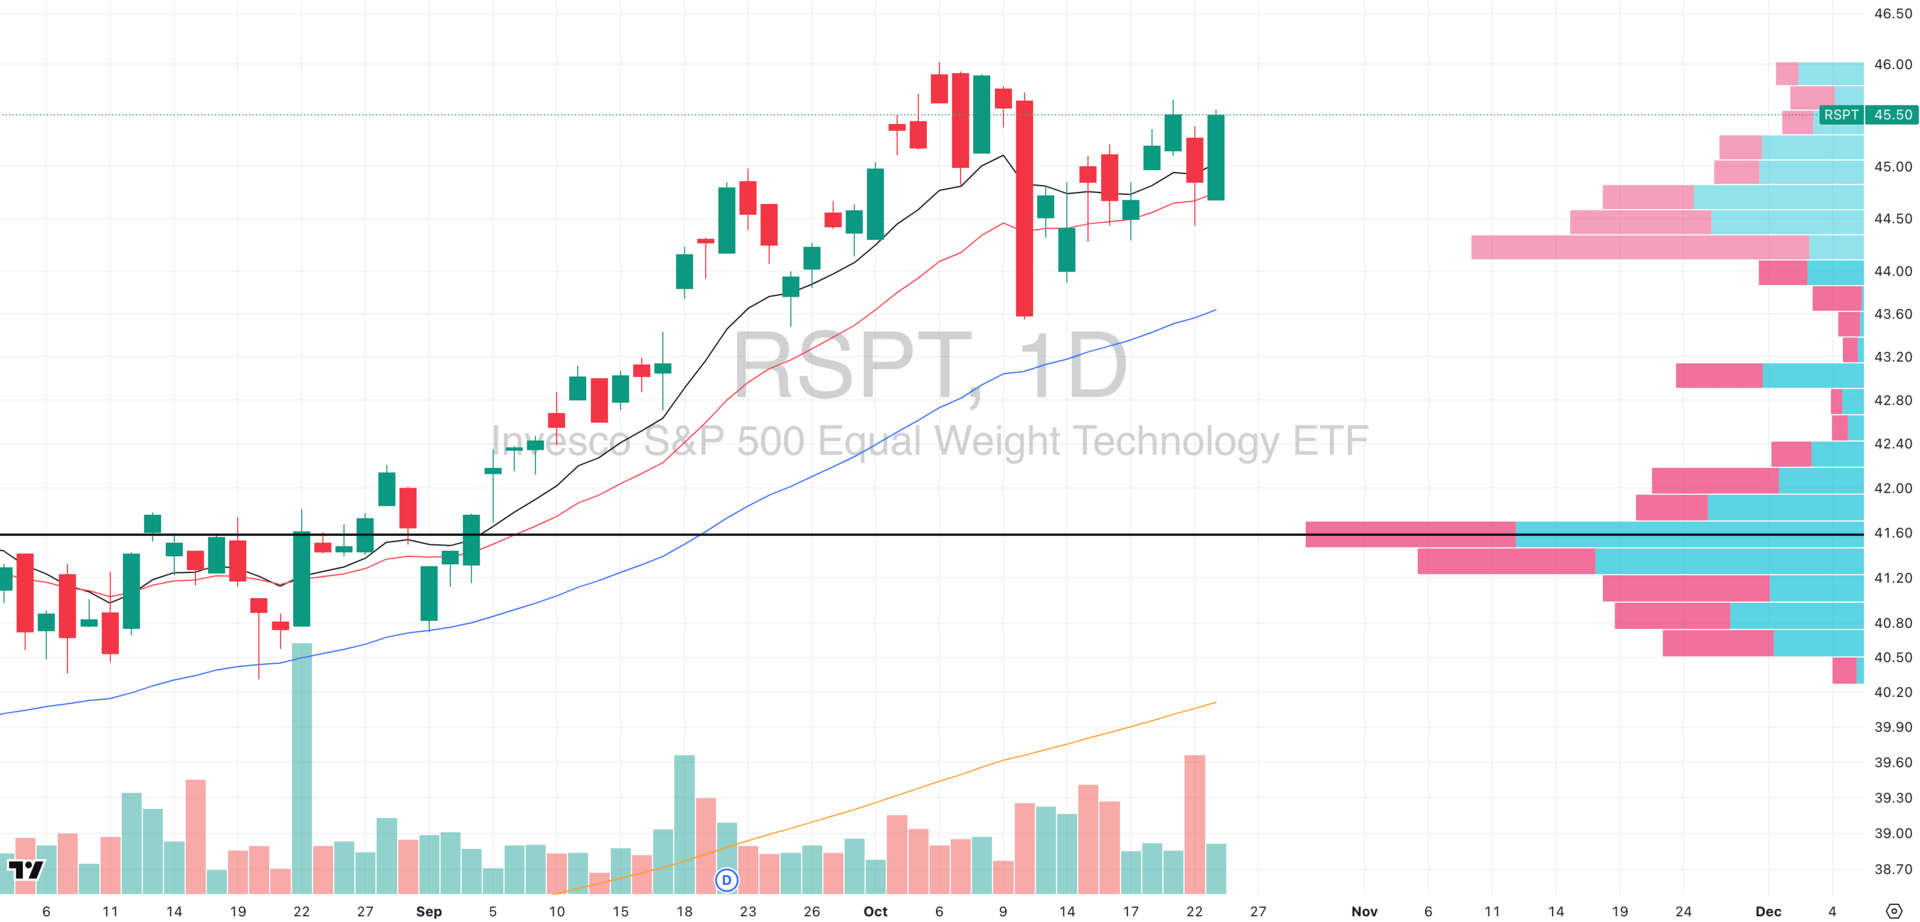
RSPT VRVP Daily Chart
Both the cap-weighted XLK and equal-weighted RSPT bounced sharply in tandem, showing synchronized strength across the entire technology complex.
This morning’s inflation data triggered a strong premarket rally, with tech leading the charge and this is all confirming that growth sectors remain the main beneficiary of easing rate pressure sentiment.
XLK found strong demand right at its Point of Control (~$285) and rebounded cleanly, while RSPT followed through decisively, both reclaiming short-term EMAs.
The head-and-shoulders formation on both charts has now been invalidated, signaling renewed structural strength rather than breakdown risk.
With both mega-cap and equal-weighted tech advancing together, this rebound reflects broad institutional support which is a very strong shift that should solidify leadership assuming earnings from the big tech complex next week confirms the trend.

Did you find value in today's publication?This helps us better design our content for our readers |
Reply