- Swingly
- Posts
- Growth Is Wobbling — Watch These Levels Closely
Growth Is Wobbling — Watch These Levels Closely
In partnership with
OVERVIEW
Rotation Is Real. Risk Management First.
🟥 Risk-Off: After weeks of strong risk-on behavior, we're seeing the first signs of real pressure in high-growth names — especially large-cap tech. The QQQ is flashing divergence warnings with declining volume on a rising price structure, and Friday’s early selloff confirms rotation is underway.
Oil and gold are catching bids. Equities were extended — and now, the tape is doing what it should: reset.
🔄 Sector Rotation: The pullback isn't broad-based panic — it's rotation. Energy (XLE, XOP), commodities, and defensive areas like gold (GDX, GLD) are all attracting money.
Growth-focused indices like QQQ and IWM are testing key short-term support levels like the 10-EMA and Point of Control. Midcaps are holding up better, but upside is capped for now. This is healthy, even if uncomfortable.
📌 What to Do Now: Don’t overreact to headlines. Focus on the reaction, not the event. If you're holding extended growth exposure, now is a good time to trim into strength or reduce risk if the market can't bounce off support.

MARKET ANALYSIS
Will The War Cause A Sell-Off?

Markets opened lower Friday after Israel launched a wave of airstrikes on Iran, pushing energy prices sharply higher. Israel’s defense minister declared a state of emergency following the strikes, while U.S. officials confirmed there was no U.S. involvement. The directional reactions are textbook: oil spiked, gold caught a bid, and equities dropped.
But despite the headlines, the mood in financial markets remains surprisingly composed. The geopolitical risk premium is real — but it’s important to note a few things: Iran’s military response capability is limited, and OPEC’s recent production hikes are helping to stabilize energy markets for now. So far, this doesn’t look like the start of a major escalation.
From a trading standpoint, the pullback makes sense. Many indices and leading stocks were extended after a strong multi-week run, and this may very well prove to be the catalyst the market needed to reset — especially in stretched growth names — before another leg higher.
📌 One Final Note:
At Swingly, our focus is price, volume, and the equity markets. We're not here to speculate on politics or international relations — we leave that to the pundits. Our job is to give you actionable insights and context on how market-moving events affect your positioning, risk, and trade execution. Let’s stay focused on what we can control.
Nasdaq
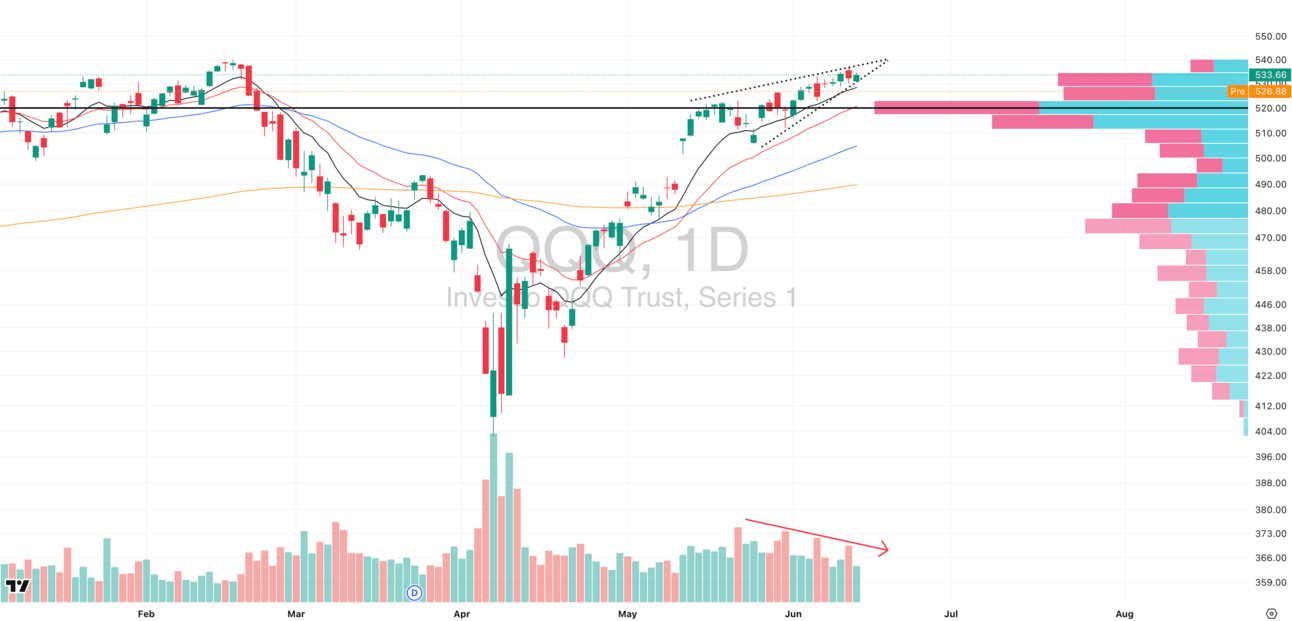
QQQ VRVP Daily Chart
The tech-heavy QQQ is starting to show signs of short-term exhaustion. While price has steadily pushed higher, we’ve seen a clear and persistent decline in relative volume over the past two weeks — a textbook red flag in momentum markets. This divergence signals fading participation and often precedes a trend change.
Adding to the concern is the structure of the current setup: we’ve formed a rising wedge / ascending flag — typically an exhaustion pattern — right into prior resistance with very little conviction. Leadership has also narrowed. Many extended large and megacap names are stalling or fading, while new breakouts in the space are struggling to follow through.
We remain comfortably above the rising 20-day EMA and the Point of Control (POC) near $520, which is the immediate level to watch. That zone is loaded with prior demand — but should it fail, the Visible Range Volume Profile (VRVP) shows a sharp drop in volume below, suggesting the potential for a fast move lower.
S&P 400 Midcap
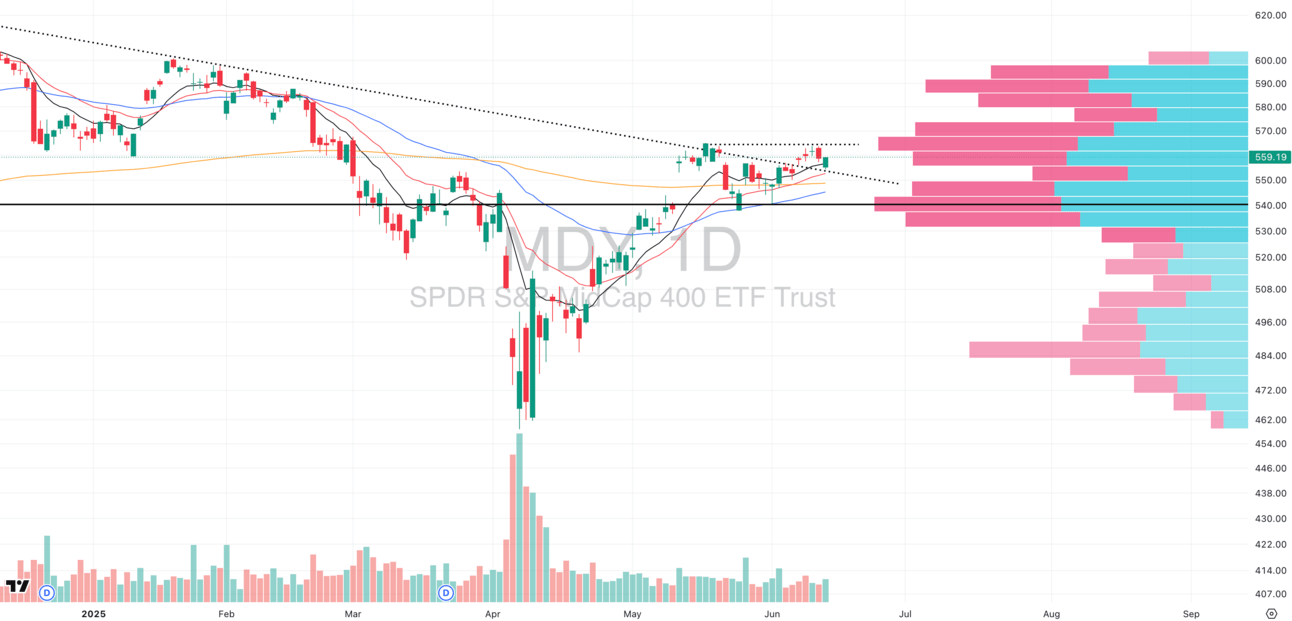
MDY VRVP Daily Chart
Midcaps (MDY) showed a solid response yesterday — bouncing cleanly off the rising 10-day EMA and reclaiming short-term momentum. Despite broader market volatility tied to geopolitical concerns, the MDY reaction has been impressively muted, signaling underlying strength.
Importantly, midcaps continue to hold above their breakout zone, turning former resistance into support — a key structural shift.
However, the Visible Range Volume Profile (VRVP) reveals a low-volume pocket below current prices down to ~$550, which aligns with the daily 200-day EMA. If midcaps fail to gain traction intraday, this could act as a natural magnet for price.
Russell 2000
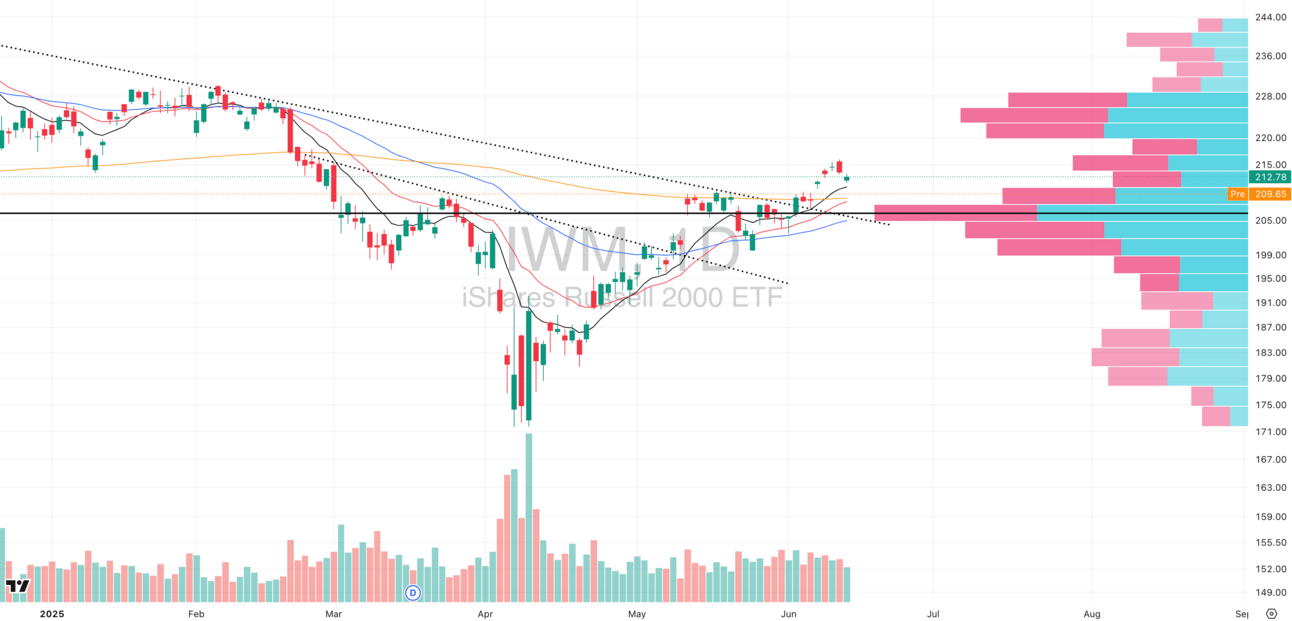
IWM VRVP Daily Chart
Small caps (IWM) have continued to drift higher over the last few sessions — but critically, on steadily declining relative volume. Yesterday marked the first breakdown below the rising 10-day EMA since IWM cleared its 7-month downtrend and validated the large inverse head and shoulders pattern we’ve been tracking for weeks.
As much as this short-term weakness could feel bearish, we want to emphasize one thing: there is a massive amount of layered support just below current levels.
The Point of Control (POC) sits near $205.50 — the highest volume area in the current range.
The rising 20-day and 50-day EMAs are stacked below.
And the declining 200-day EMA, once resistance, is now potentially acting as a floor.
📌 What to Watch:
We are watching for a retest of the breakout level — a common and healthy behavior after large upside moves. But we won’t try to predict the bounce. As momentum traders, we wait for strength to return before stepping in.
Smarter Investing Starts with Smarter News

Cut through the hype and get the market insights that matter. The Daily Upside delivers clear, actionable financial analysis trusted by over 1 million investors—free, every morning. Whether you’re buying your first ETF or managing a diversified portfolio, this is the edge your inbox has been missing.
FOCUSED STOCK
YPF: YPF Sociedad Anonima
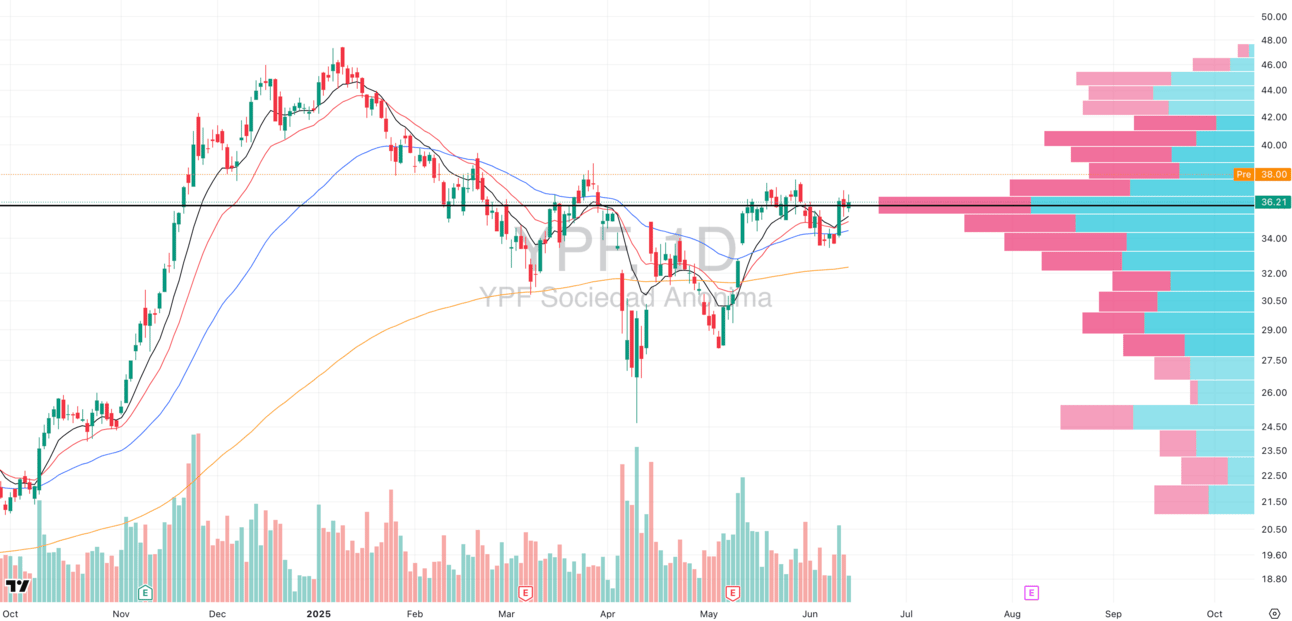
YPF VRVP Daily Chart
The sharp spike in oil prices following the escalation in the Middle East has fueled aggressive moves across oil and gas stocks. As expected, capital is rotating into this defensive commodity space — and some individual names are showing strong leadership potential.
One standout is YPF, which has just launched out of a clean reversal pattern and is now tightening right on its Point of Control (POC). This morning, YPF gapped up sharply and is attempting to push through a dense overhead supply zone around $38 — a level that’s capped price for months.
We’ll be watching closely for a breakout through the 5-minute opening range high as our potential trigger.
📌 Tactical Note:
With gap-ups like this, the opening range is your best tool to avoid getting caught in a fade. Wait for confirmation that buyers are defending the move before committing capital. The trend is your friend, but only if it confirms strength through the opening volatility.
This group (XLE, USO, FCG) is now firmly back in play. Run scans across oil and gas names showing:
High ADRs
Strong volume surges
Recent base breakouts or tight consolidation under highs
Capital is clearly rotating here — now it’s about finding the best vehicle to ride it.
FOCUSED GROUP
GDX: Gold Miners
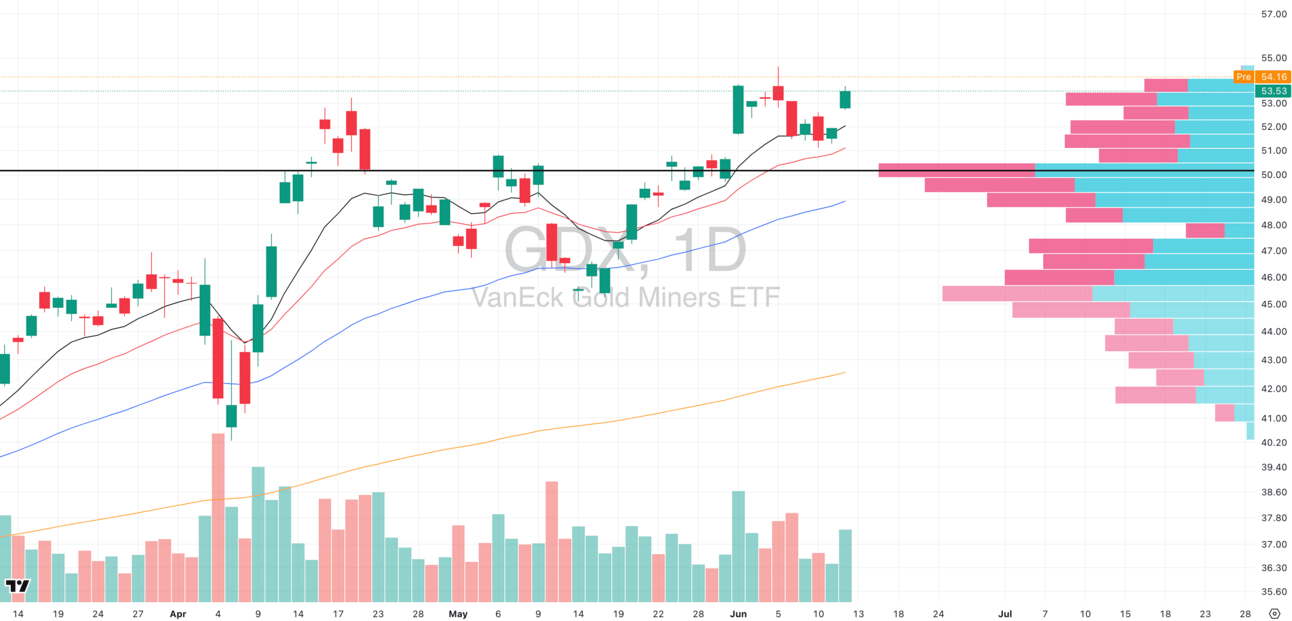
GDX VRVP Daily Chart
With rising geopolitical tensions, gold (GLD) and gold miners (GDX) have quietly emerged as a key sector to monitor — especially if the Israel-Iran situation escalates and leads to a risk-off shift in equities. Historically, these moments have triggered a flight to safety, and gold tends to be the first destination for capital rotation.
GDX broke out yesterday but initially struggled to hold above the $55 resistance zone. However, we’re seeing early signs of follow-through today — and this could be the start of a new leadership phase for the group.
🧠 What to Do Now:
This is a perfect time to run top-down scans across the gold mining sector. Ask yourself:
Which stocks are showing the strongest relative strength vs GDX?
Which names have the cleanest multi-month bases or linear trends?
Which have the highest ADRs (average daily ranges) to offer real asymmetry?
Which are showing rising volume on up days and tight price action?
Your goal is to isolate the top 3–5 leaders within the space — not just the ones breaking out, but those breaking out cleanly, with structure and follow-through.
📌 Tip: Remember, sector strength alone isn’t enough. You want to own the top names in the top groups. If GDX is moving, odds are the best-performing gold stocks will break first — so act accordingly.

Q&A
Got a trading question? Hit reply and ask!
Q: “Is it time to sell my positions now that the Israel-Iran crisis has happened?”
A: No — and here’s why. One of the biggest mistakes swing traders make is reacting to geopolitical headlines instead of following their system. Just because a macro or geopolitical event creates fear doesn’t mean your setups have failed. Price and volume — not news — dictate exits.
If you're holding leading stocks that have been acting well, chances are they’ll test their rising 10 or 20-day EMAs and attempt to absorb the volatility. Strong stocks don’t just crumble on noise — they often consolidate, digest, and move higher once the dust settles. That’s why blindly selling based on news flow is rarely optimal.
Let’s also be real: we are not geopolitical analysts. We don’t know how global conflicts will unfold or how markets will interpret them. What we do know is trend, relative strength, behavior at key moving averages, and sector flows — and that’s what pays.
Now, if you’re holding names that are extended and sitting on large unrealized gains, trimming into strength — especially in stocks sitting >8x ATR multiple from 50 EMA — can be smart risk management. But again, that’s a decision based on technicals and your system, not emotions or news headlines.
Did you find value in today's publication?This helps us better design our content for our readers |
Reply