- Swingly
- Posts
- Growth Is Extremely Extended
Growth Is Extremely Extended


MARKET ANALYSIS
Here’s All You Need To Know
The market begins the week with a very similar message to what we have seen repeatedly through April: geopolitical headlines continue to create noise, but price itself is still refusing to materially break. Futures are flat to slightly lower this morning even as Iran talks have stalled again and tensions around the Strait of Hormuz remain elevated.
Oil is pushing higher once more, with WTI back above $95 and Brent above $106, after fresh disruption near the Strait and renewed uncertainty around whether any near-term diplomatic progress actually happens. That matters because the market had started to price in a smoother de-escalation path, and this morning is a reminder that this remains highly fluid.
The key point, however, is that crude still has not broken trend at all. Oil continues to hold above its rising short-term moving averages and, more importantly, above the rising 10-week structure that we highlighted in recent reports. So while price has not exploded higher again, it is still consolidating in strength rather than showing meaningful weakness.
That remains important because if crude begins another leg higher from here, it becomes increasingly difficult for markets to remain fully complacent, particularly with growth already statistically extended after the last four weeks of upside.
Despite that, equities continue to show very notable resilience. The S&P and Nasdaq both closed at fresh highs last week, and even this morning futures are only marginally softer despite another escalation in headline risk.
A major reason for that resilience is still earnings. This week is one of the most important earnings weeks of the quarter, with five of the largest mega-cap technology names reporting over the next few sessions. At current valuations, the market is effectively demanding that those names continue to justify the pace of AI-led growth already being priced in.
That means this week is not simply about earnings beats — it is about whether guidance can continue supporting the current narrow leadership that has driven most of the upside.
The other major macro event is the Federal Reserve. Rates are expected to remain unchanged, but the market will be highly sensitive to tone, particularly with oil elevated again and inflation-sensitive energy pricing back in focus.
For now, the broader message remains unchanged: growth leadership is still intact, buyers are still active underneath the surface, and macro stress is still being absorbed far better than many would expect.
The only thing becoming increasingly important now is that the strongest parts of the market are no longer cheap from a short-term technical perspective, which means macro headlines matter more than they did three weeks ago.
S&P 500
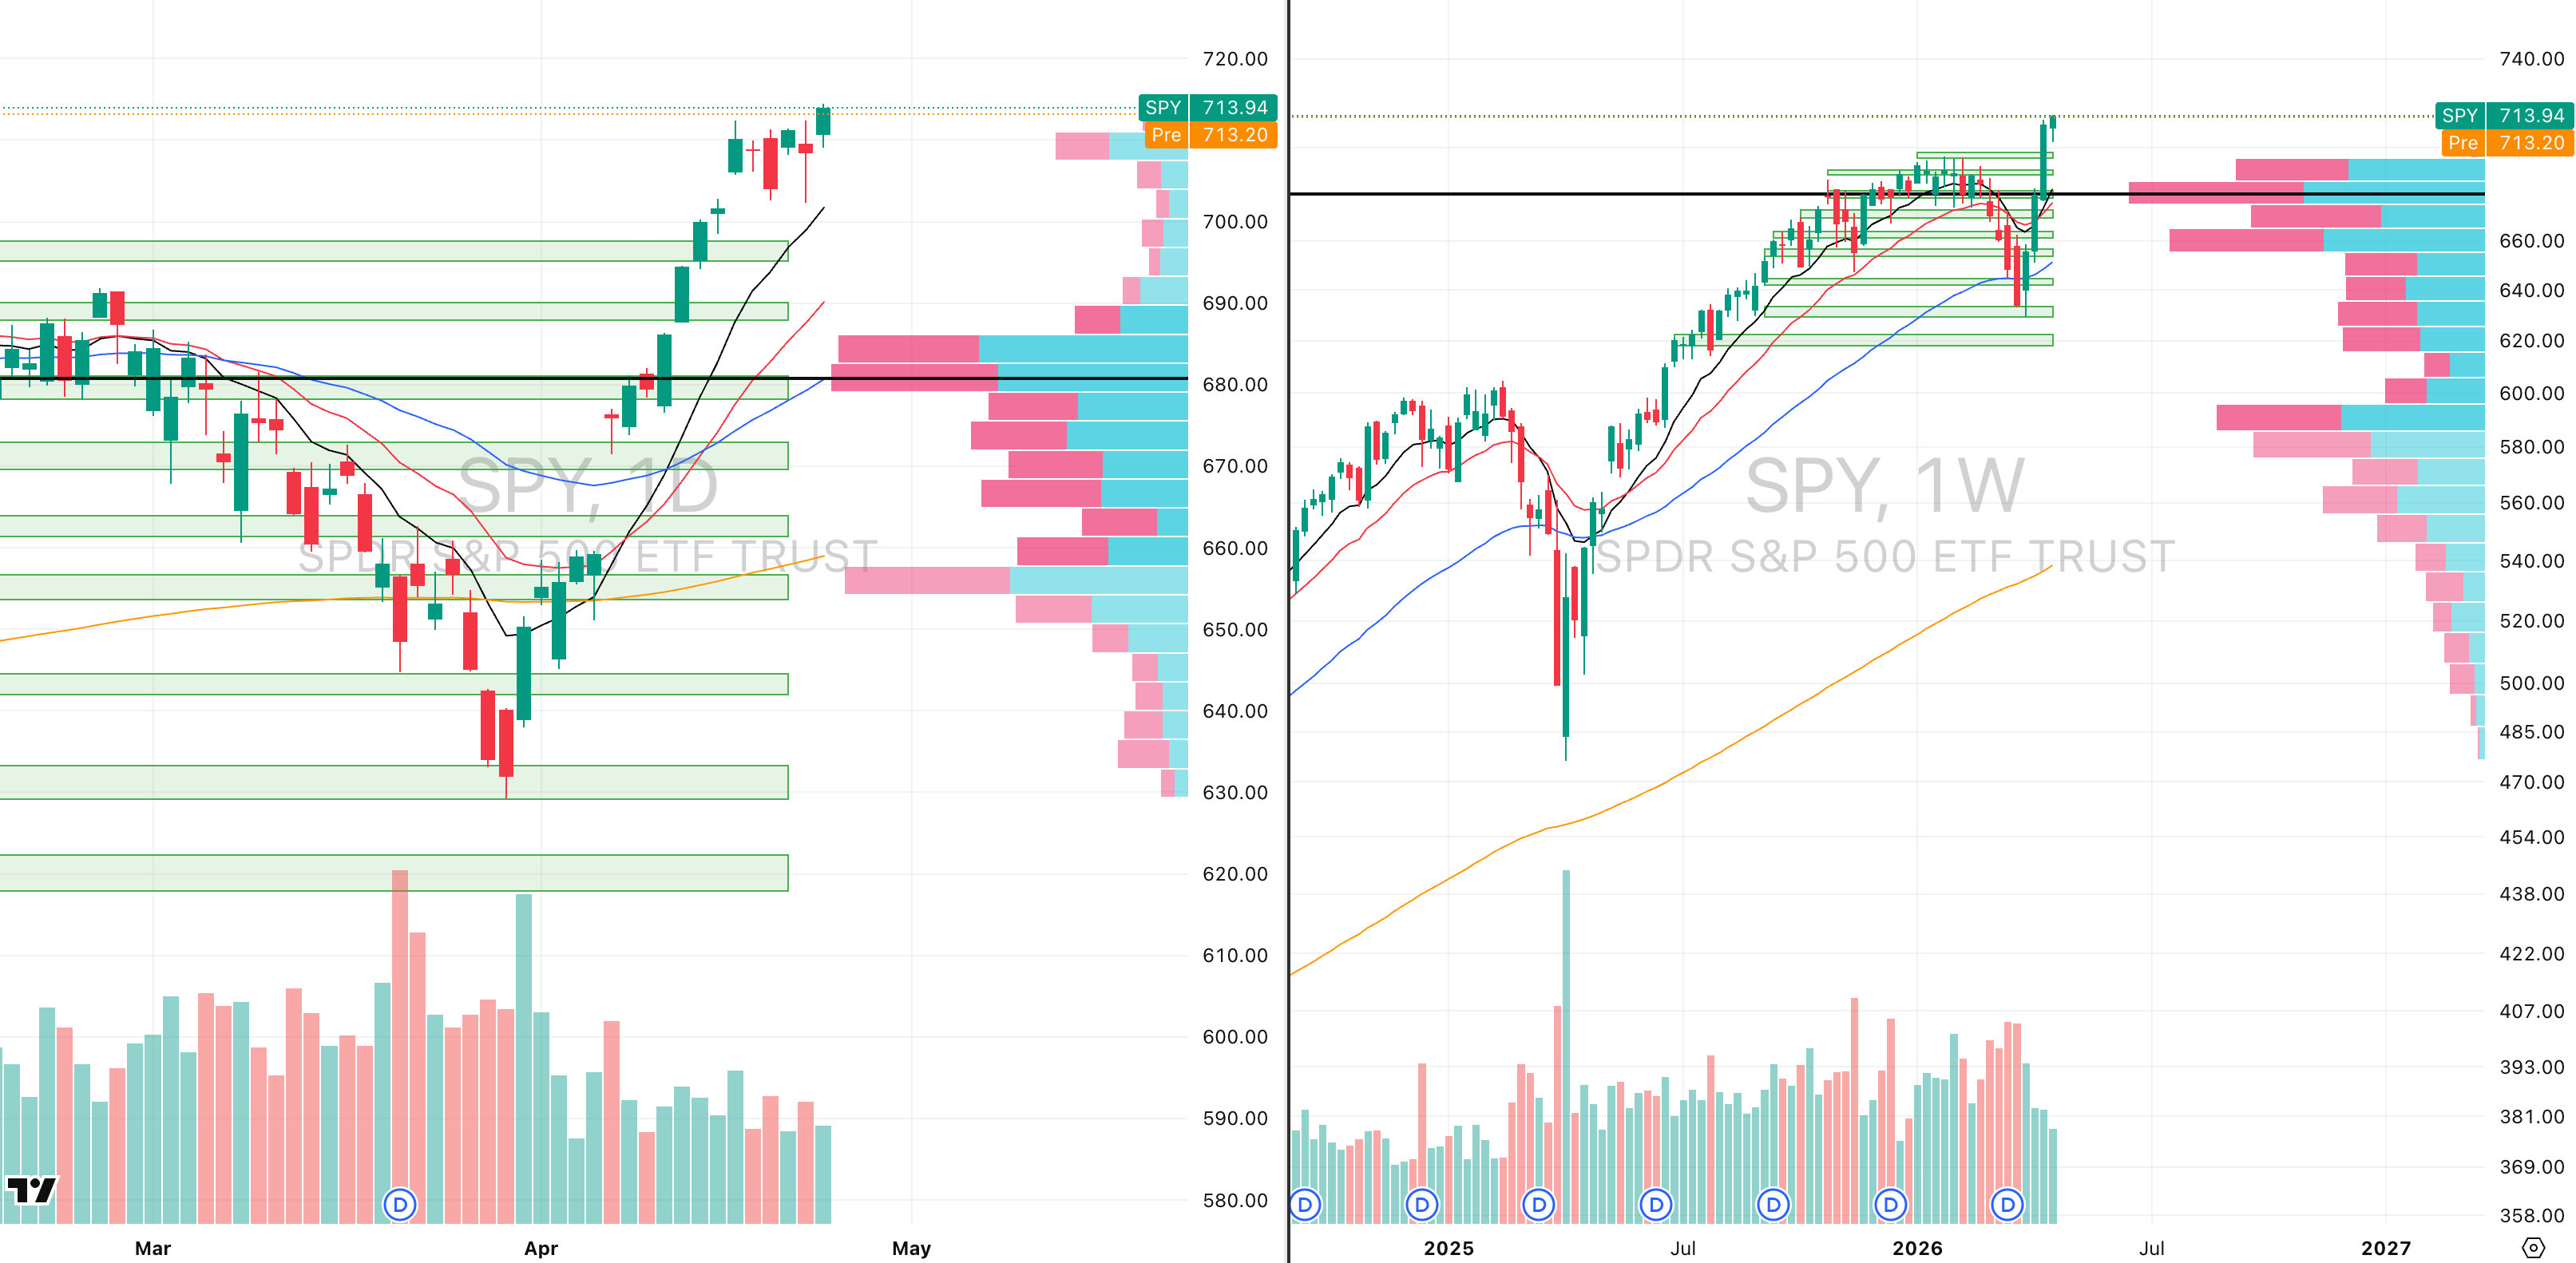
SPY VRVP Daily & Weekly Chart
59.44%: over 20 EMA | 52.48%: over 50 EMA | 54.67%: over 200 EMA
SPY remains in the same characteristic low-volume rally that has been in place since the March 30 reversal off the 200-day EMA. The move began from the undercut of the 200-day moving average and the reclaim of the 629 supply zone, and since then price has advanced roughly 13.5% in just 21 trading days, which is statistically significant when set against an average weekly range of only 2.76%.
Friday delivered another push into all-time highs, but volume remains the main concern. Relative volume came in at only 54% of the 20-day average, which means price is still advancing without broad participation expanding underneath it.
Despite that, buyers are still clearly active under the surface. At Friday’s lows around 709, the visible range volume profile showed roughly 10 million shares traded green versus 6.95 million red, and even near the highs buyers still dominated, with 4.6 million shares green versus only 1.29 million red.
That keeps the short-term trend intact. The issue is not weakness — the issue is how extended leadership has now become, particularly inside semiconductors, where the market’s most important leadership group is entering statistically extreme territory.
Semiconductors are now the key variable to monitor. XSD is trading roughly 12.8 ATR multiples above its 50-day moving average, which is extremely stretched from a mean-reversion standpoint.
That level of extension is difficult to sustain. XSD is now roughly 34% above its 50-day moving average, and although Friday still delivered 214% relative volume, the asymmetry at this stage becomes increasingly difficult for fresh longs.
From a pure tactical perspective, semiconductors are now closer to parabolic conditions than clean continuation conditions. A pullback toward roughly 425, which aligns with the rising 10-day moving average, would represent roughly 11% downside and would still leave the broader trend intact.
That does not mean semiconductor leadership is finished. Individual leaders such as Nvidia are still behaving exceptionally well, but index-level exposure here is becoming technically difficult to justify without accepting very wide risk.
Nvidia itself remains one of the strongest technical structures in the market. Friday’s breakout came on very strong relative volume and followed a 259-day primary base, which is exactly the kind of long-duration structure that often fuels stage two continuation moves.
However, even Nvidia should not be chased here. The breakout is valid, but price is already extended enough that fresh exposure now carries materially worse asymmetry than waiting for controlled pullbacks.
Nasdaq
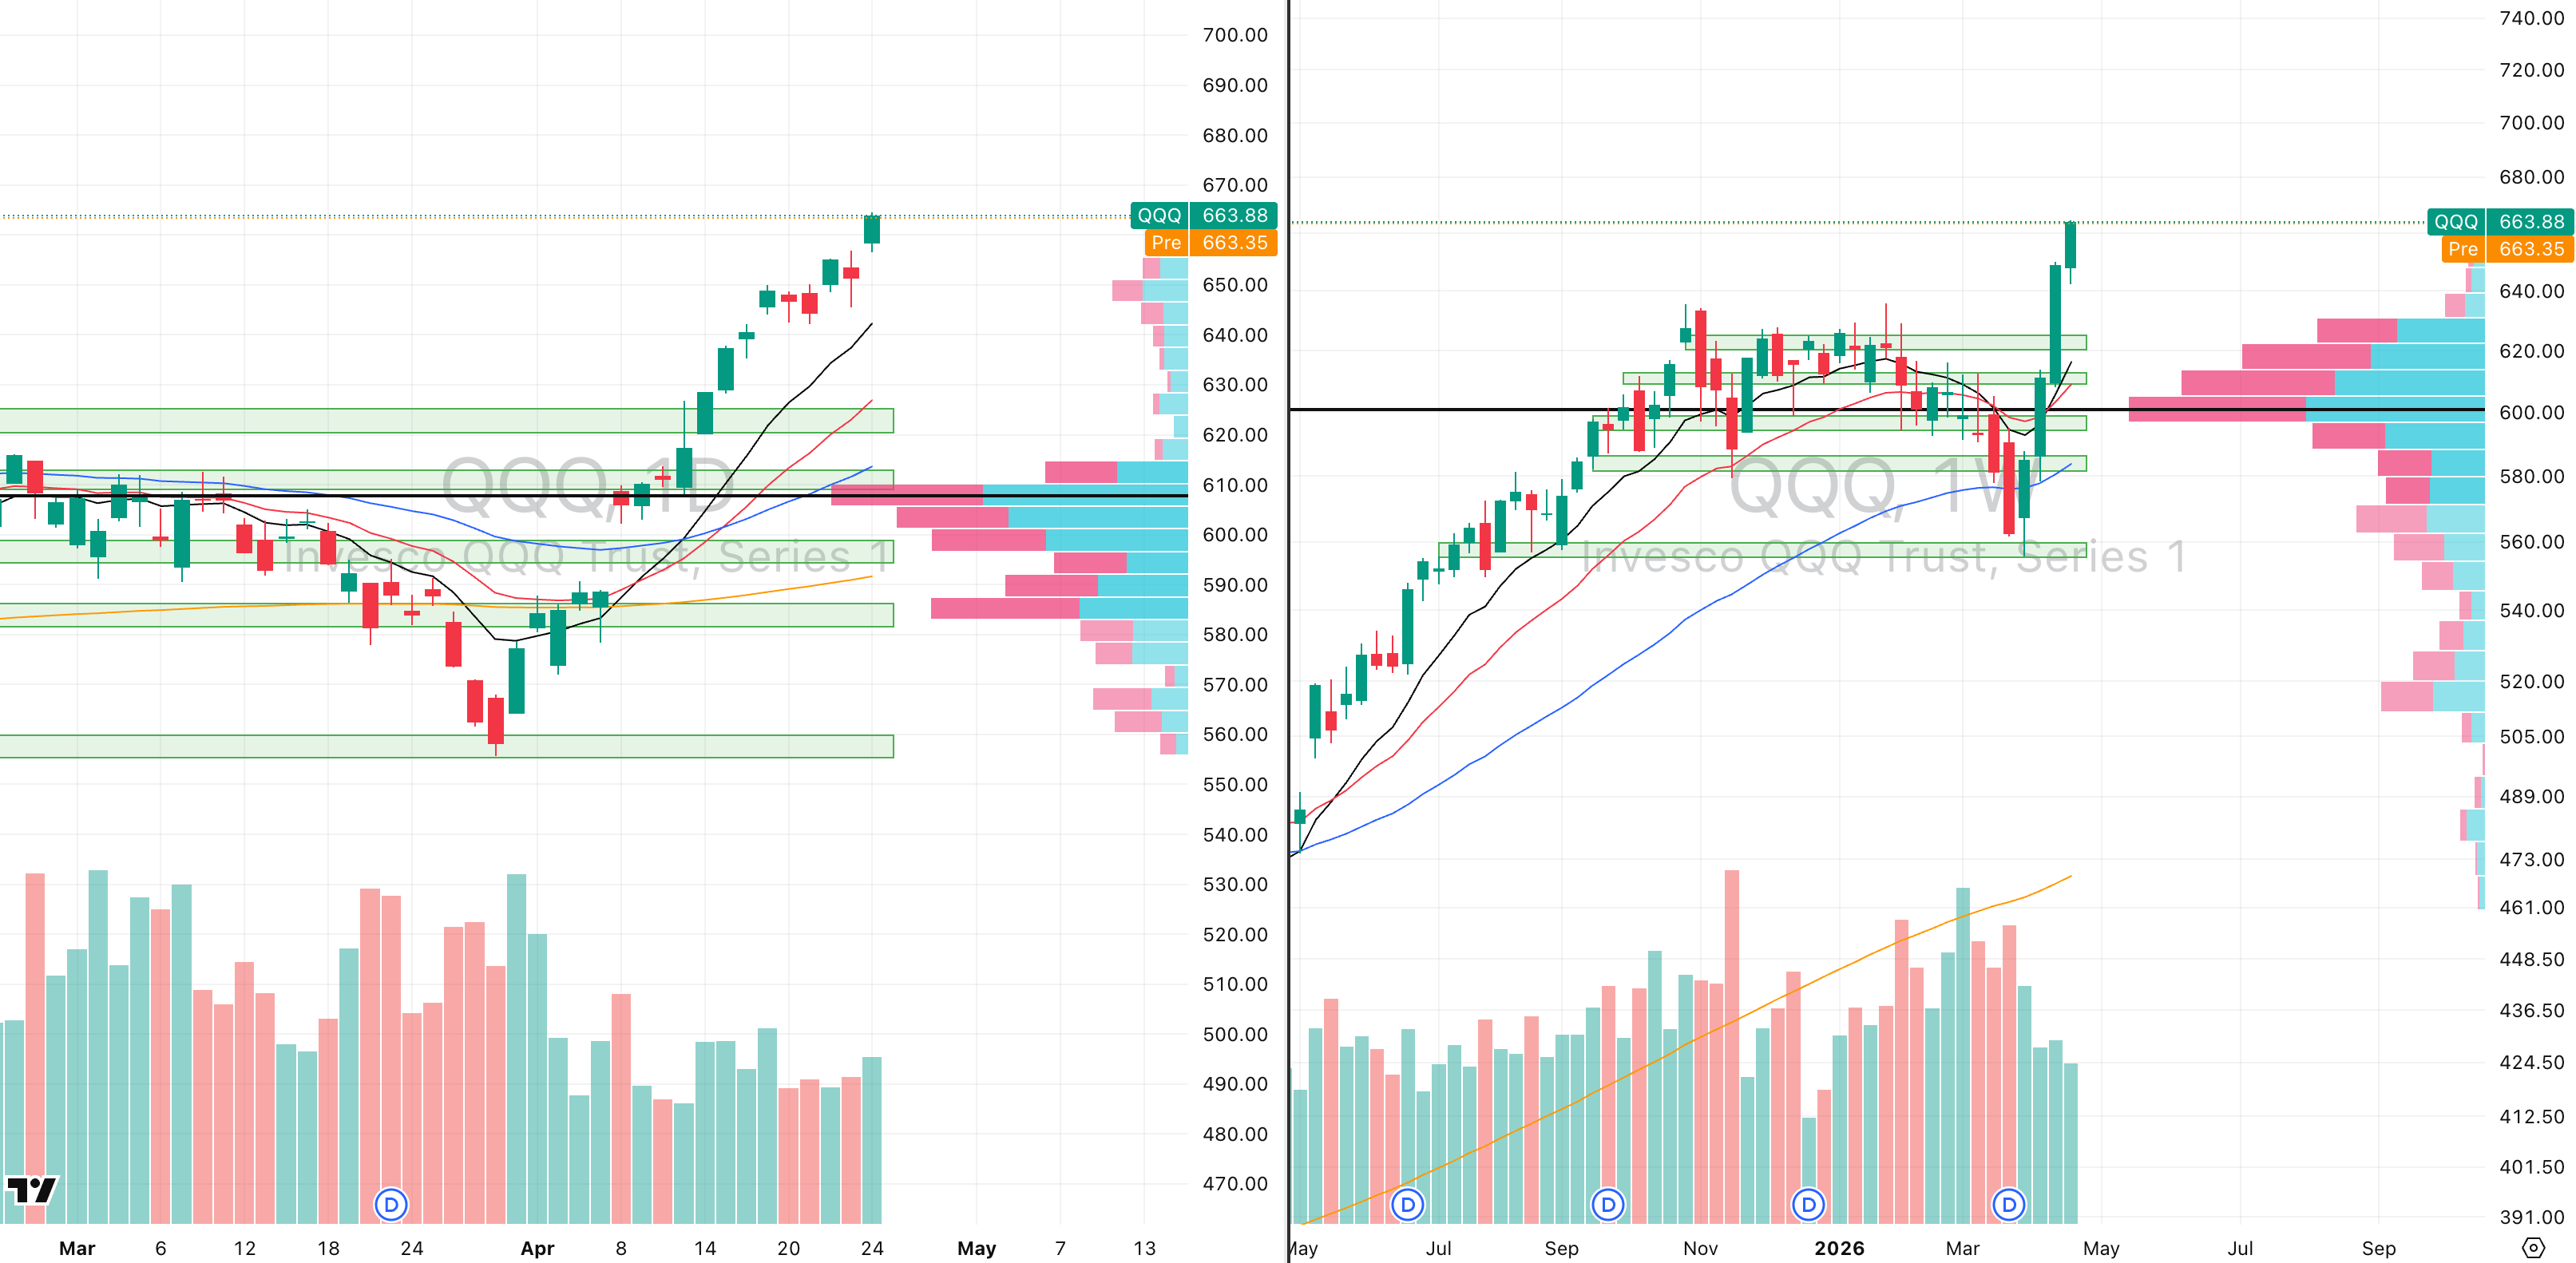
QQQ VRVP Daily & Weekly Chart
67.32%: over 20 EMA | 61.38%: over 50 EMA | 52.47%: over 200 EMA
NASDAQ remains the strongest major index structurally. Friday’s breakout came on 72% relative volume, confirming continued leadership even without major participation expansion.
The main caution here is extension. NASDAQ is now trading roughly 5.9 ATR multiples above its 50-day moving average, which is not extreme like semiconductors, but it is beginning to move into hotter territory.
The broader reason this continues to hold is still positioning. Open interest has continued rising, short covering remains active, and retail participation still appears late relative to institutional accumulation.
S&P 400 Midcap
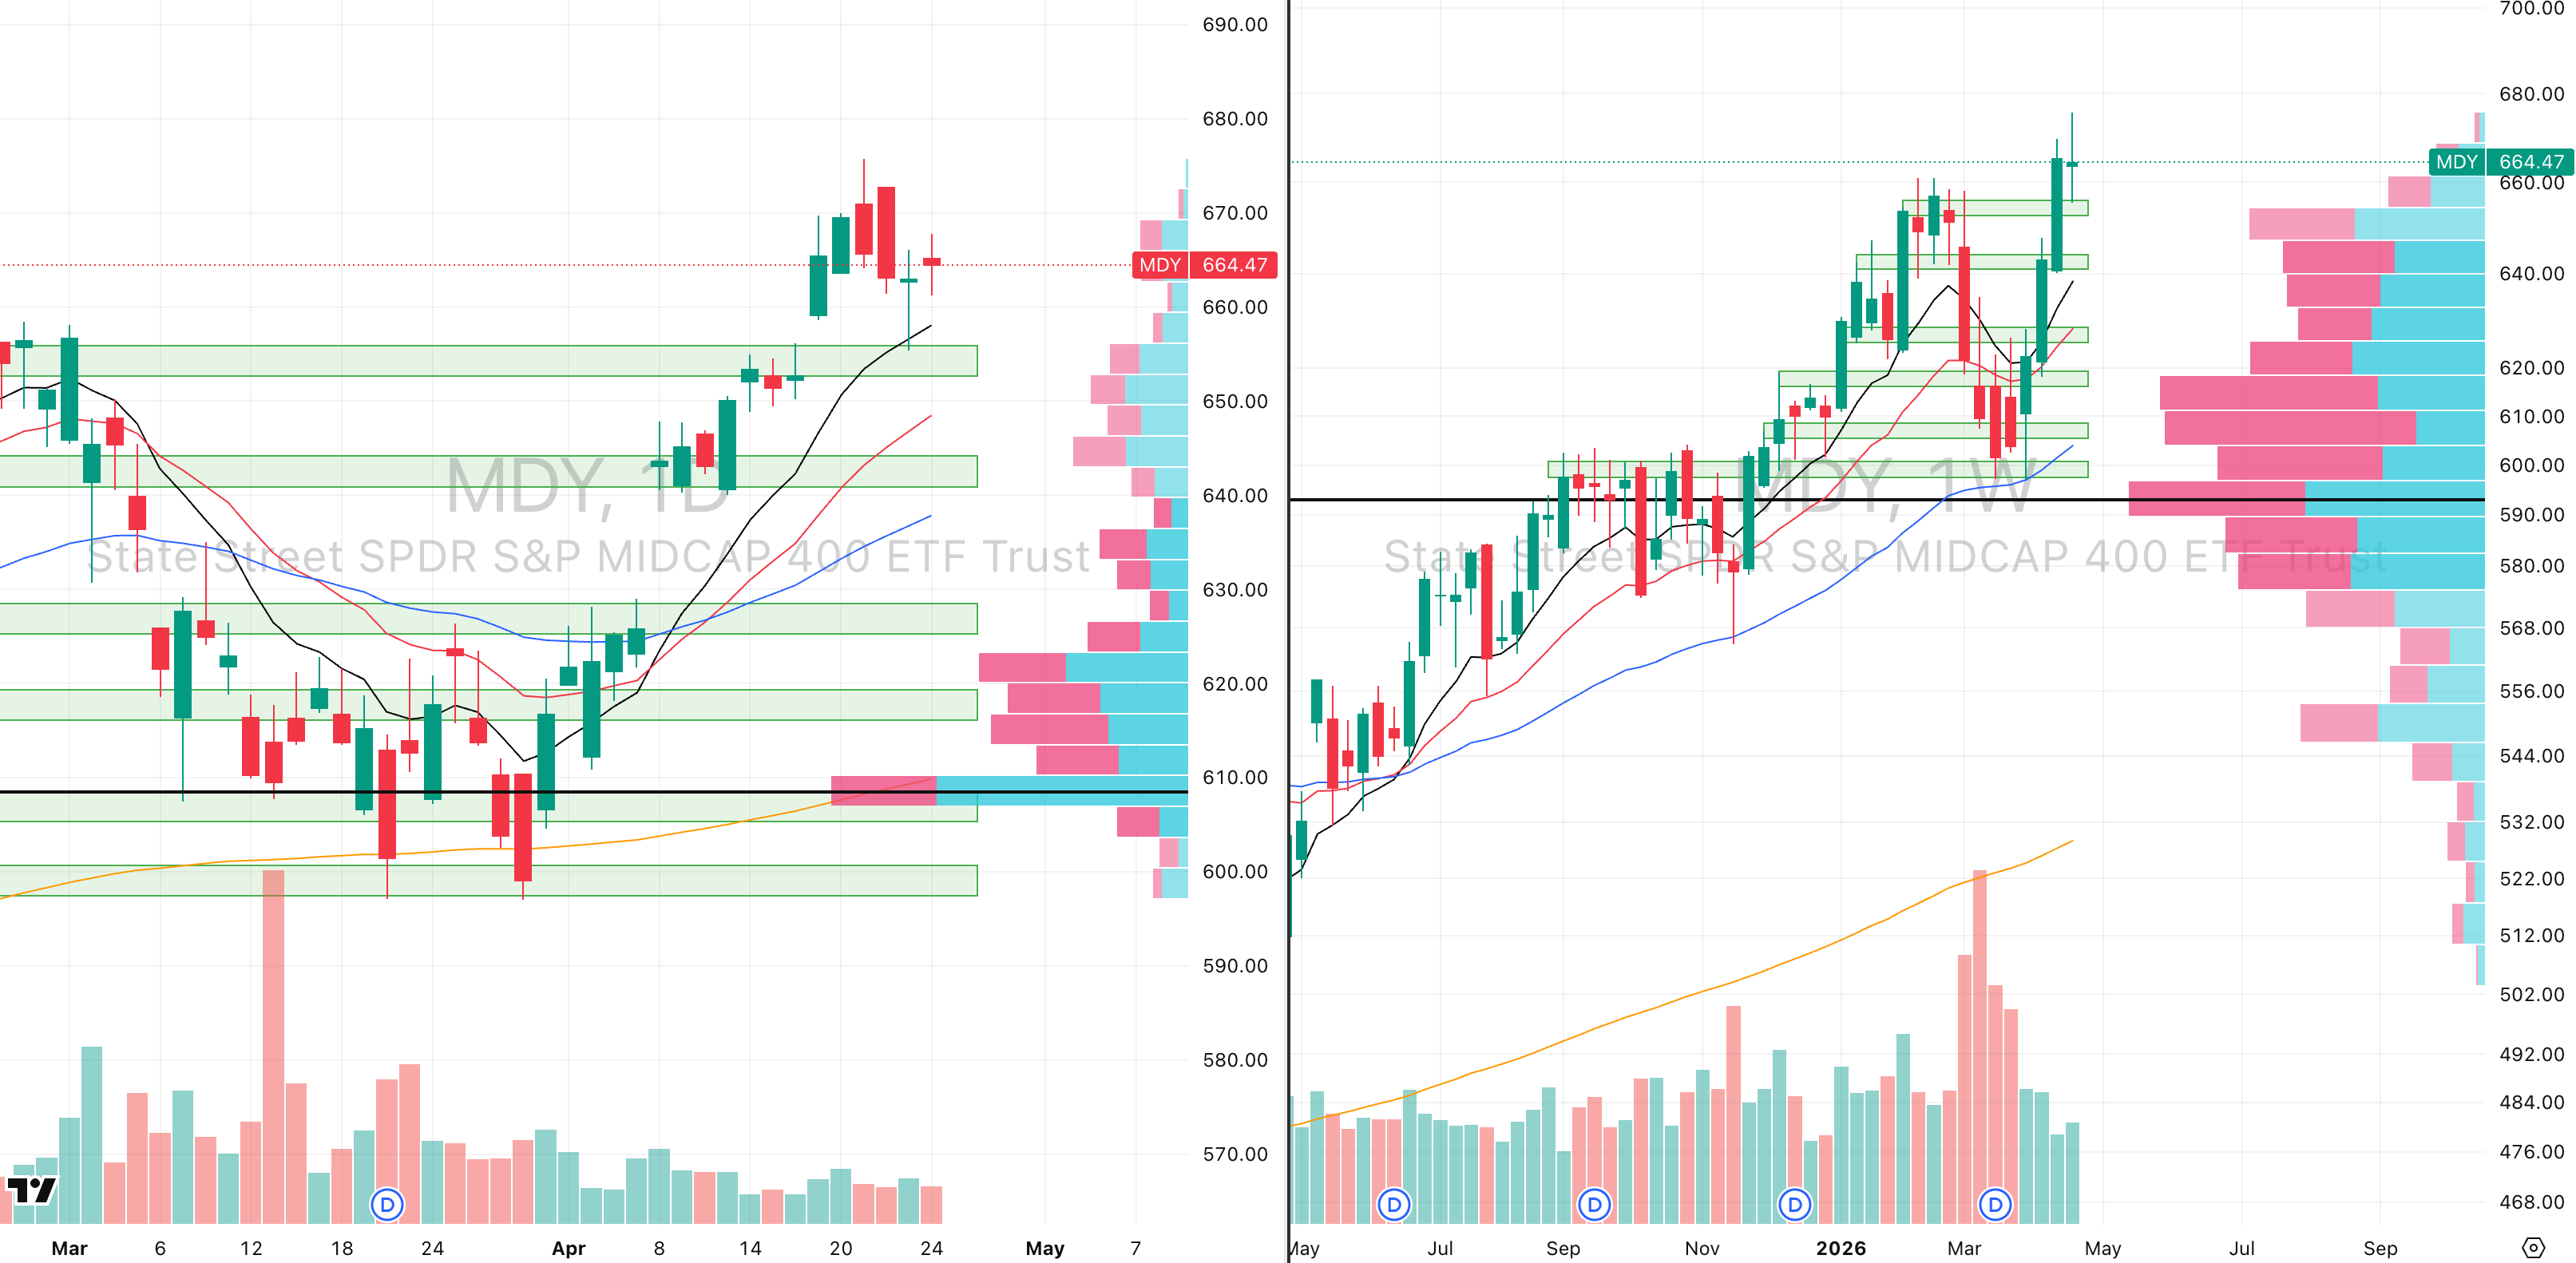
70.42%: over 20 EMA | 62.65%: over 50 EMA | 60.40%: over 200 EMA
Mid-caps continue to offer cleaner asymmetry. They remain technically much less extended than large-cap growth and have now cleanly flipped the prior February–March supply zone into demand.
The bounce off the 10-day moving average last Thursday confirmed that shift. Volume profile still shows clear demand at 656, with roughly 250,000 shares green versus only 89,000 red, a strong imbalance in favour of buyers.
That makes mid-caps one of the cleaner long structures currently available. ATR extension remains low at roughly 2.7 multiples, meaning risk-adjusted continuation is still much more attractive than in large-cap growth.
Russell 2000
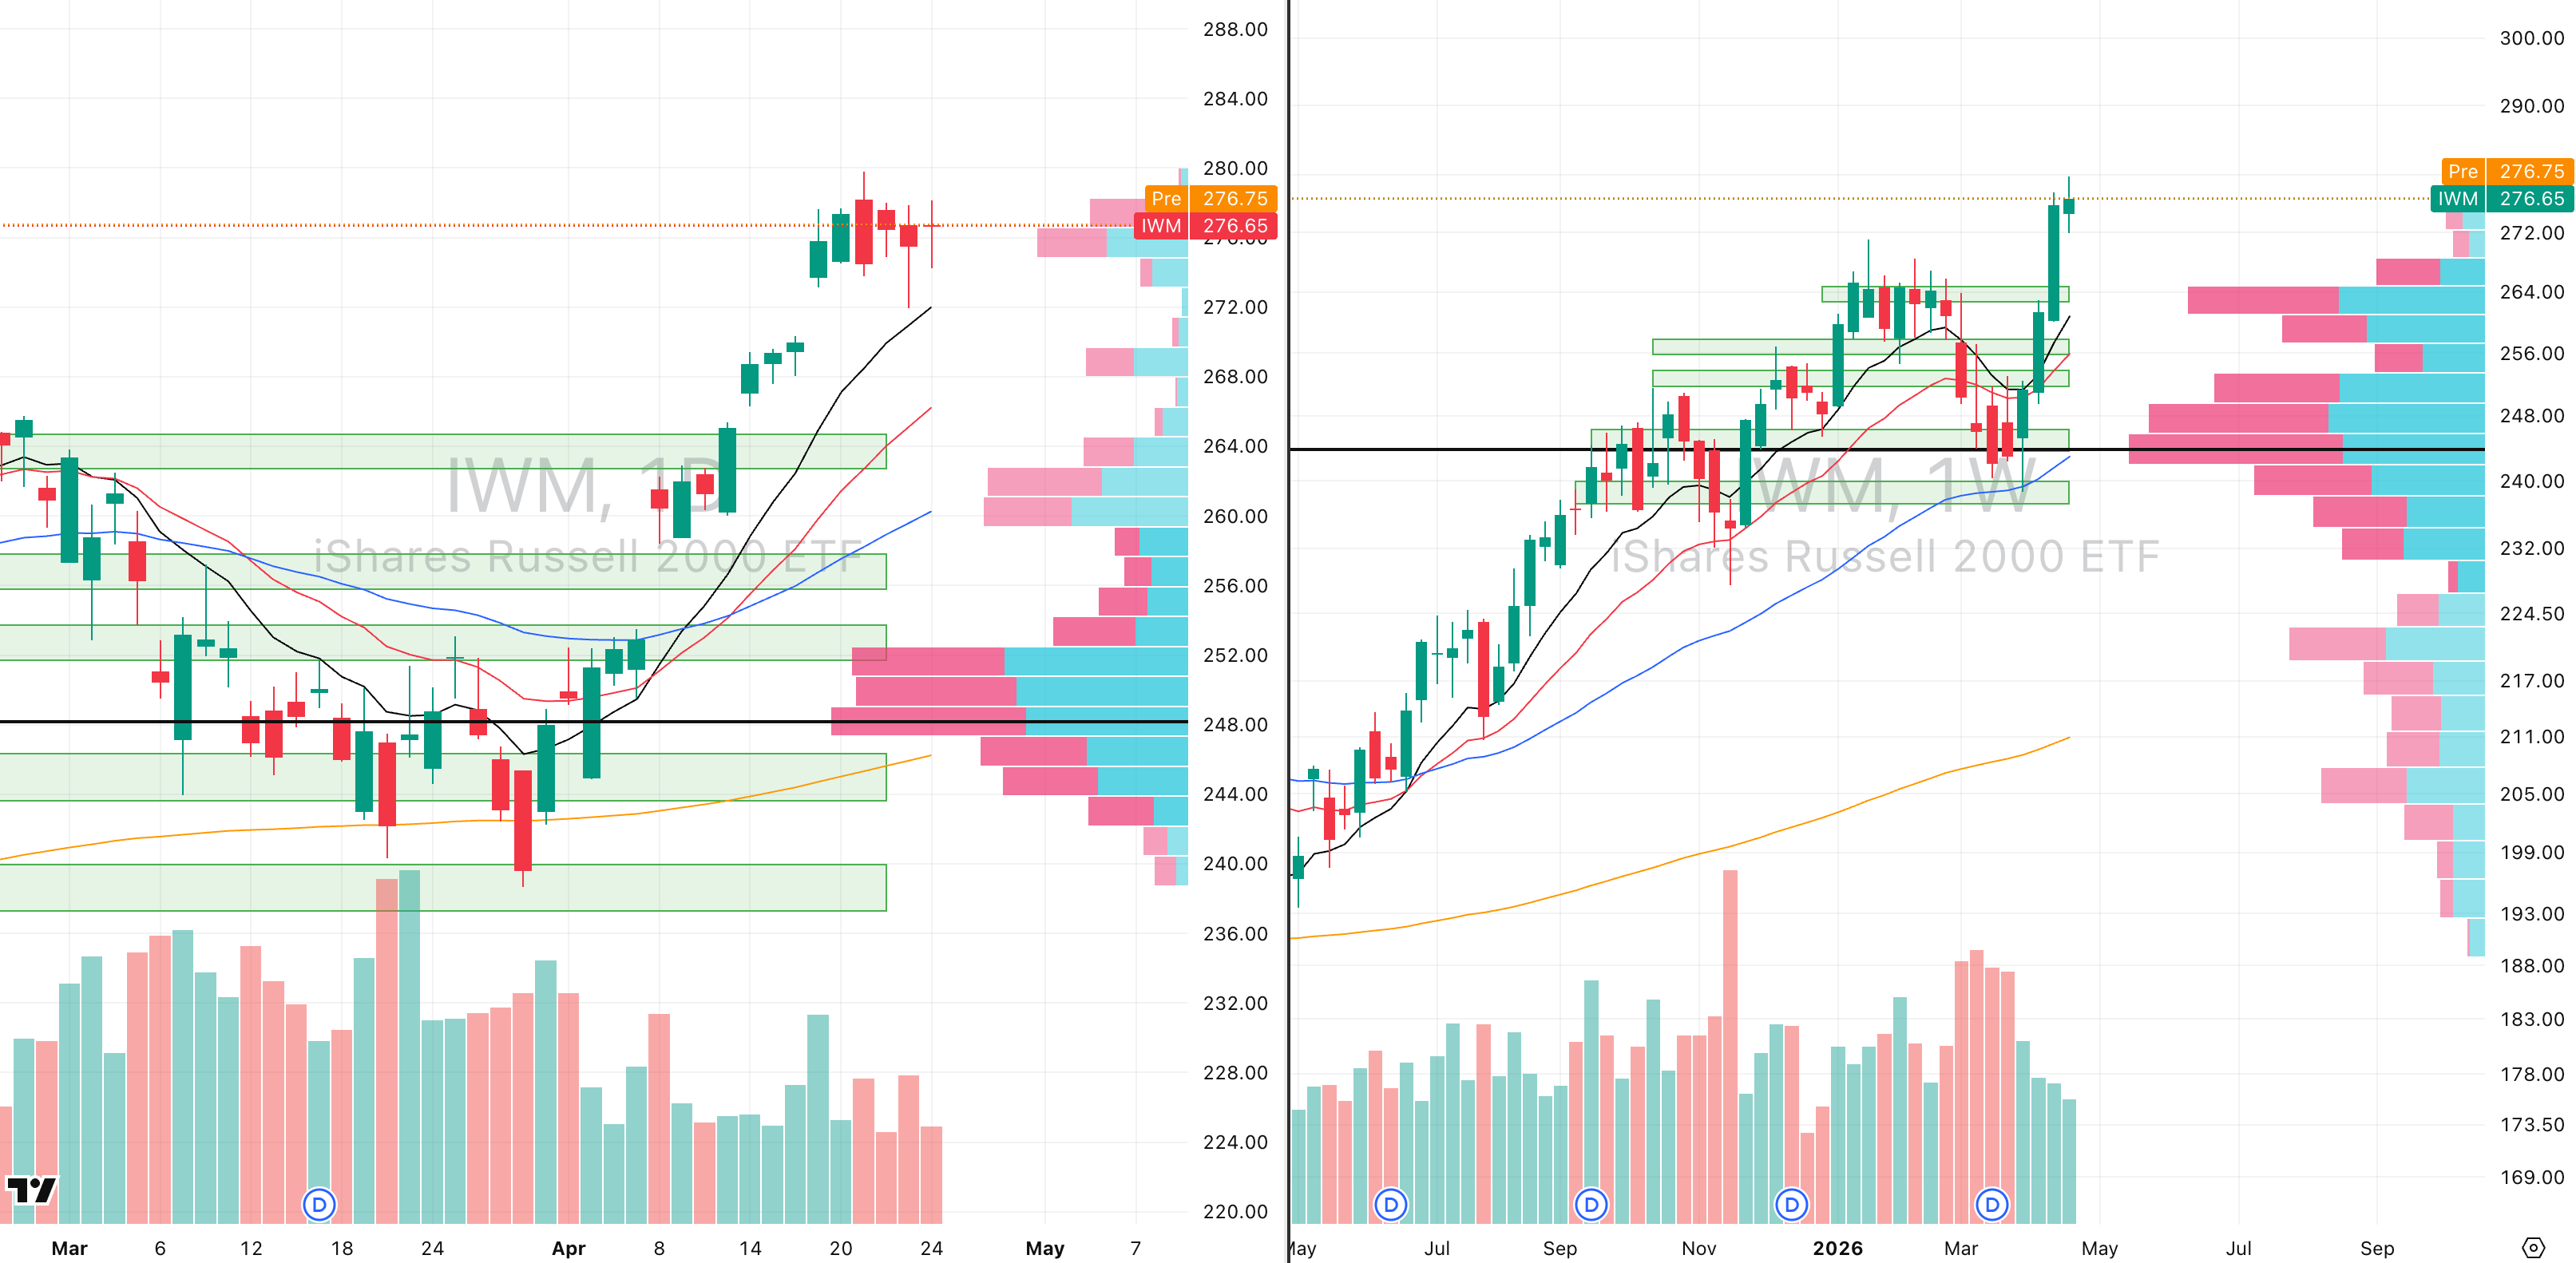
IWM VRVP Daily & Weekly Chart
75.35%: over 20 EMA | 71.49%: over 50 EMA | 61.28%: over 200 EMA
Russell 2000 remains equally constructive. The index is forming a very clean volatility contraction after a roughly 15.5% advance in three weeks, which increasingly resembles a high-tight flag.
That matters because small caps remain one of the strongest expressions of true risk appetite. Institutions generally do not commit aggressively to small caps unless broader risk appetite remains healthy.
A pullback toward the rising 10-day moving average, roughly 1.8% lower, would still be entirely normal and constructive.
FOCUSED GROUP
XSD: Parabolic Short on Semiconductors
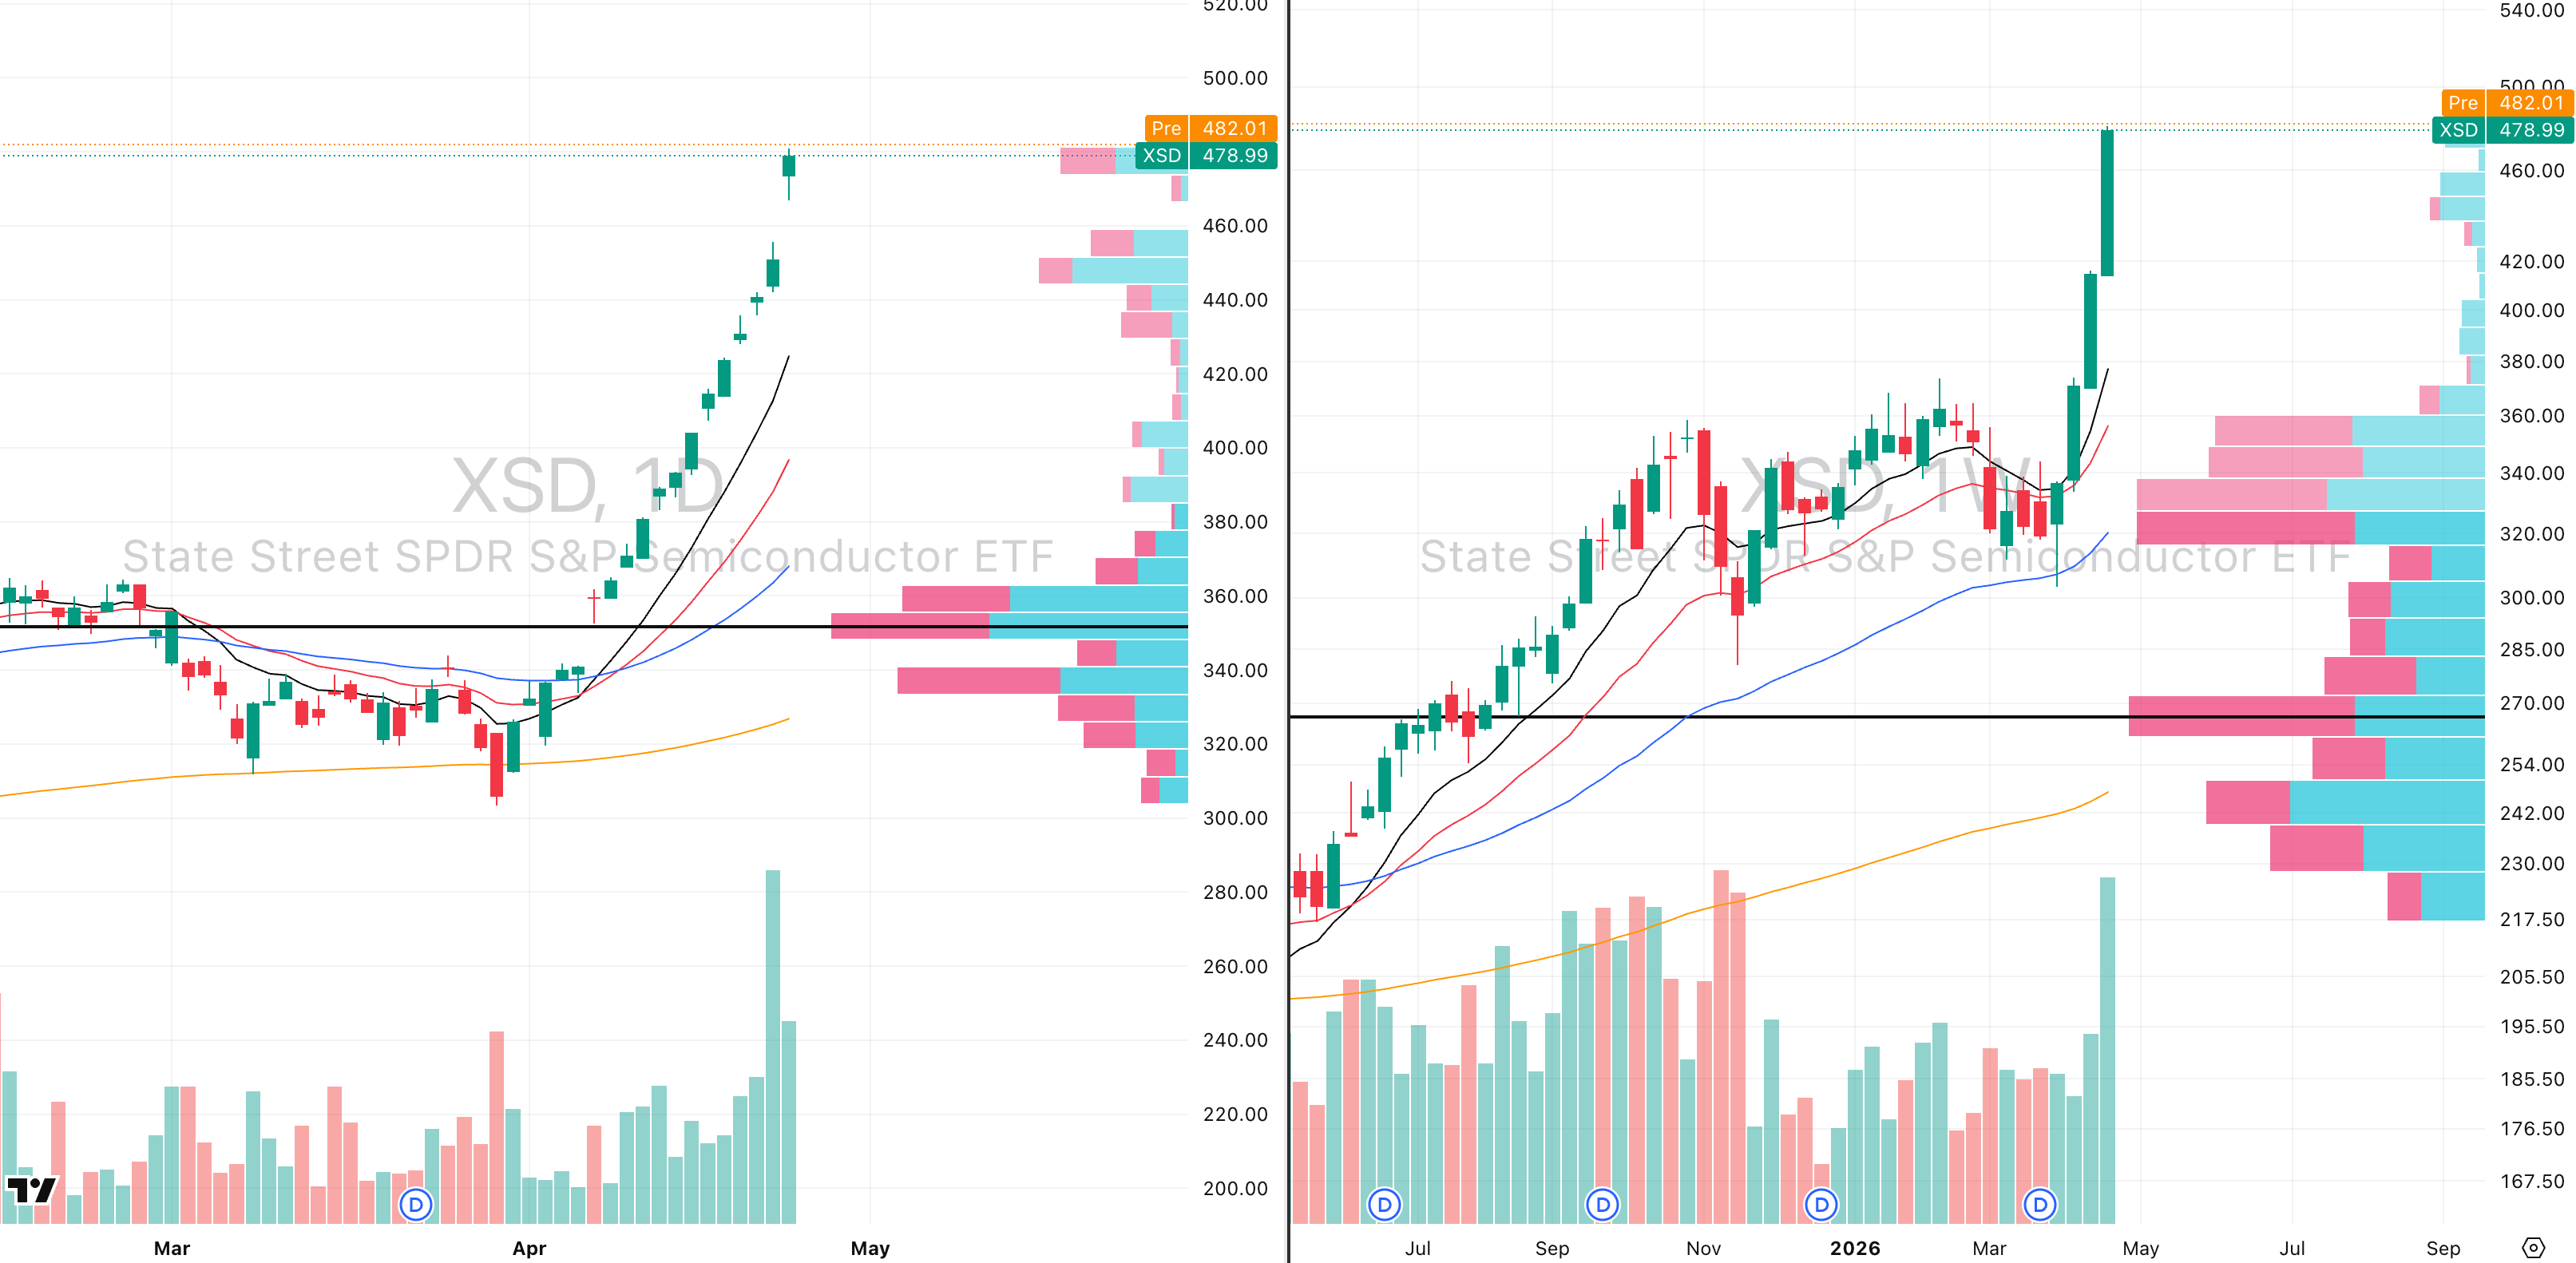
XSD VRVP Daily & Weekly Chart
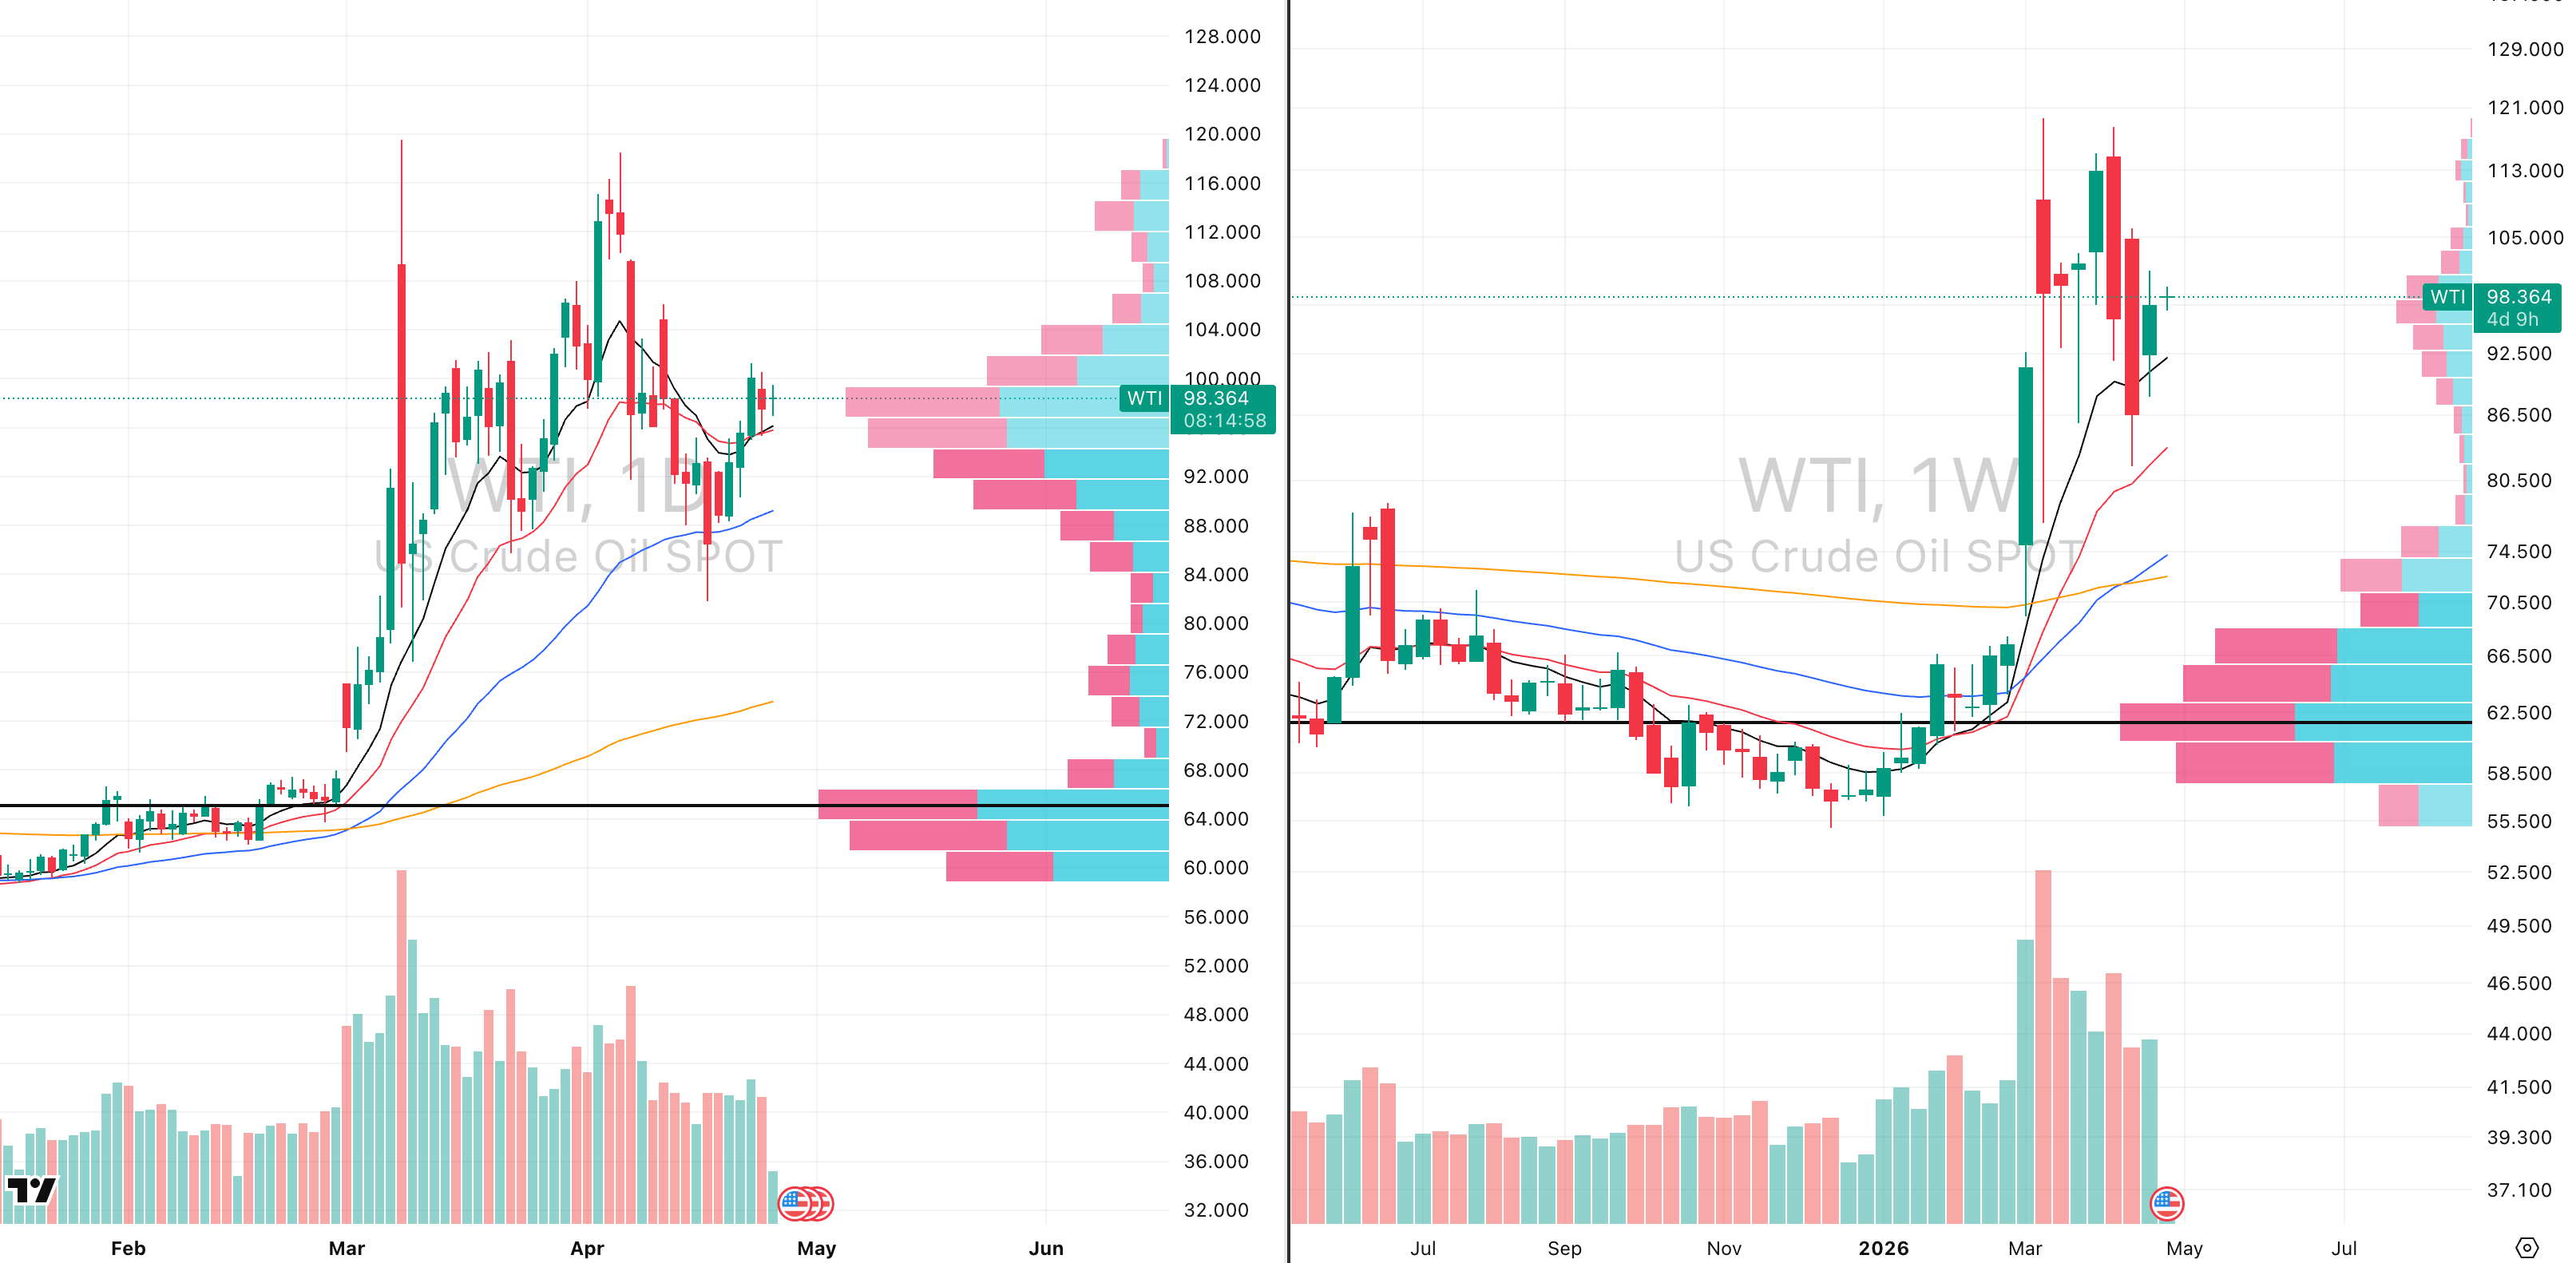
WTI VRVP Daily & Weekly Chart
Semiconductors remain the strongest leadership group, but they are now statistically stretched enough that tactical discipline becomes critical.
At current extension, the asymmetry increasingly favours waiting rather than chasing. Long positions now require extremely wide stops simply to survive normal volatility.
From a pure trading perspective, index-level semiconductor exposure is now much closer to a short-term mean-reversion setup than a clean breakout setup.
That means leadership is too extended to enter cleanly at current levels.
The better approach now is shifting away from breakout-high entries and toward pullback longs into rising daily and weekly moving averages across the strongest names.
One macro variable that deserves close tracking here is oil. WTI continues to hold its rising 10-week moving average, and importantly, buyers are still appearing there.
That matters because seeing crude stabilise while growth is simultaneously reaching statistical extension introduces a variable the market cannot ignore.
If oil strengthens again while semiconductors remain overstretched, that combination can quickly create the first meaningful pause in this rally.
For now, trend remains intact — but the approach should shift from chasing strength to waiting for controlled pullbacks into support.

Did you find value in today's publication?This helps us better design our content for our readers |
Reply