- Swingly
- Posts
- Friday's Sell Off Doesn't Scare Us
Friday's Sell Off Doesn't Scare Us


MARKET ANALYSIS
What You Need To Know

U.S. equity futures are higher to start the week following a choppy period driven by rotation out of mega-cap tech and into lower-valuation areas of the market.
Dow futures are leading, reflecting continued strength in value and cyclical exposure, while tech-heavy benchmarks lag on a relative basis.
Last week reinforced the rotation theme:
S&P 500: −0.6%
Nasdaq Composite: −1.7%
Dow Jones: +1.1%
The underperformance in tech was concentrated in AI-linked names, with Broadcom and Oracle leading the downside and the S&P 500 tech sector falling over 2%.
Market leadership continues to broaden away from the Magnificent 7, aligning with stronger performance in non-tech components of the index.
This shift supports the idea of a “broadening-out” market rather than a market rolling over.
The macro focus now turns to a heavy economic data slate this week:
Tuesday: November Nonfarm Payrolls and October Retail Sales (delayed due to the government shutdown).
Thursday: November CPI.
These releases will be key in shaping expectations around the pace of future rate cuts after the Fed delivered its third consecutive cut last week.
Fed commentary continues to lean toward easing bias, with policymakers framing labor market risks as more pressing than inflation risks.
From a market structure perspective, the combination of:
easing financial conditions,
rotation into value and cyclicals,
and leadership from the “other 493”
supports risk appetite outside of crowded mega-cap tech.
Nasdaq

QQQ VRVP Daily & Weekly Chart
62.37%: over 20 EMA | 51.48%: over 50 EMA | 58.41%: over 200 EMA
Friday was a sharp and uncomfortable session for the cap-weighted Nasdaq, driven by a clean rejection from overhead supply.
From a narrative standpoint, this spooked participants given QQQ’s visibility and its heavy influence on SPY.
Price sold off roughly 1 ADR, filling a low-volume pocket on the visible range volume profile between ~618 down to ~611.
Buyers stepped in at the 50-day moving average (~610), which also aligns closely with the 10-week moving average.
There is still a realistic scenario where QQQ pushes slightly lower toward ~608, where volume density and structural support increase.
A brief undercut of the 50-day / 10-week would not be abnormal in this context.
Short-term volatility remains painful for tech exposure, which reinforces why large and mega-cap tech has not been an area to press.
Zooming out materially changes the picture:
Price remains comfortably above the 10- and 20-week moving averages.
The broader structure still resembles an intermediate trend contraction, not trend failure.
S&P 400 Midcap
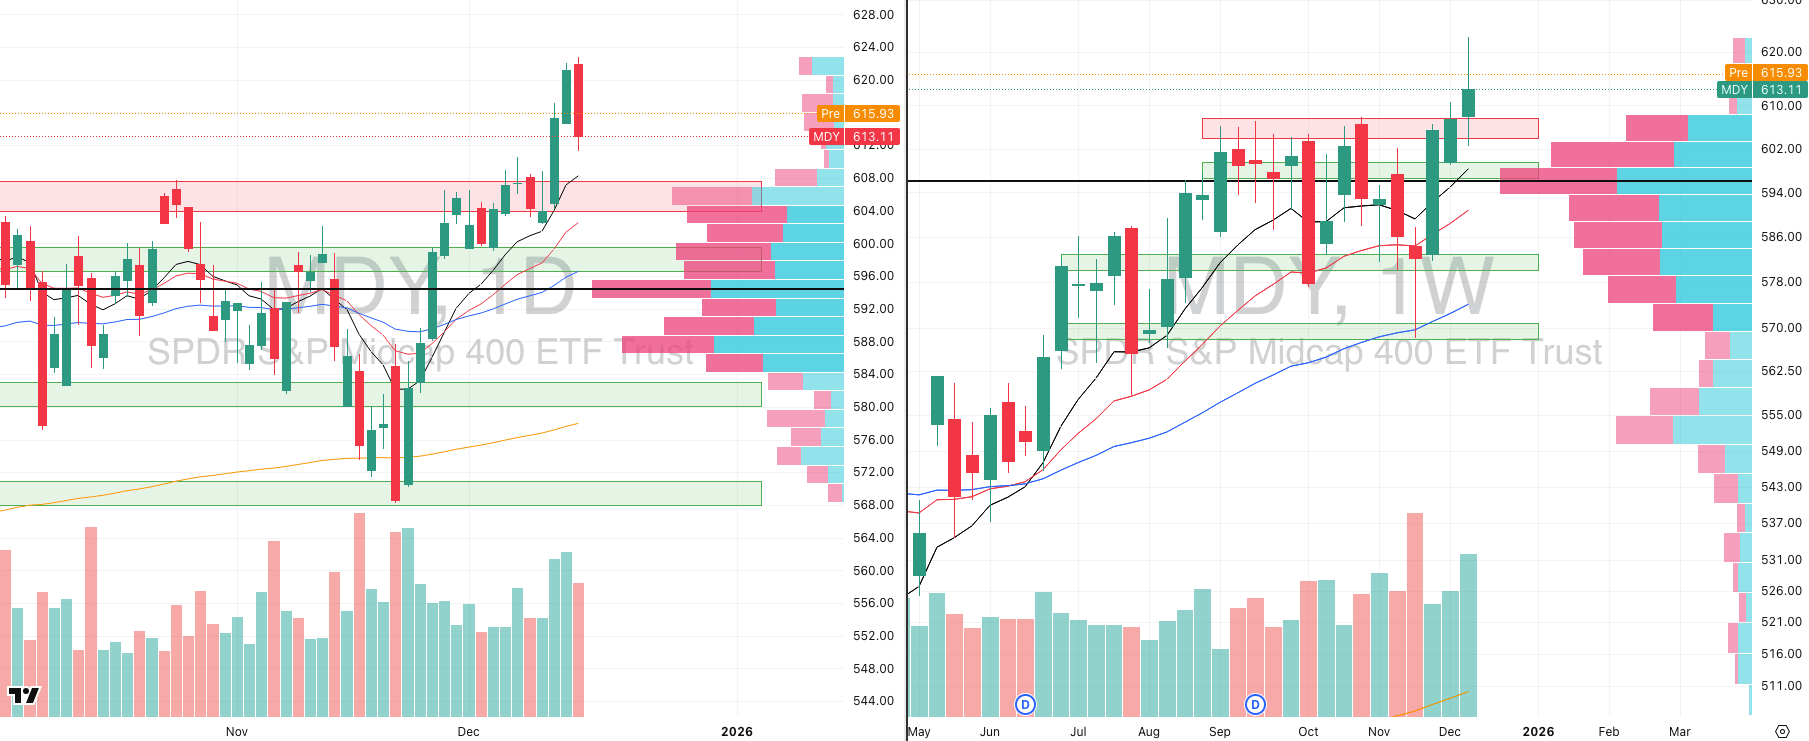
MDY VRVP Daily & Weekly Chart
73.31%: over 20 EMA | 65.58%: over 50 EMA | 61.59%: over 200 EMA
Relative strength in mid-caps remains obvious, despite Friday’s sharp pullback.
Friday’s range measured ~1.86%, exceeding the ETF’s ~1.5% ADR, which explains the short-term mean reversion showing up pre-market.
From a tactical standpoint, this is not an area to press exposure:
Price is still roughly ~1.4% above the nearest structural support.
That support sits near ~608, which also aligns with the rising 10-day moving average.
A retest of that level would be healthy and expected following the recent breakout.
Despite short-term caution, the relative performance versus large caps remains clearly superior.
The key takeaway is not weakness, but extension.
Russell 2000

IWM VRVP Daily & Weekly Chart
78.32%: over 20 EMA | 67.58%: over 50 EMA | 65.06%: over 200 EMA
Friday’s sell-off occurred on 136% relative volume, following a strong run into all-time highs.
Price undercut Thursday’s lows, similar to mid-caps, and is now stabilizing.
Since the Morning Star reversal near ~229, IWM is still up over 13%.
Nothing moves in a straight line, particularly after that magnitude of expansion.
Short-term overheating across breadth metrics made some mean reversion inevitable.
This reinforces an important behavioral point:
Pressing exposure at marginal highs in a volatile tape tends to produce poor outcomes.
The most important thing to monitor going forward:
Whether relative strength versus QQQ continues to widen.
As long as that relationship holds, small-caps remain structurally constructive despite near-term noise.
FOCUSED STOCK
SHOP:

SHOP VRVP Daily & Weekly Chart
ADR%: 4.38% | Off 52-week high: -9.9% | Above 52-week low: +135.1%
Shopify experienced a sharp shakeout on Friday, broadly in line with the rest of the market, with a wide intraday range and aggressive downside pressure early in the session.
Price sold directly into the point of control around 158–159, overlapping with the rising 20-day moving average, a level Shopify has consistently respected throughout December.
The most important detail was not the selloff itself, but the response. Despite an intraday range of just over 3.3%, Shopify closed down only -0.34%, signaling heavy absorption and strong demand into weakness.
Volume confirmed this behavior, showing buyers stepping in decisively rather than passive drift lower.
On a higher timeframe, Friday’s low also aligned closely with the rising 10-week moving average, reinforcing the idea that institutions continue to defend this trend.
Supply remains present above current price, particularly into the 167–168 zone, which capped last week’s breakout attempt and should be treated as near-term resistance.
Above that level, volume profile shows a thin supply zone into ~173, implying that acceptance above 168 could allow for a relatively fast upside move.
With an ADR of roughly 4.4%, Shopify is fully capable of covering that distance in a single session if momentum returns.
Relative strength versus the S&P 500 remains elevated at 92 and rising, keeping Shopify firmly in the leadership bucket.
Whether price breaks immediately or digests further, Shopify remains one of the strongest large-cap growth names in the market and a stock that should stay on the front page of any watchlist.
FOCUSED GROUP
KIE: This Is The Next Leadership Group

KIE VRVP Daily & Weekly Chart
Insurance continues to stand out as one of the most resilient pockets within financials, despite receiving relatively little attention compared to banks or brokers.
The group has been building a large base for over a year, dating back to November 2024, which provides meaningful structural context for any upside resolution.
While price has remained capped beneath overhead supply near 61, recent behavior shows a clear change in character.
Last week’s pullback held both the 10- and 20-week moving averages, with price finding support near the weekly point of control rather than accelerating lower.
Volume has been steadily expanding since late September, a critical signal that participation is increasing rather than fading as price compresses.
Notably, KIE showed relative strength on Friday, remaining firm while broader indices experienced a sharp shakeout.
If KIE can decisively clear 61 and hold above that level, it would mark acceptance into a new price zone following a prolonged base.
Given the duration of the consolidation and the recent volume expansion, any confirmed breakout is likely to be multi-month in nature, not a short-term trade.
From a top-down perspective, insurance should remain a priority group to monitor, especially as capital continues rotating into more stable, economically levered areas of the market.

Did you find value in today's publication?This helps us better design our content for our readers |
Reply