- Swingly
- Posts
- Expect More Pain In Equities
Expect More Pain In Equities


MARKET ANALYSIS
Here’s What You Need To Know
February inflation came in exactly where markets expected, with U.S. CPI printing 2.4% year-over-year and 0.3% month-over-month, while core CPI held at 2.5% annually.
On the surface, that tells you inflation is not re-accelerating yet, but just as importantly, it is also not cooling fast enough to materially change the Federal Reserve’s current posture.
Shelter remains sticky at 3% annual inflation, food accelerated again, and tariff-sensitive categories like apparel also moved higher, which means the broader inflation backdrop is still firm rather than soft. Consumer Price Index
The market reaction has been muted because traders understand this inflation print is already stale relative to what matters now. These numbers were collected before the latest oil shock, which means the next inflation reports are likely to reflect a very different energy backdrop if crude remains elevated.
In other words, today’s CPI is clean enough not to create panic, but it does not remove the bigger macro risk now building underneath the surface.
Oil remains the dominant macro variable this morning. Brent Crude is back near $89–$90, with intraday spikes toward $93, as markets continue trying to price what happens next around the Strait of Hormuz after further vessel strikes off Iran’s coast and new military escalation in the region.
The important point is that yesterday’s sharp oil collapse was partly distorted by false headlines after the U.S. Energy Secretary incorrectly suggested naval escorts had already resumed tanker traffic and that headline was later withdrawn, and oil immediately began repricing higher again.
The fact that oil could fall over 11% intraday on one incorrect headline tells you how unstable pricing remains right now. Markets are not trading certainty, they are trading headline probability minute by minute. That is why technical moves are repeatedly failing intraday and why conviction remains low across many breakout attempts.
The next key macro variable is whether the International Energy Agency proceeds with what could become the largest strategic oil reserve release in history, potentially exceeding the 182 million barrels released after the Russia invasion in 2022.
If that happens, it buys the global economy time, but it does not solve the underlying issue: the market still needs clarity on whether the Strait of Hormuz stabilizes.
That remains the true line in the sand. Roughly 20% of global oil supply moves through Hormuz, so every additional day of disruption keeps a structural risk premium embedded into energy pricing.
Strategically, reserve releases can suppress panic temporarily, but they cannot fully offset prolonged shipping disruption if escalation continues.
For equities, this creates a very specific short-term dynamic as inflation itself is not the immediate problem today but energy uncertainty is.
If oil stabilizes below $90, growth stocks likely continue trying to recover because the market can tolerate current CPI levels. If oil pushes back toward $100, that immediately pressures rate expectations again and increases the probability of another volatility spike.
This is why price action still feels unstable even when individual charts improve. The market is trying to build a technical bounce, but every bounce is still sitting underneath a macro environment where one geopolitical development can immediately reset risk appetite.
The market has not received a true macro all-clear signal. Inflation did not worsen, which helps, but oil remains the variable that matters most over the next several sessions.
Until oil volatility compresses meaningfully, traders should still expect sharp intraday reversals, lower breakout reliability, and much higher sensitivity to headlines.
Nasdaq
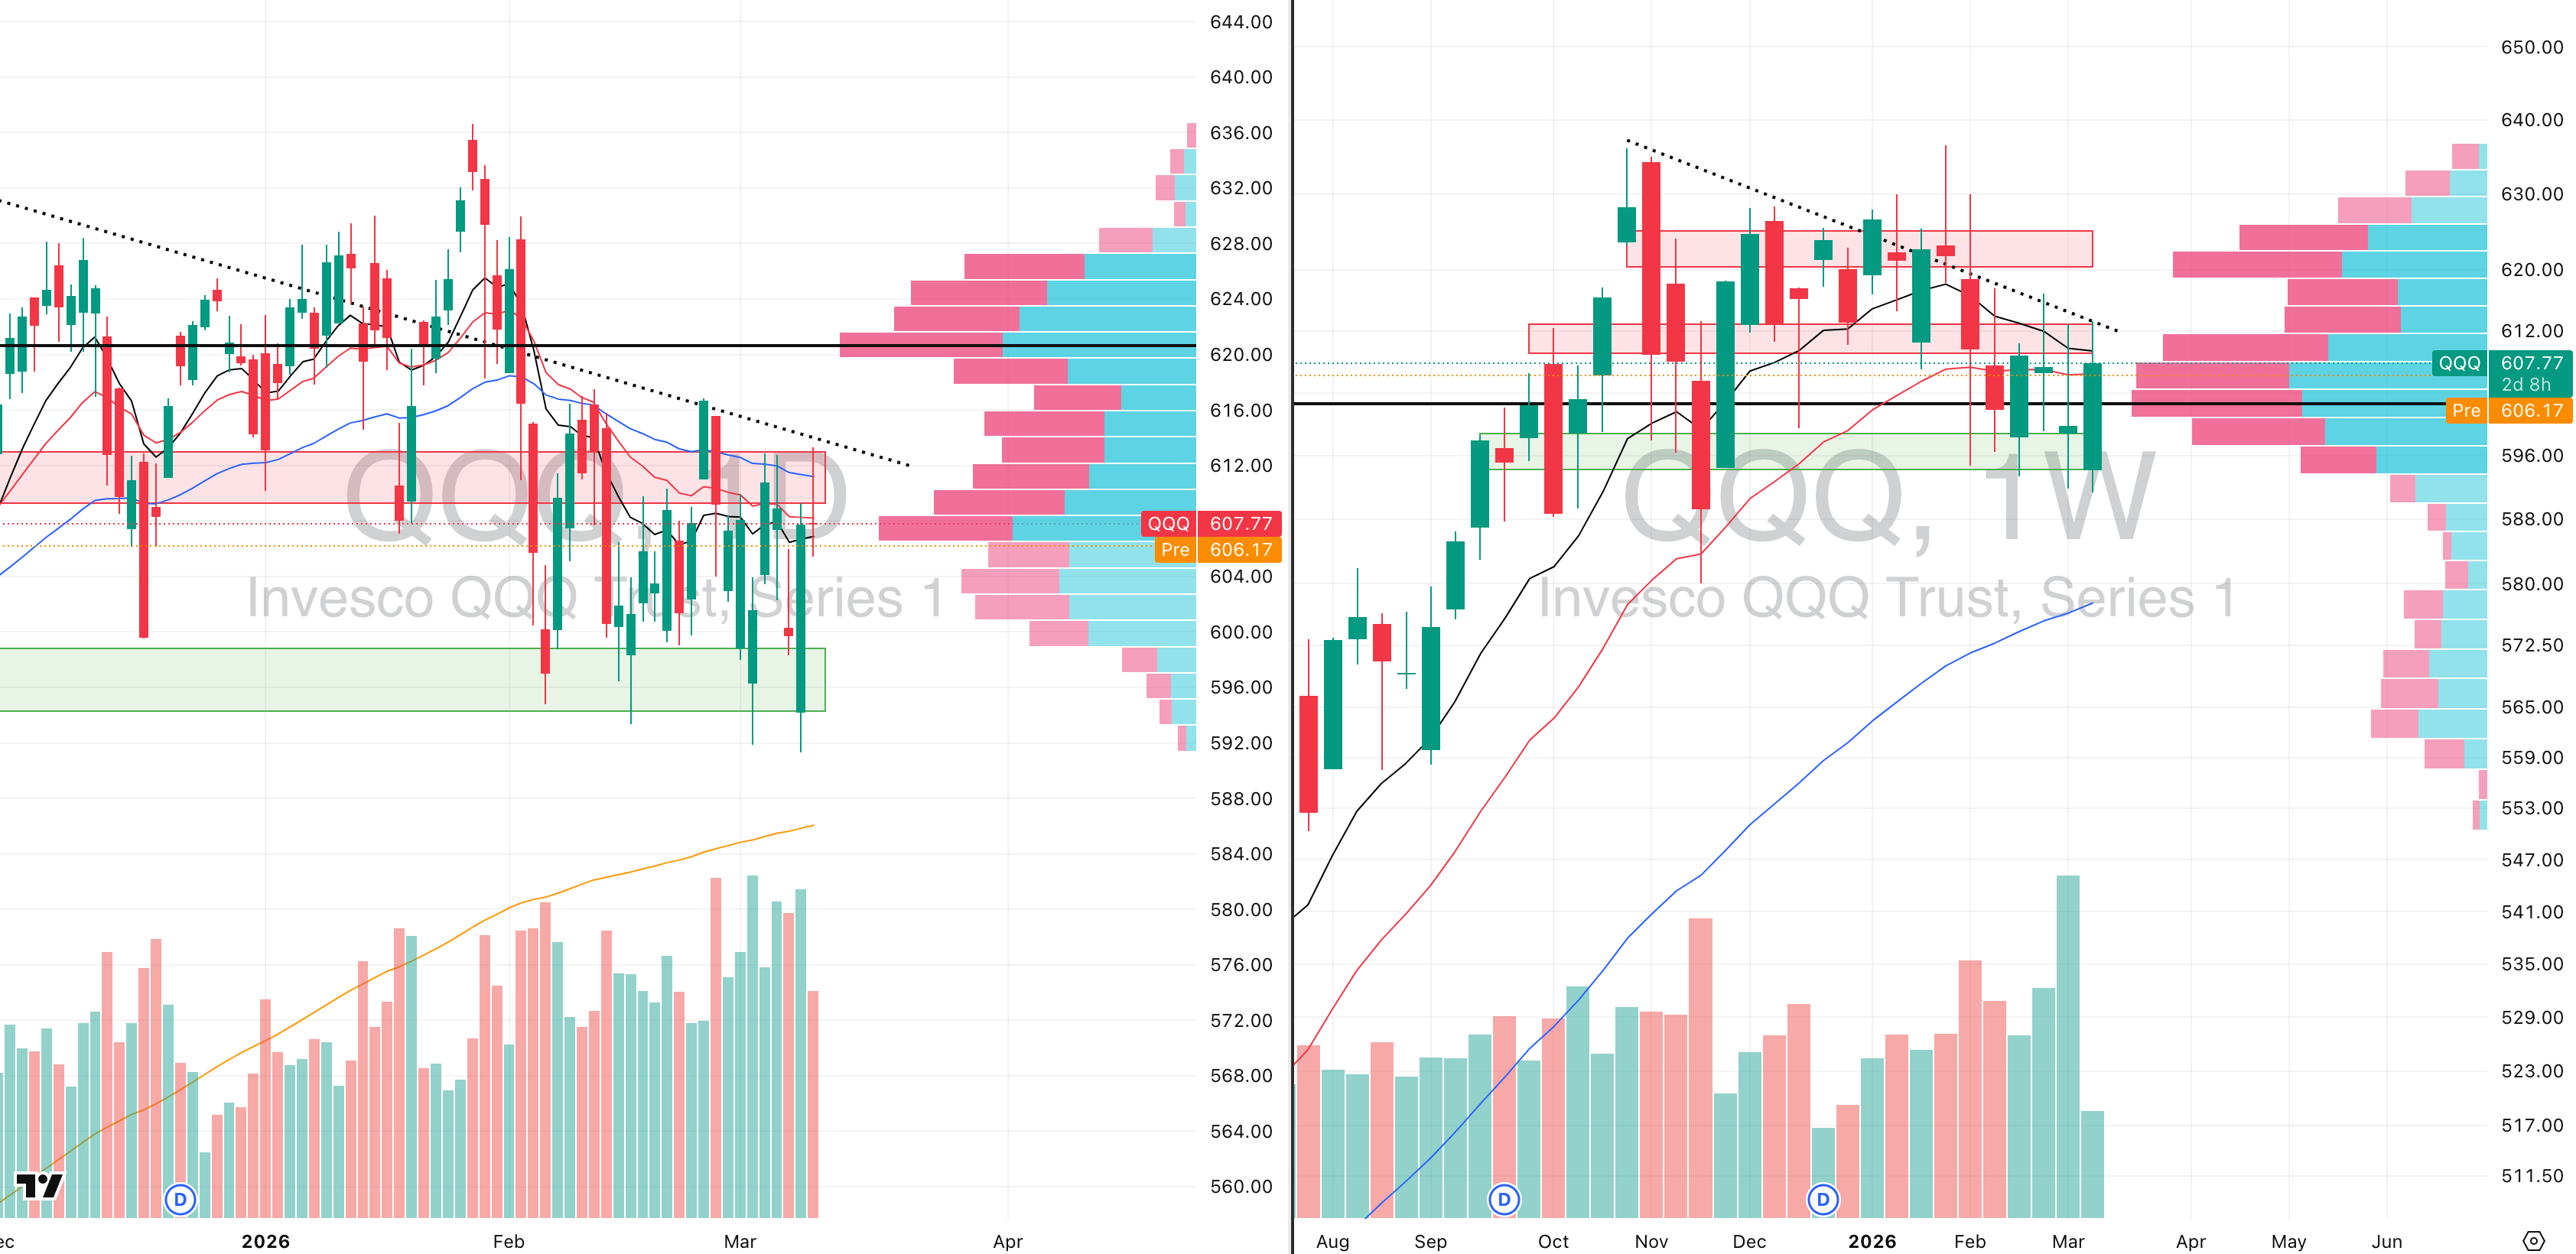
QQQ VRVP Daily & Weekly Chart
42.57%: over 20 EMA | 40.59%: over 50 EMA | 46.53%: over 200 EMA
The QQQ delivered exactly the type of rejection we needed to watch for once price pushed back into the declining 10-week moving average, with yesterday’s failure occurring directly at the $613 resistance zone on the same descending ceiling that has now been firmly established since the broader distribution phase began back in October / November 2025.
That level matters because it is no longer just a moving-average rejection. It is now a multi-month descending resistance line that has repeatedly capped every meaningful rally attempt, which means every test into it naturally carries a high probability of supply appearing.
Relative volume on the full session finished at 103% of the 20-day average, but the more important signal came intraday: at the exact point where price pushed into resistance and reversed, participation was only running at roughly 55% relative volume, which is extremely weak for a move trying to reclaim such an important technical level.
That low-volume rally was the clearest sign the upside move lacked sponsorship. In markets like this, when price pushes into major resistance without volume expanding, the probability of failure rises sharply because buyers simply do not have enough force to absorb overhead supply.
The visible range volume profile confirmed that overhead supply was already heavy. Around $613, you have roughly 4.77 million shares traded green versus nearly 7 million shares traded red, which tells you sellers were already waiting at that level and immediately stepped in once price arrived there.
That imbalance is important because it confirms that this was rejection directly into a zone where trapped supply has already built up over multiple sessions.
From here, our base expectation remains a move back toward $600, which is the same demand area the QQQ has been defending since early February. That implies roughly 1.6% downside, and structurally that would still keep price inside the broader short-term range rather than changing the larger picture.
S&P 400 Midcap

MDY VRVP Daily & Weekly Chart
21.25%: over 20 EMA | 32.00%: over 50 EMA | 51.75%: over 200 EMA
The MDY also behaved exactly as expected, rejecting directly into the declining 50-day moving average, which also aligned with the declining 10-week moving average and the same area we highlighted as the most likely ceiling for any short-term bounce.
Price did manage to fully fill the upside gap left open from Friday’s sharp downside move, but that fill immediately exhausted itself, and the session finished as a gravestone doji, which is one of the clearest candlestick signals of intraday rejection.
The significance of that candle is simple: buyers managed to push price higher, but by the close sellers had fully absorbed the move and forced price back down.
Intraday volume again told the story early. The rally itself came on very light participation, which immediately suggested that the upside lacked real sponsorship and that the move was more likely to fade than expand.
From here, our base expectation remains a move back toward Monday’s lows near $610, which would continue the natural pullback toward the rising 200-day moving average, the level MDY increasingly appears to be tracking.
That matters because the midcaps remain one of the weakest major segments from a breadth standpoint. Even after the bounce, they continue showing some of the poorest participation internally, which means every rally is still vulnerable unless price can first build genuine tightness.
The key focus now is not higher highs but it is whether MDY can eventually stop producing immediate rejection candles and begin forming acceptance above support.
Russell 2000
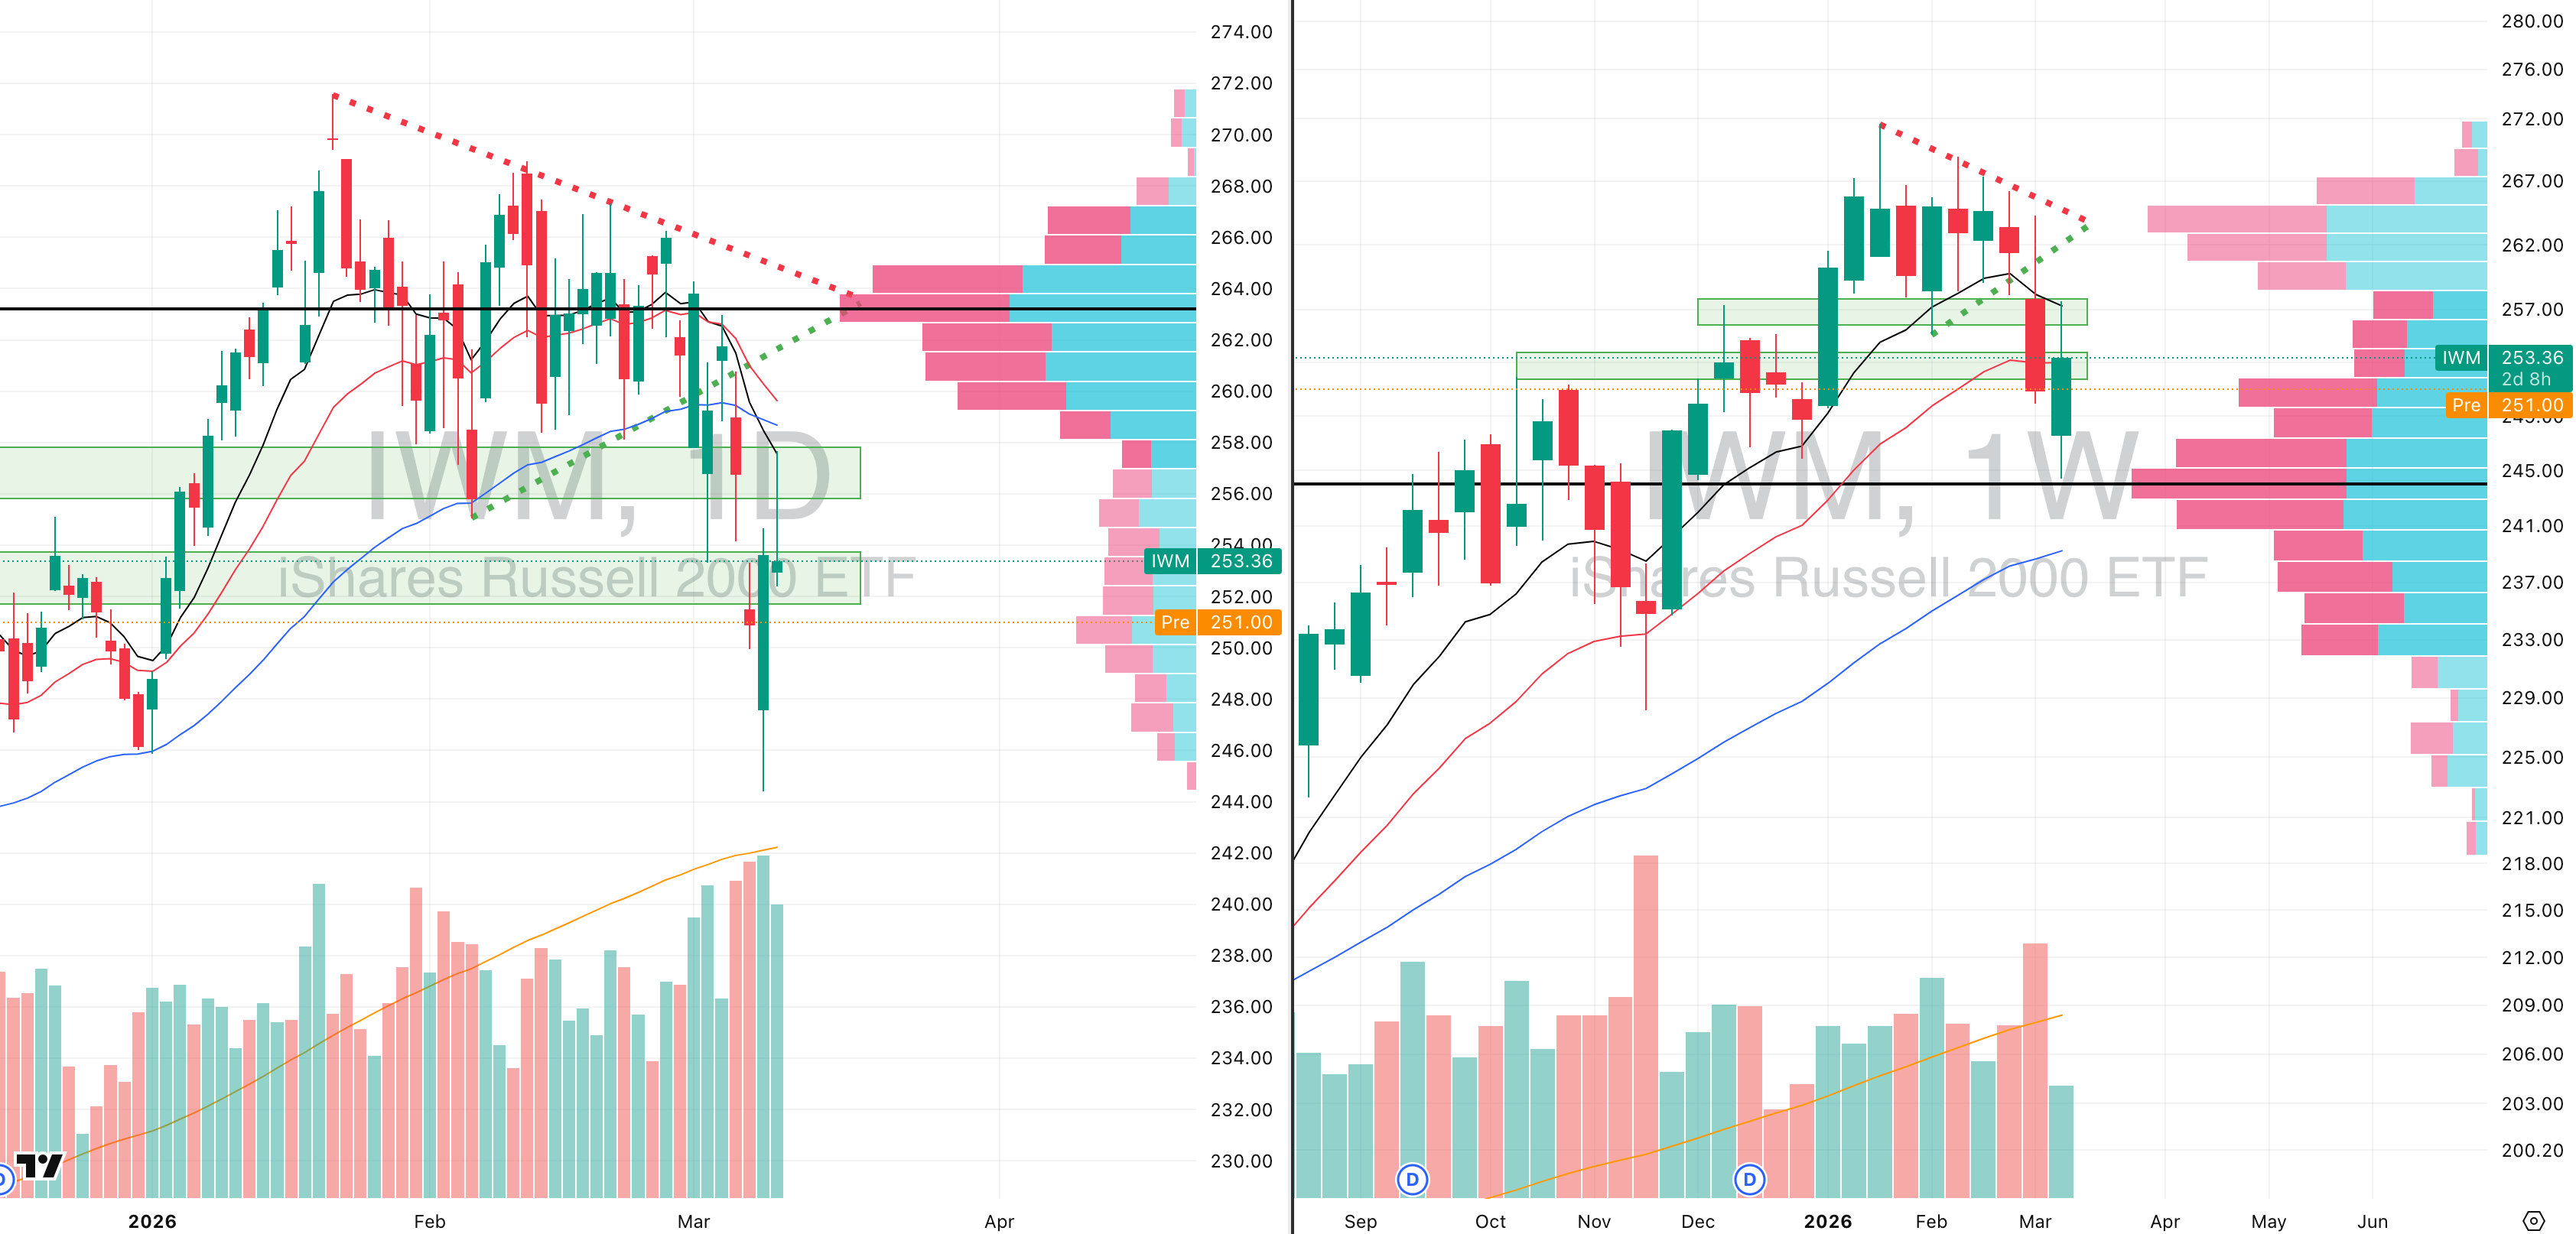
IWM VRVP Daily & Weekly Chart
30.50%: over 20 EMA | 35.61%: over 50 EMA | 52.81%: over 200 EMA
The small caps showed almost identical behavior to the midcaps, with price rejecting directly at the declining 10-day EMA and declining 10-week EMA, which continues to define the short-term ceiling for the Russell complex.
Just like MDY, the intraday rally came on very weak participation, which again made the failure highly predictable once price pushed into overhead supply.
The important technical feature developing now is that both the IWM and MDY are beginning to resemble a potential head-and-shoulders top, with the current failed bounce increasingly looking like the right shoulder of that broader formation.
That does not confirm breakdown yet, but it does materially increase the importance of Monday’s lows.
For IWM specifically, our base expectation remains a retest of $244, which would imply roughly 3.6% downside from current levels.
That move would fit the broader character of the Russell right now: weaker breadth, weaker participation, and repeated inability to hold short-term upside attempts.
Small caps remain highly sensitive to any macro pressure because they lack the relative strength currently being seen in select Nasdaq growth names.
FOCUSED STOCK
NBIS: NVDA’s New Cloud Investment
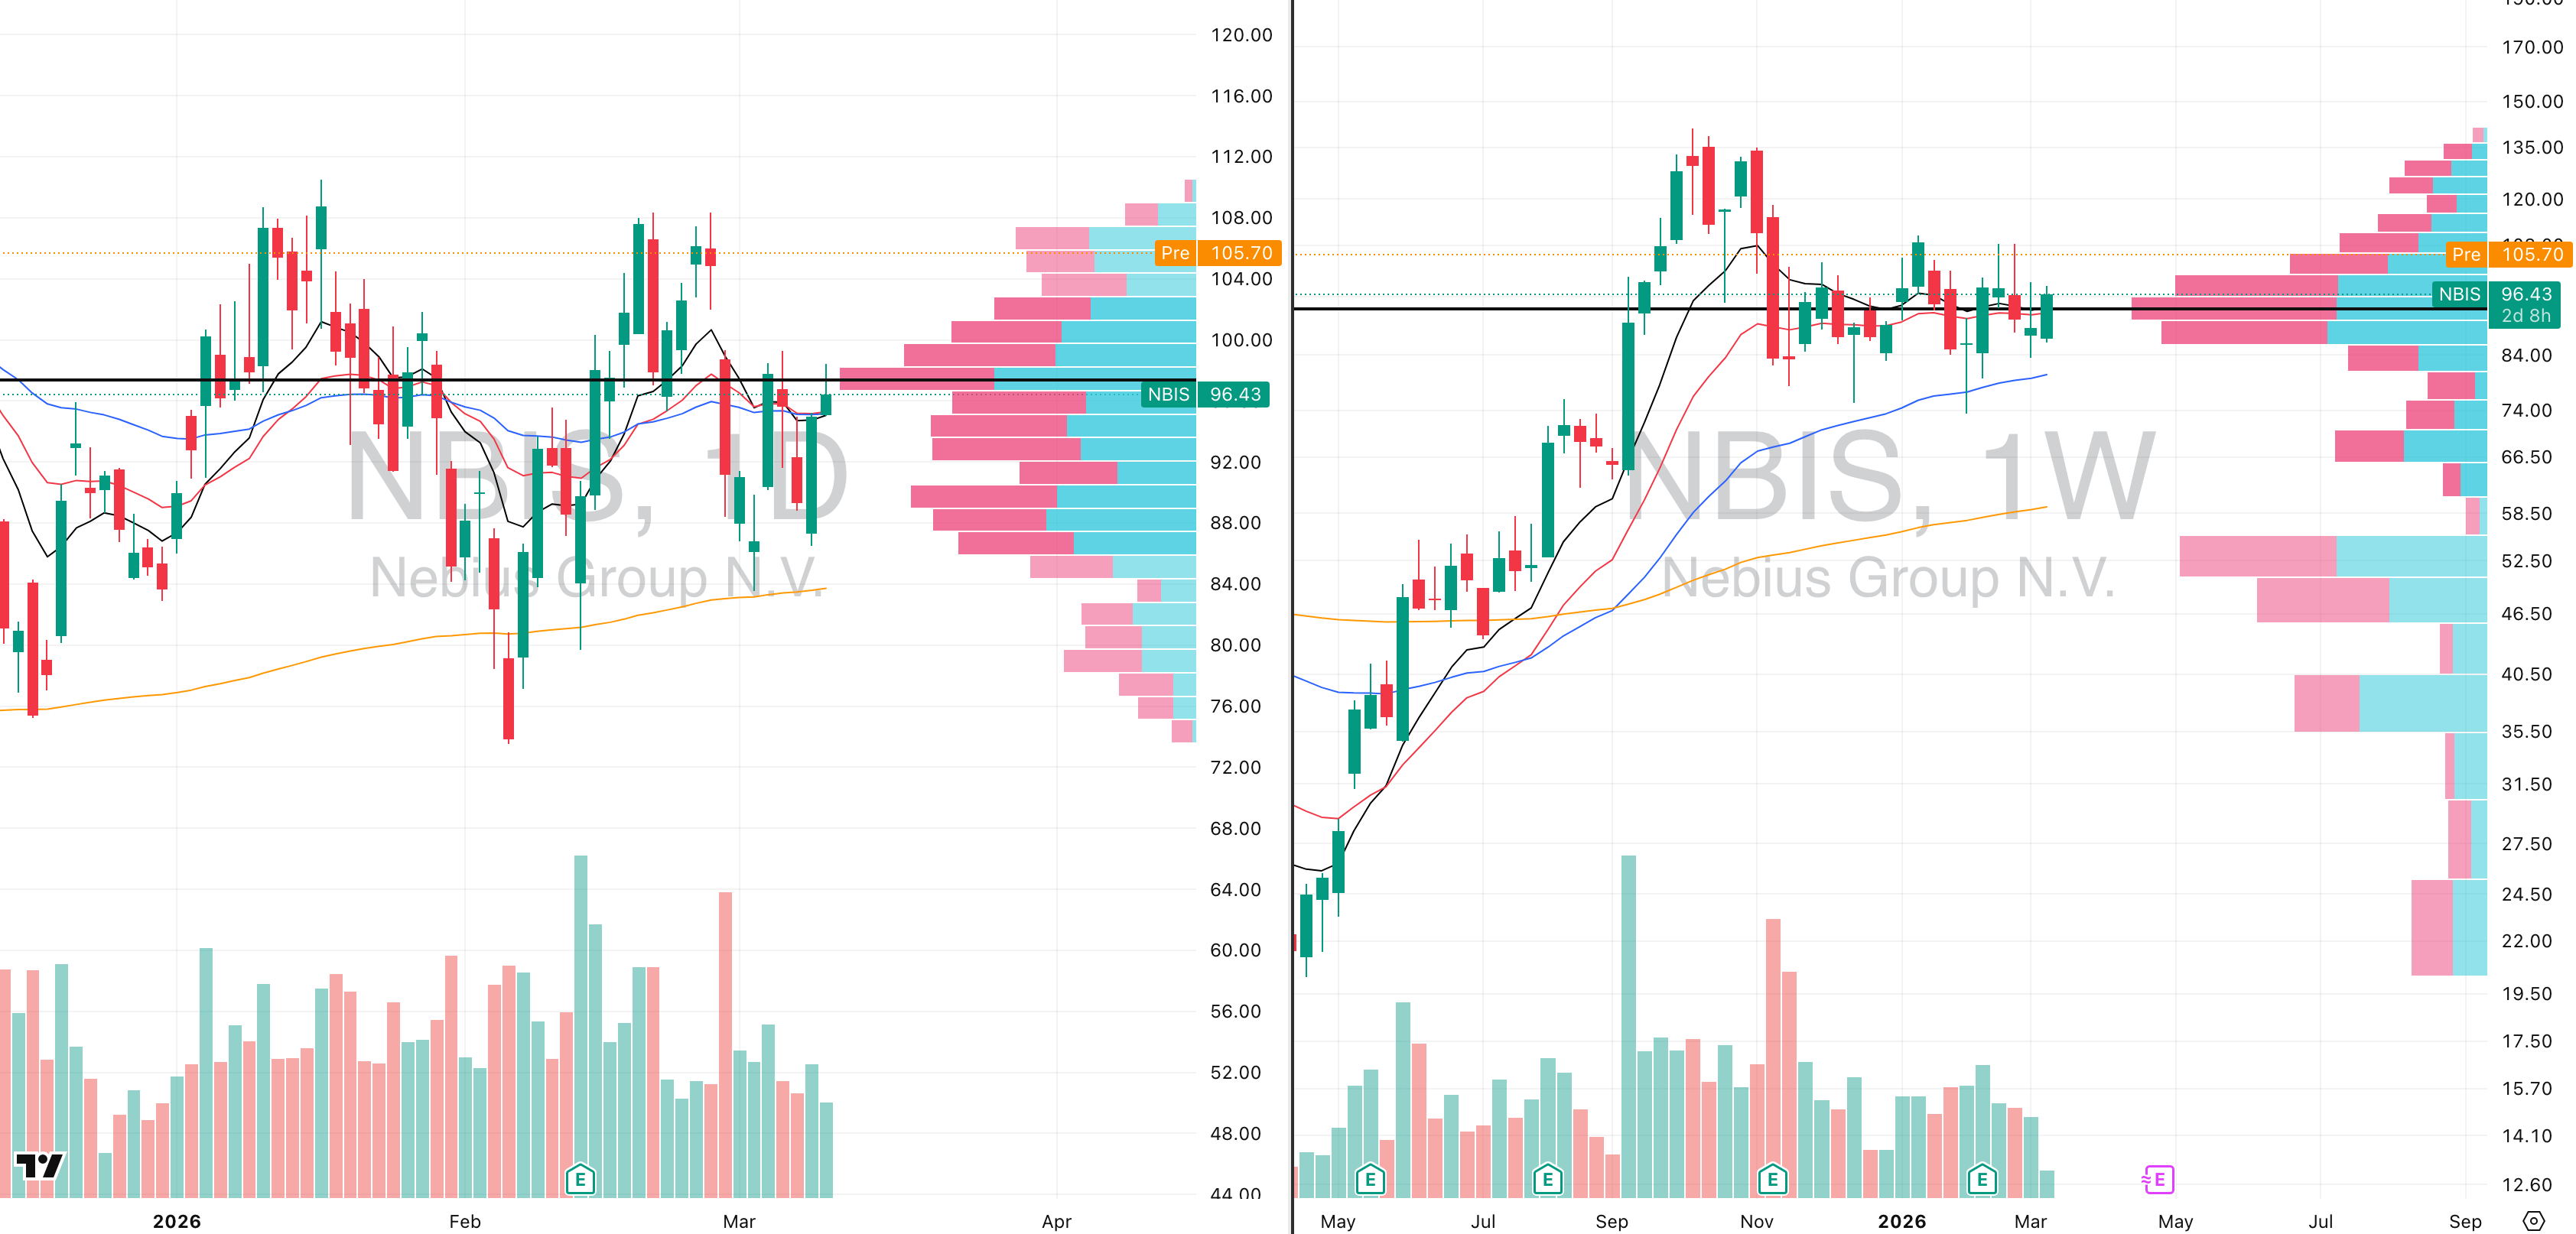
NBIS VRVP Daily & Weekly Chart
ADR%: 7.96% | Off 52-week high: -31.7% | Above 52-week low: +426.7%
NVIDIA Corporation announcing a $2 billion strategic investment into Nebius is a major fundamental catalyst because it immediately reinforces Nebius as one of the few smaller-cap AI infrastructure names now directly tied into Nvidia’s expanding global cloud buildout.
The partnership gives Nebius early access to Nvidia’s newest AI compute stack while both companies work together on hyperscale AI data-center deployment, which materially strengthens the long-term institutional narrative around the stock.
Technically, the important point is that NBIS was already behaving exceptionally well before the news arrived, which is exactly what you want to see in a true leading stock.
The chart is sitting in a very clean Stage 2 base, showing tight price action, controlled weekly closes, and almost no evidence of aggressive distribution despite broader market volatility.
The stock is holding almost perfectly above both the rising 50-week moving average and the rising 200-day EMA, with both major support levels now clustered near $84.
That matters because when a stock repeatedly respects two rising higher-timeframe moving averages during a market correction, it usually signals that institutions are still accumulating rather than distributing.
Relative strength here is extremely notable. While much of growth has been volatile and erratic, NBIS has continued to hold structure, which tells you money is staying in the name rather than rotating out. In practical terms, that is often what leadership looks like before a larger directional move develops.
Premarket the stock is gapping higher on the Nvidia headline, but we would be very cautious chasing an opening breakout here. In this type of market, news gaps often create emotional first moves that quickly retrace once early momentum fades.
The cleaner approach would be to let the opening range develop and, if the gap begins to fade, potentially look for a short-duration intraday short to fill part of that gap, rather than buying immediate strength.
For actual swing exposure, the much higher-quality entry remains lower ideally if price rotates back closer toward the $84 support zone, where the 200-day EMA and 50-week moving average continue rising underneath price. That restores asymmetry and allows risk to be defined properly.
FOCUSED GROUP
X
X

Did you find value in today's publication?This helps us better design our content for our readers |
Reply