- Swingly
- Posts
- Expect Another Sell off This Week
Expect Another Sell off This Week

MARKET ANALYSIS
Here’s All You Need To Know

Markets are starting the week back in risk-off mode after the weekend talks between Washington and Tehran ended without a deal and the U.S. moved toward a blockade tied to Iranian port traffic.
Equity futures are lower, oil is back above $100, and the market is being forced to reprice the ceasefire optimism that drove last week’s rally.
The key issue is that the market is now back to trading the Strait of Hormuz first, everything else second. Brent and WTI both jumped roughly 7% intraday after the blockade announcement, taking crude back above $100 and reversing a meaningful part of the post-ceasefire relief move.
What makes today’s reaction notable is that it is serious, but not disorderly. Futures are weaker, yields are a touch higher, and the dollar is firmer, yet markets are not breaking and that tells you investors had already treated a full weekend breakthrough as a long shot, so this is a reset in expectations rather than a panic repricing.
The bigger macro problem is unchanged as once oil is back above $100, the market immediately has to think again about higher inflation, slower growth, and less room for central banks to ease.
Reuters reported that traders are now leaning back toward tighter policy expectations, while last week’s U.S. inflation data had already shown the strongest consumer-price increase in nearly four years, driven largely by gasoline.
The longer the Strait remains constrained, the more this shifts from a war headline into a broader energy-shock macro regime, where oil, gas, shipping, and inflation all start feeding back into equity multiples and earnings expectations.
Earnings season is now arriving into that backdrop and Goldman Sachs beat on headline earnings and revenue, but the market still marked the stock lower because fixed-income trading disappointed. That is a useful reminder that in the current tape, “good enough” numbers are not always enough when macro stress is still elevated.
The other thing worth watching is leadership as semiconductors and AI infrastructure are still holding up better than you would normally expect in a tape like this, with TSMC still on track for another record quarter on AI demand. That does not override oil, but it does suggest there is still a real growth bid underneath the surface if macro pressure starts easing again.
Last week’s relief rally was built on the idea that a path to de-escalation existed. Today, the market is being reminded that the path is still there, but it is far less certain than bulls wanted to believe.
As long as crude stays above $100, equities remain vulnerable to another round of multiple compression and headline-driven reversals.
S&P 500

SPY VRVP Daily & Weekly Chart
66.13%: over 20 EMA | 43.42%: over 50 EMA | 53.18%: over 200 EMA
Last week was, in reality, a technology-led rally, with XLK bouncing directly off the rising 50-week EMA and its 20-month EMA, which in turn helped drag the SPY higher given how heavily the index is weighted toward growth and large-cap tech.
The issue remains the same: the rally was not supported by convincing participation.
Friday’s session came in at only 47% relative volume, which is exceptionally low, and total weekly relative volume was only 92%, despite the SPY posting a 5.46% weekly range.
That weekly move is statistically significant because it was almost 2x the normal weekly average range of 2.65%, yet it still failed to attract the kind of strong participation you would normally want to see if the market were truly beginning a durable new leg higher.
That is important because low-volume rallies into supply are inherently fragile and when price pushes higher without strong volume sponsorship, it often means there is not enough fuel to properly clear overhead resistance, and it then takes only a modest wave of renewed selling pressure to push the market back lower.
That does not necessarily mean the rally had no directional validity, but it does mean conviction behind it was weak.
Our base case remains that the SPY fills the remaining gap left between last Tuesday and Wednesday, which implies roughly -1.96% downside from current levels.
From our perspective, that move is highly likely to begin unfolding this week.
The semiconductor and AI complex did help drive the bounce, but beneath that surface strength the broader index still looks like it is rallying on relatively low conviction.
S&P 400 Midcap

MDY VRVP Daily & Weekly Chart
76.25%: over 20 EMA | 51.75%: over 50 EMA | 57.25%: over 200 EMA
Mid-caps look more vulnerable here, and in our view they are now in a much more dangerous technical position.
They showed the same low-volume relief rally last week, but at the time of writing they are already beginning to break down below the three-day gap-up lows and are trading back below $640.
That matters because the next major reference is a much larger open gap down to the Tuesday highs near $629, which implies around -2.21% downside from Friday’s close.
Whether that gap fills fully or not, this zone needs to be watched very closely.
If buyers do step in at the open and MDY manages to reclaim that low-volume pocket quickly, that would be important evidence that real demand is starting to absorb supply.
Right now, however, that outcome looks unlikely.
Friday’s daily relative volume was only 61%, and weekly relative volume came in at 98%, which is simply not strong enough to argue that last week was a high-conviction bullish reversal.
From our perspective, the move still looks much more like a low-volume bear market rally than genuine trend repair.
That is why short setups into these higher gap-up levels continue to make the most sense (especially with such an elevated breadth already).
Russell 2000
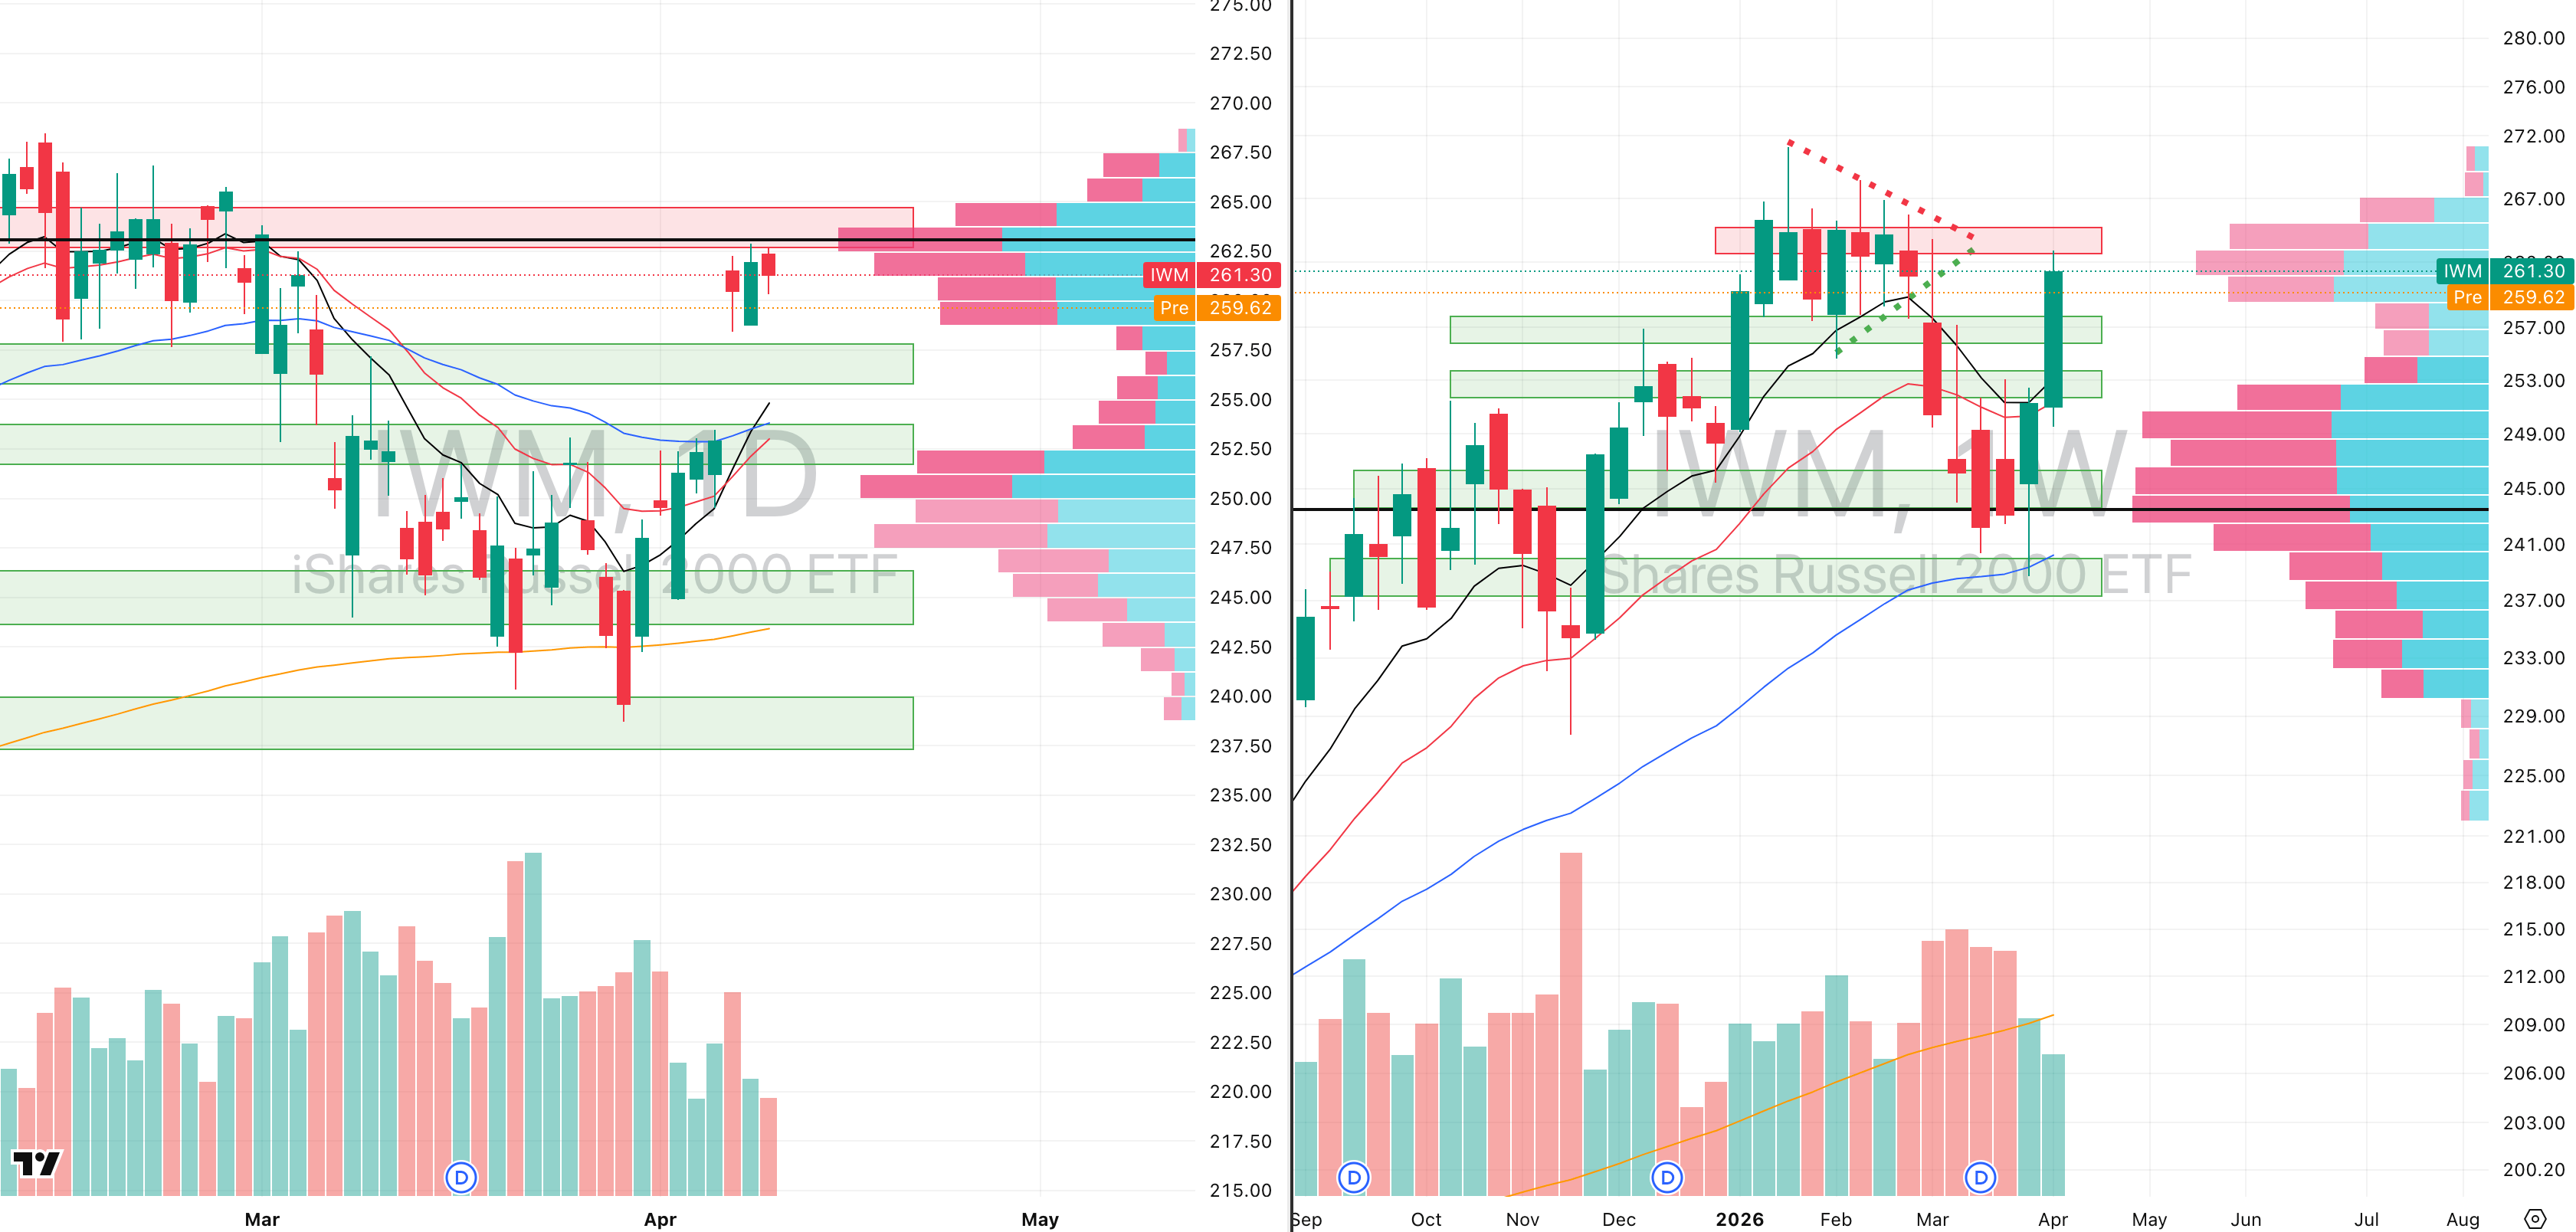
IWM VRVP Daily & Weekly Chart
72.28%: over 20 EMA | 55.48%: over 50 EMA | 56.47%: over 200 EMA
Small caps are also gapping lower this morning, but the damage is less immediate than what we are seeing in MDY.
The IWM is still holding above the prior gap-up lows near $258.41, which is at least keeping the structure slightly firmer than the mid-caps for now.
Even so, the visible range volume profile still shows a very dense overhead supply pocket around $262, which is the level that rejected price on both Thursday and Friday.
That zone is important here because it was a major distribution area for roughly 49 days between January and March 2026, before the stage 4 markdown phase began.
FOCUSED GROUP
BOAT: The Shipping & Oil Story

BOAT VRVP Daily & Weekly Chart
BOAT is pulling back directly into its 20-day EMA near $40.49, which is the first level we are watching very closely on this retracement.
The reason we are calling BOAT out specifically is because its structure is currently moving with an unusually tight correlation to crude oil, and visually the two charts are almost mirroring each other.

WTI VRVP Daily & Weekly Chart
That correlation is not accidental. Shipping equities respond aggressively to changes in energy markets because freight pricing, tanker utilisation, shipping route disruption, and insurance costs all immediately reprice when oil volatility expands.
In periods where oil surges because of geopolitical disruption, shipping names often initially strengthen because freight markets begin pricing tighter route availability, rerouting pressure, and higher transport premiums.
That is exactly why BOAT accelerated so sharply while crude oil exploded higher over recent weeks.
What matters now is that both BOAT and WTI are entering their first meaningful pullback at the same time.
If BOAT fails to hold this 20-day EMA today, while relative volume begins to expand on the downside and crude oil also starts retracing more decisively, then the probability rises that BOAT trades lower into its next major support cluster.
That downside target sits near the rising 50-day EMA / 10-week EMA around $39, which implies roughly a -5.24% move from current levels.

Did you find value in today's publication?This helps us better design our content for our readers |
Reply