- Swingly
- Posts
- Everything’s Holding—Except Breadth
Everything’s Holding—Except Breadth
In partnership with
OVERVIEW
Tactically Cautious, Selectively Bullish
Breadth Breakdown, Leadership Thin: Indexes are holding above key levels, but most stocks aren’t. Volume favors the downside. Follow strength only where it’s proving itself.
Post-Earnings Fades = Warning Shot: Strong reports are still getting sold. That’s not random—it’s rotation. QQQ failed at its 10EMA, IWM bounced on weak volume. Don’t get cute.
Gold Miners Flashing Real Strength: GDX ripped through resistance on high volume. It’s not just defensive—it’s flow-based. Follow the money.
What to Watch Today:
Can QQQ reclaim $567 with real volume? If not—expect more chop, failed breakouts, and capital rotation out of crowded tech.
Big Insight:
This environment punishes over-trading. Your edge isn’t in predicting the next move—it’s in reacting with discipline when price confirms.
Strong stocks in weak markets are your tell.

MARKET ANALYSIS
The Chop Continues

Earnings are booming. Price action is breaking down. That disconnect is your real signal.
We’re deep into August—the month that breaks more traders than it makes.
Good news? It gets sold.
Bad news? Shrugged off.
Clean setups? Fading on volume.
This is classic late-cycle chop. The kind that punishes both bulls and bears while rewarding only those disciplined enough to sit tight or get tactical.
The Surface Narrative Is Bullish… But Useless
82% of S&P 500 companies have beaten earnings estimates.
Q2 EPS growth is tracking +11.2% YoY.
Forward guidance revisions are at 3-year highs.
Sounds great—until you look at what actually happened to those stocks.
NVDA, PLTR, MSFT? Fine.
Everything else? Fading even on beats
This isn’t about fundamentals anymore. It’s about positioning and exhaustion.
Under the Hood: Cracks Are Spreading
SPY has gone 3 months without a meaningful pullback.
Failed breakouts are stacking up across sectors—especially in software, technology and other growth segments.
Reversals are accelerating, not stabilizing.
And now macro is joining the party:
Jobs miss: July NFP at +73k vs expectations of 175k.
Back revisions: Prior months slashed quietly.
ISM Services: Skating the contraction line at 50.2.
Consumer data: Slowing. Quietly but clearly.
Tariffs + fiscal tightening: Creeping in beneath the headlines.
Translation? Institutions are trimming exposure. Holding AI winners, reducing the rest.
What Smart Money Is Doing Now
Scaling down risk—especially in overextended areas
Rotating defensively into cash-rich balance sheets and low-beta sectors
Waiting for breadth to stabilize before committing capital
They’re not guessing—they’re reacting to clear divergence between index levels and average stock behavior.
The market is no longer confirming its own rally.
How to Trade This Environment
Don’t chase breakouts. Most are failing on low conviction.
Watch the reaction, not the report. Good earnings that fade = red flag.
Prioritize relative strength. Names holding above rising 20/50EMAs with low volatility are your edge.
Track volume. Continuation without volume = headfake risk.
If you’re not seeing clean follow-through within 30 minutes of the open, step aside. This isn’t the time to force it.
The Game Plan
Expect this range-bound, headline-fading market to persist through August.
Treat every breakout attempt like a liar on a first date—make them prove it with volume and follow-through.
Build your watchlist now.
The names showing strength today are the ones that’ll lead when the next leg higher begins.
Nasdaq
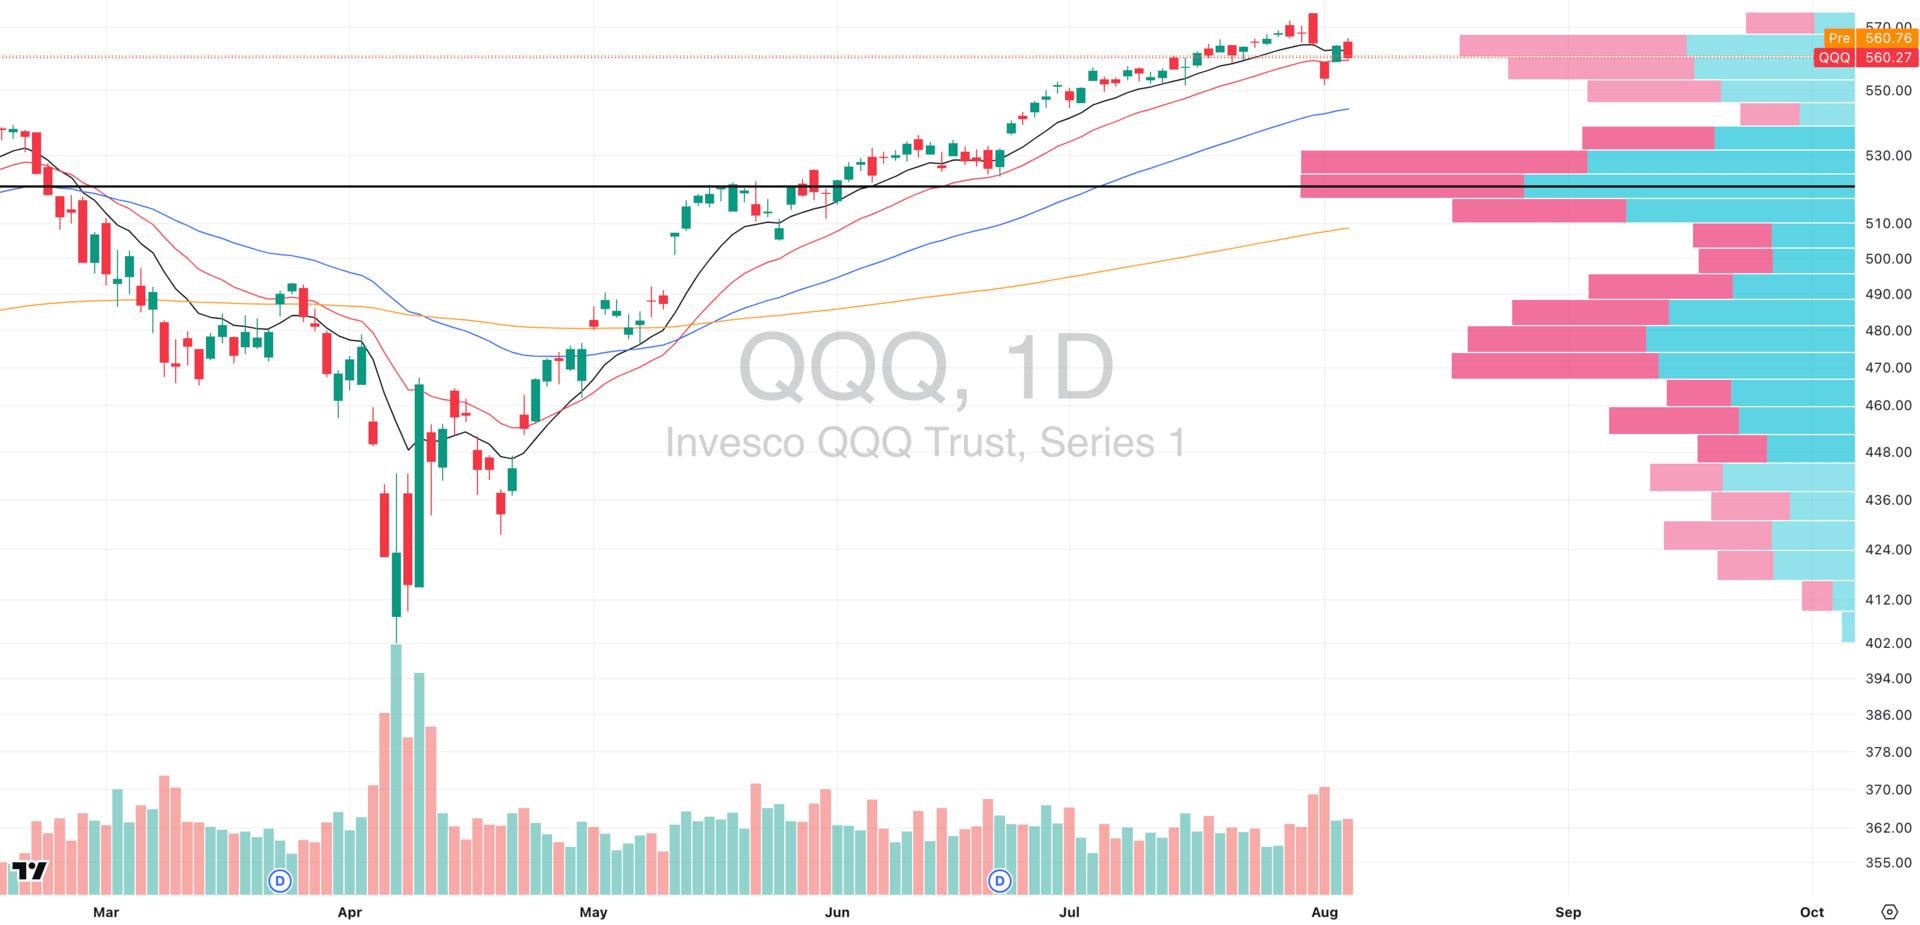
QQQ VRVP Daily Chart
Structure: Failed breakout → Back under 10EMA → Supply zone rejection
Monday’s bounce was textbook bait: a clean gap fill from Friday’s breakdown, followed by a sharp rejection right at the rising 10EMA (~$563).
That level also aligns with a dense supply shelf visible on the Visible Range Volume Profile (VRVP)—which makes the rejection anything but random.
This isn't a dip to buy. It's a test of resistance that's already failed once.
Key Level: $567 = battle zone
That’s where sellers keep showing up. It’s not just the 10EMA—it’s also the volume shelf from early July consolidation and the tail end of the all-time high zone. Every test so far has triggered selling.
Volume Story:
What matters here isn’t just price—it’s who’s showing up.
Last week's breakdown days printed much higher relative volume than Monday or Tuesday’s bounce attempts. That tells you everything:
➡️ Price chose direction (down)
➡️ Volume confirmed it (heavy selling on red bars)
➡️ Low-volume bounces = no fuel = dead cat risk
And check the VRVP bars: most of the volume above current levels is red, not green. That means sellers were in control at those prices—any push higher runs into trapped longs or reloading shorts.
Trading Edge:
Don’t buy the first bounce.
Don’t trust early green candles.
If QQQ fails to hold here with volume, expect a retest of $540–$545, where volume support actually exists (and the 50 day EMA + 10 week EMA sit).
The only thing keeping QQQ afloat is its cap-weighted distortion. But even that has limits when breadth keeps rotting underneath.
S&P 400 Midcap
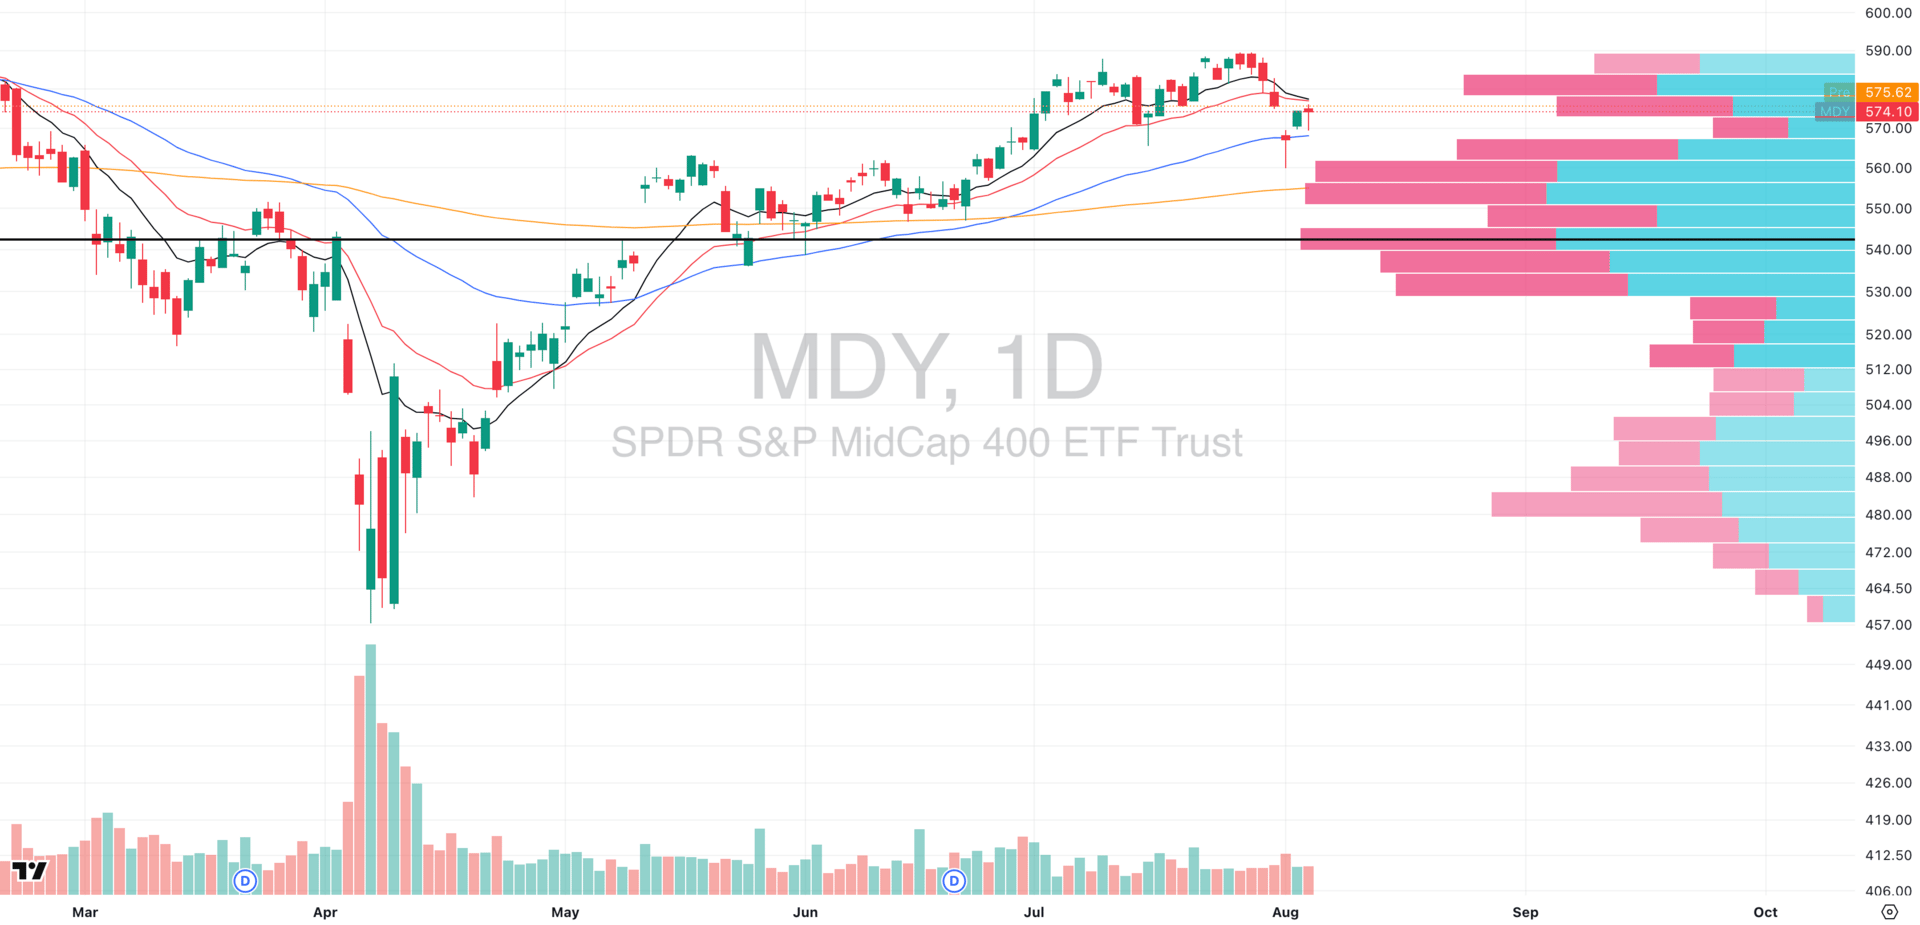
MDY VRVP Daily Chart
Structure: Support turned resistance | EMAs declining | Bounce = suspect
Midcaps just confirmed a clear character shift. The exact zone that acted as support for 4 straight weeks in late June–mid July is now acting as a hard ceiling.
Both the 10EMA and 20EMA (~$576) rejected price cleanly on Tuesday, and the Visible Range Volume Profile (VRVP) shows thick supply overhead.
Key Level: $576 = New Resistance
The breakdown through $576 was clean—and now that zone is repelling price.
This is classic market structure: what used to be demand is now supply. Until MDY reclaims this zone with strength, any bounce is on shaky ground.
Unlike QQQ, midcaps didn’t get crowded with such heavy long positions. That’s the only reason MDY didn’t crack harder. But don’t confuse less crowding with strength. Breadth is deteriorating across the board, and MDY is not immune to this.
Trading Edge:
Respect the 50EMA as a bounce zone—but don’t trust it unless we see follow-through volume.
If $568 fails, MDY likely moves to closer to the high-volume node at $540, where real support exists (if the 200 day EMA at $553 also fails).
This is not a place to size up. Any long exposure here must be tactical and tight.
Russell 2000
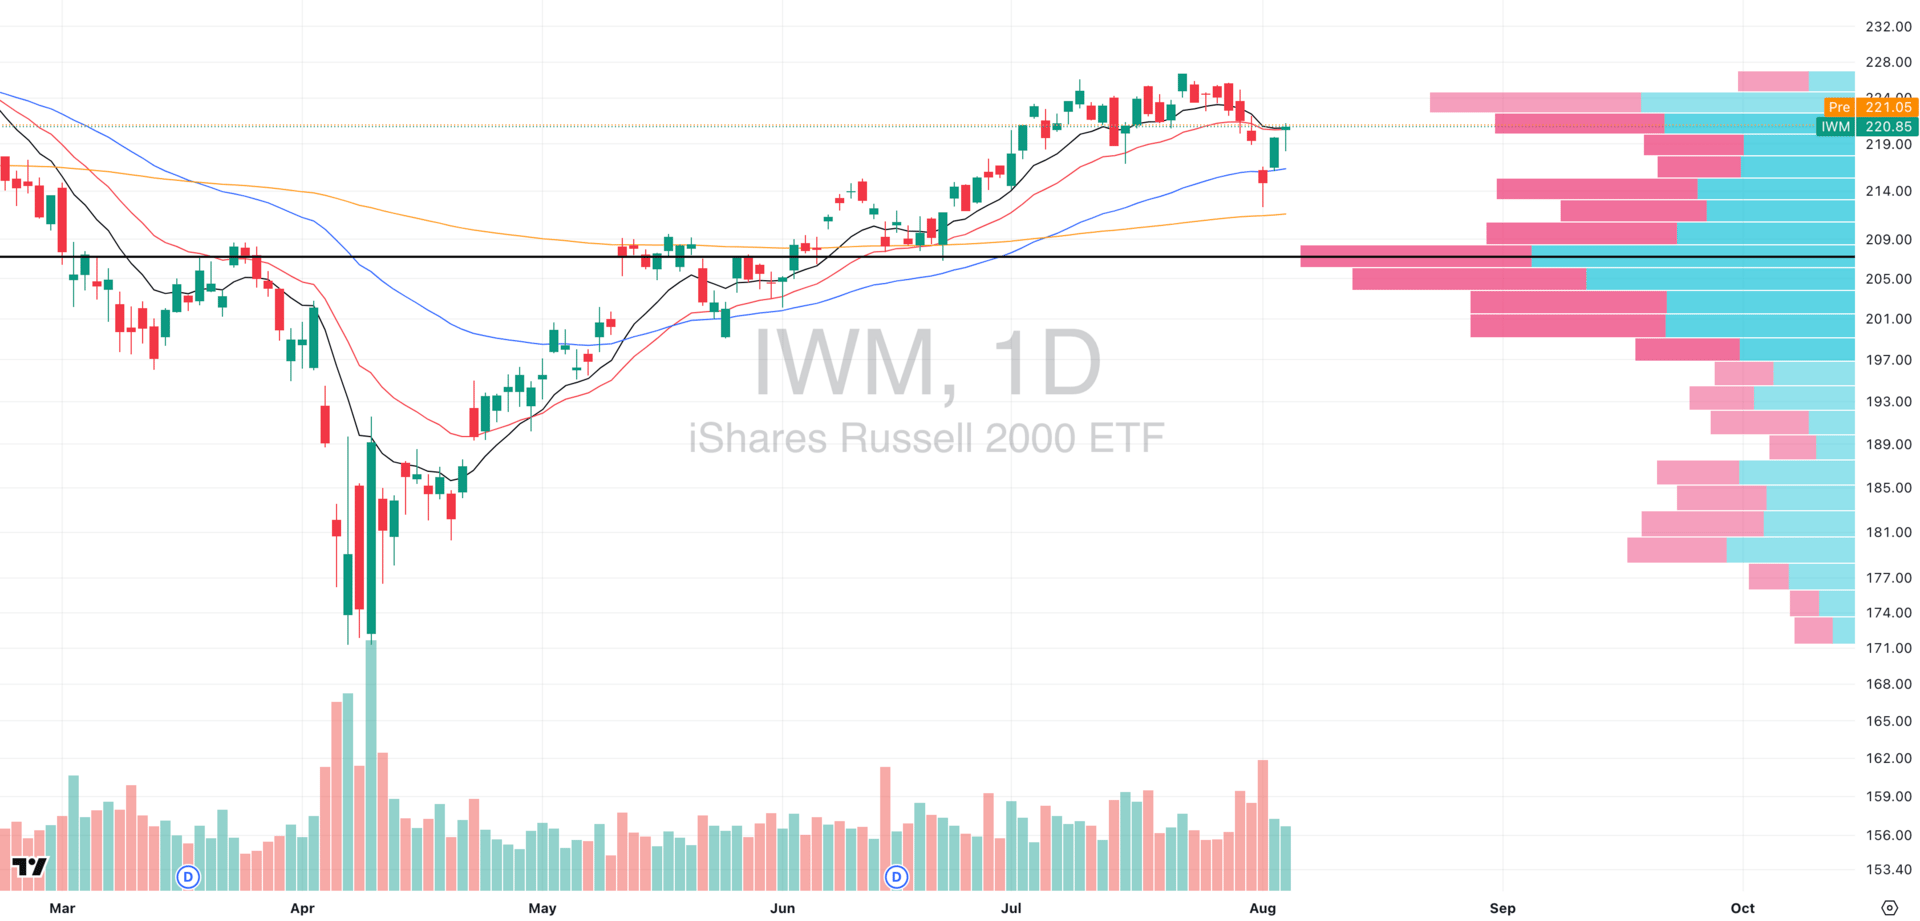
IWM VRVP Daily Chart
Structure: Heavy-volume breakdown → weak bounce → key test in progress
Small caps just gave us a textbook reality check. Last week’s breakdown printed the highest relative volume in nearly 5 months and that is typically institutions offloading risk.
Since then? We’ve seen a bounce attempt into the declining 10/20EMAs—but the volume on the rebound is noticeably lighter, suggesting this rally is still suspect.
Key Level: $222 = Decision Zone
That’s where the Volume Profile starts getting thick, and where the short-term moving averages are pressing down.
If IWM can clear this zone with expanding volume and follow-through, it opens the door to short-term upside—but that’s a big “if.”
Volume Story:
Breakdown: Massive participation, clear conviction selling
Bounce: Subdued interest, no aggressive buyers stepping in yet
Yes, Tuesday’s green hammer candle shows that demand exists—but it needs confirmation. Without it, this could easily become a lower high in a new downtrend.
🧠 Mindset Check: You Do Not Need to Trade Every Day
In fact, forcing it might be the single biggest leak in your P&L right now.
The Trap:
You wake up, scan your charts, and feel that itch:
“What am I trading today…?”
The market might be choppy, indecisive, or flat-out ugly.
But your brain’s already asking the wrong question.
Why This Feels Right:
We're wired for action. Doing something feels productive—even if it's actually destructive.
You get dopamine from placing a trade, not from sitting in cash.
And social media makes it worse—everyone else looks like they’re printing while you’re waiting.
What Better Traders Actually Do:
They only pull the trigger when their setup, structure, and timing all align.
No signal = no trade.
Think like a sniper—not a machine gunner.
They know:
Sideways markets destroy trend systems
Low-volume bounces are traps
Chop kills both longs and shorts
In environments like this, preserving capital is a win.
Your Tactical Edge This Week:
Pre-define your A+ setups
Find the stocks/groups refusing to breakdown when the market moves lower
Track how often they actually appear
If none show up? Do nothing.
Yes—literally nothing.
Cash is a position.
And this market? It’s punishing the overactive and rewarding the patient.
Former Zillow exec targets $1.3T market
The wealthiest companies tend to target the biggest markets. For example, NVIDIA skyrocketed nearly 200% higher in the last year with the $214B AI market’s tailwind.
That’s why investors are so excited about Pacaso.
Created by a former Zillow exec, Pacaso brings co-ownership to a $1.3 trillion real estate market. And by handing keys to 2,000+ happy homeowners, they’ve made $110M+ in gross profit to date. They even reserved the Nasdaq ticker PCSO.
No wonder the same VCs behind Uber, Venmo, and eBay also invested in Pacaso. And for just $2.90/share, you can join them as an early-stage Pacaso investor today.
Paid advertisement for Pacaso’s Regulation A offering. Read the offering circular at invest.pacaso.com. Reserving a ticker symbol is not a guarantee that the company will go public. Listing on the NASDAQ is subject to approvals.
FOCUSED STOCK
HOOD: A Relative Strength Leader
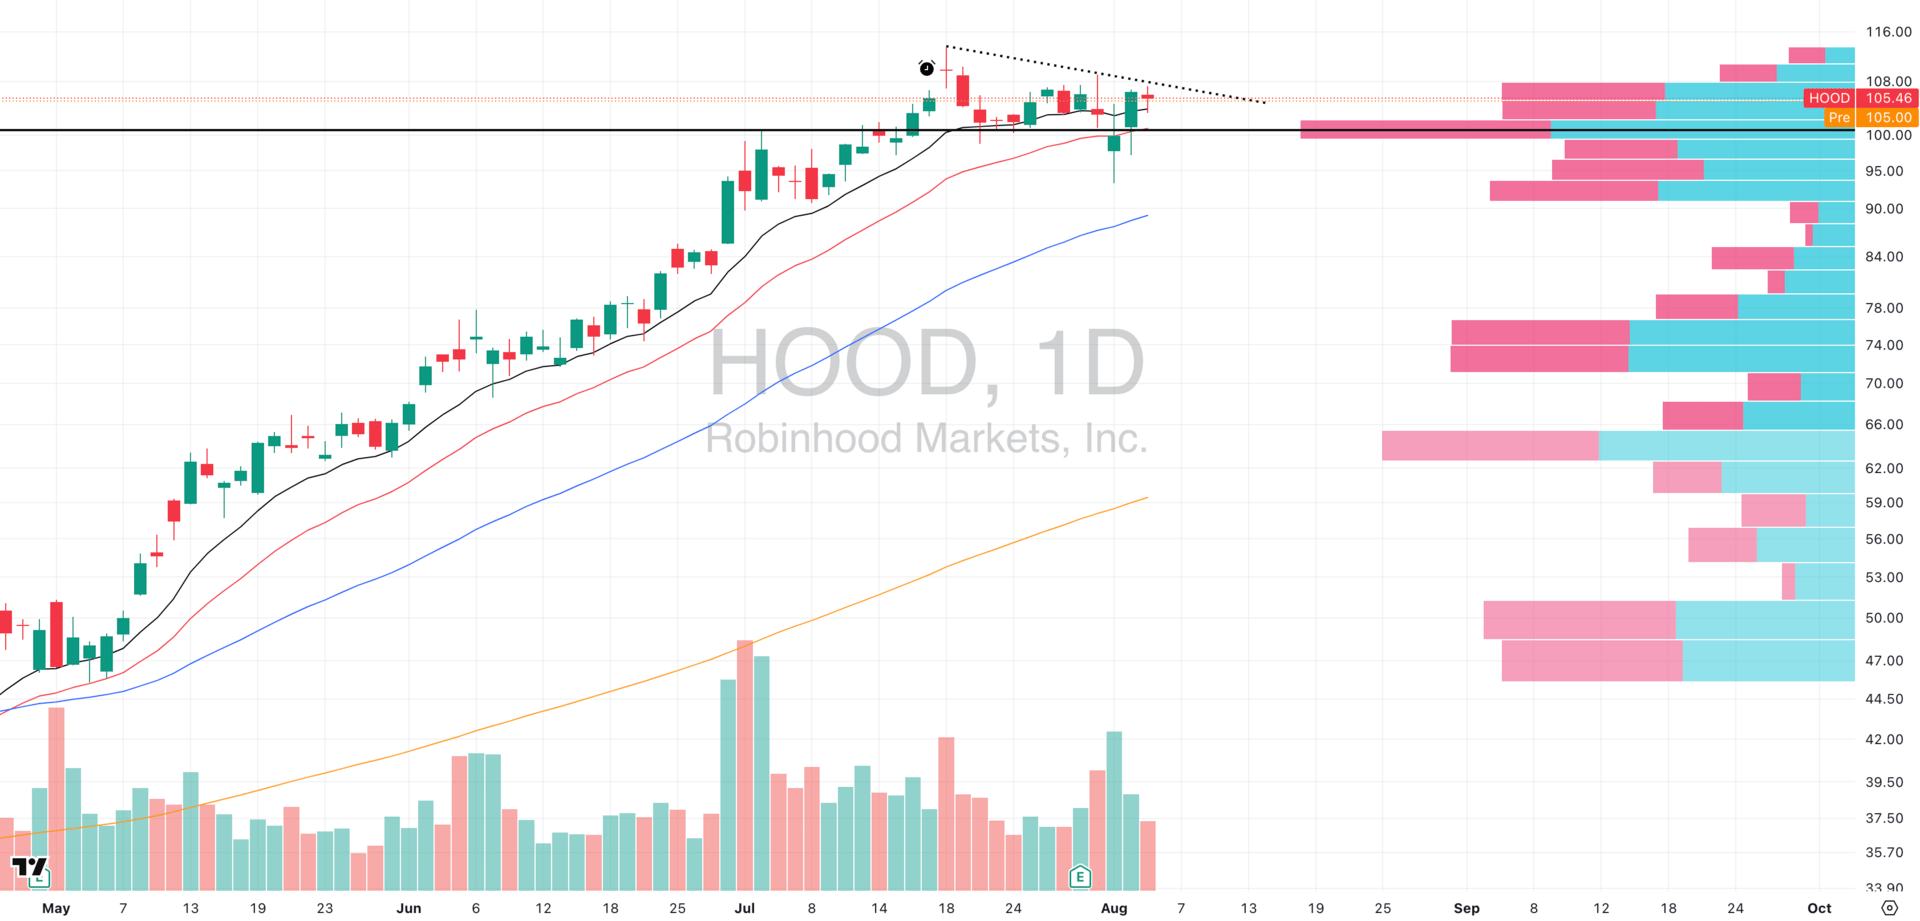
HOOD VRVP Daily Chart
Sector: Financial Tech | Market Cap: ~$94B
We’ve already nailed one strong swing in HOOD—booked gains ahead of earnings and sidestepped the risk. But what matters now isn’t what we did—it's what HOOD is still showing:
Textbook relative strength in a weak tape.
This isn’t just about HOOD the stock. It’s about HOOD as a case study in leadership behavior—what to keep on your radar when the market finally turns.
Technical Structure:
Post-earnings reclaim of Point of Control (POC) on high relative volume
Climbed back above the 10EMA and 20EMA, now flagging tightly under descending resistance
Rejected Tuesday near $107.50, which makes sense—VRVP shows thick supply above that level
Still respecting structure and holding firm while 90% of stocks chop sideways or fade
Why This Matters:
Most traders look for breakouts when they should look for tight flags after big volume thrusts—especially in stocks that show strength while the market is weak.
That’s exactly what HOOD is doing.
The Playbook Here:
Not necessarily a setup for today
But it’s a prime candidate for your A-list watchlist
If HOOD can break this $107.50-$108.00 descending trendline with volume, it becomes actionable again
FOCUSED GROUP
GDX: Follow The Money
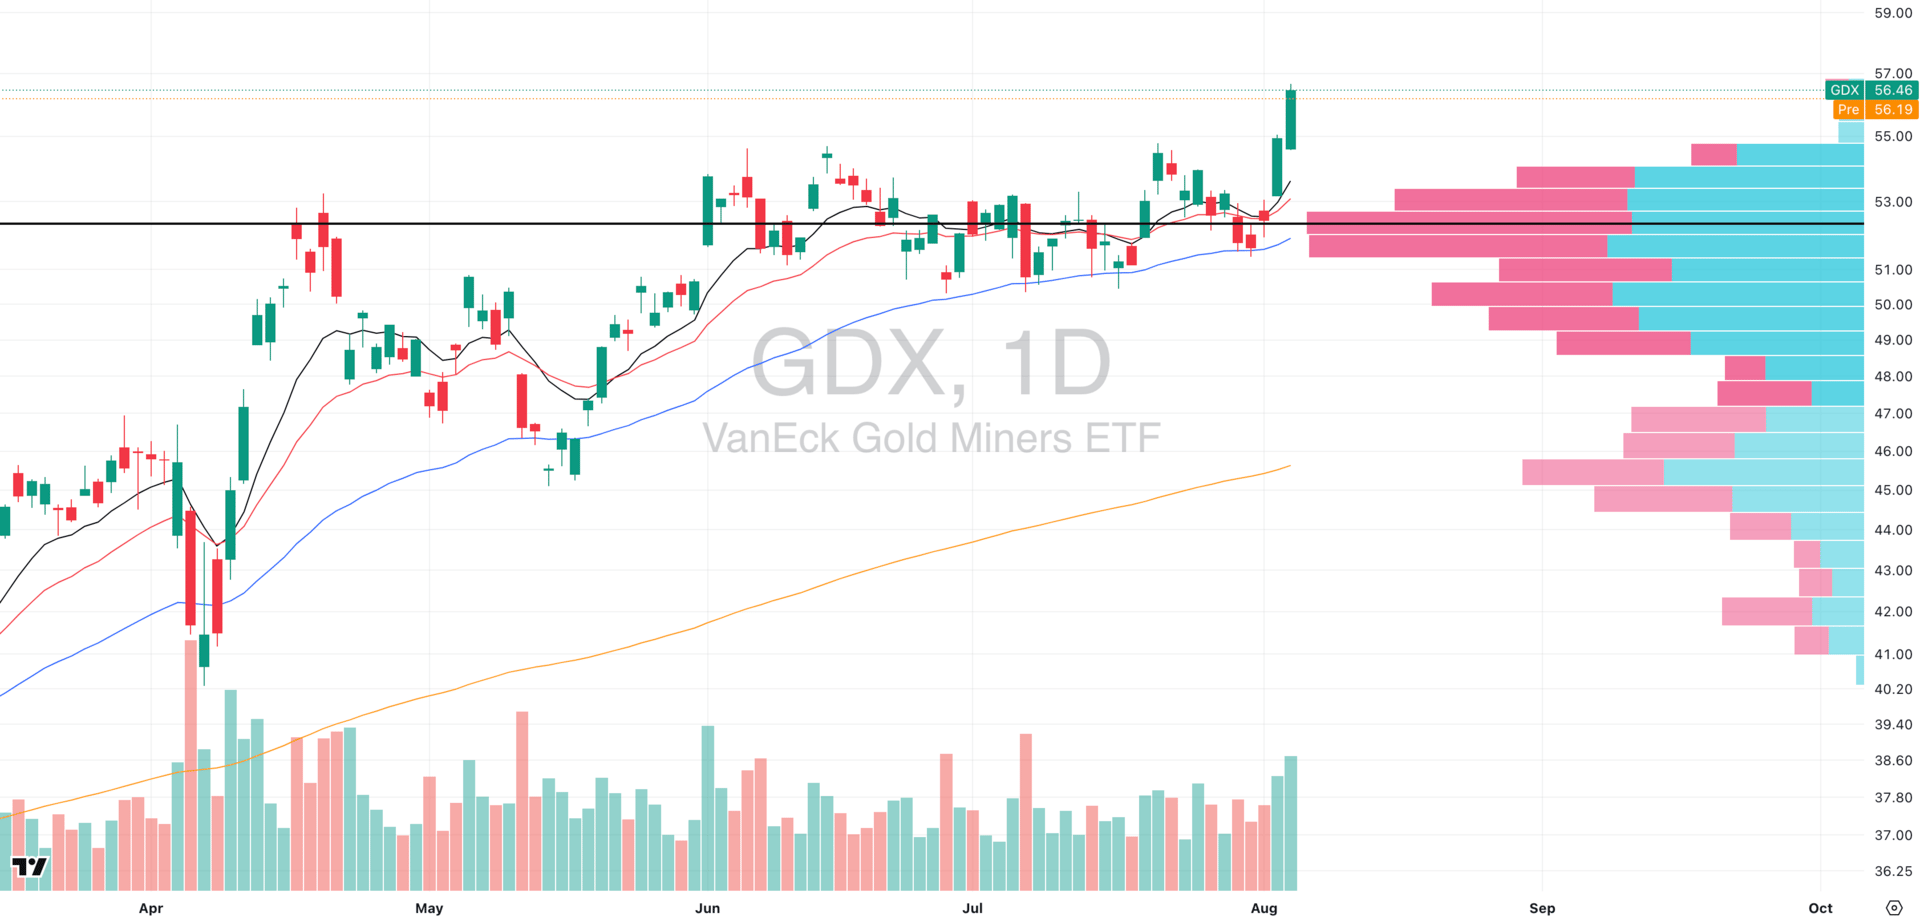
GDX VRVP Daily Chart
Signal: Risk is shifting. Gold miners are starting to lead—and the tape doesn’t lie.C
GDX just exploded through a multi-month base on massive relative volume—this is one of the cleanest sector breakouts in the entire market right now.
Why This Matters:
When growth equities stall and gold miners rally, it’s often a sign that capital is getting defensive—even if the headlines haven’t caught up.
But here’s the key: Don’t overthink the macro. Just follow the money.
And right now, the money is going into GDX.
Clean breakout through $53 supply shelf with conviction
Two-day surge, now extended—but this could be Day 2 of a new trend, not the end
Strong support below near the POC at $52.50–53.00
Watch for short-term digestion, but trend-followers are likely stalking this group for continuation
🔒 PRO Members Already Have the List
Swingly PRO members were already alerted to top gold miner setups before the breakout, with a full scan of high RS stocks inside GDX.
They’ll get another update this week with:
Fresh relative strength leaders
Exact technical entries + risk levels
Sector momentum rotation models
Breakout watchlist sorted by group
Want the full edge?
Join other retail swing traders upgrading their results → See what’s included

Did you find value in today's publication?This helps us better design our content for our readers |
Reply