- Swingly
- Posts
- Everyone’s Bullish. That’s the Problem.
Everyone’s Bullish. That’s the Problem.
In partnership with
OVERVIEW
Price Up, Participation Down
🟥 Risk-Off: The tape is stretched, and the follow-through is fading. Despite strong earnings beats across the board, we’re seeing a consistent lack of upside reaction.
Breakouts are stalling. QQQ and SPY keep grinding higher, but they’re doing so on thinning relative volume and narrowing participation. It’s not a collapse, but it is a signal to step back.
📊 Broad Market Structure: QQQ is up over 42 percent in just 15 week- a monster move-yet volume is diverging sharply. Fewer setups, more failed breakouts, and weak volume on every new high is not what you want to see at the tail end of a move.
Breadth is starting to stall at the margin, especially in the small and midcap space. When leaders stop leading, the edge disappears.

MARKET ANALYSIS
Good News, Bad Reactions

Earnings season is red hot. Over 80 percent of S&P 500 companies are beating expectations. But the market reaction? Lukewarm at best.
Even heavyweights like Google delivered strong numbers and bullish AI commentary... but couldn’t hold a breakout. That’s the key signal. When great news is met with weak price action, something is off. It tells us the market is stretched, and buyers are hesitant to chase.
This week gets even bigger. Microsoft, Meta, Amazon, and Apple all report. These names are massive drivers of the entire index. But the question isn’t whether they beat. The real question is — will anyone buy the news?
Markets have already run hard. QQQ is up more than 42 percent in just 15 weeks. That’s huge. So expectations are sky high and setups are thin. It’s no longer about how good the news is. It’s about whether anyone is willing to keep pushing at these levels.
Add to that the Fed on Wednesday. No change to rates is expected, but every word Powell says could move markets. Traders will be listening for any hint of cuts in September.
Also coming this week: inflation data, job numbers, and GDP growth. All potential catalysts. But again — the market is extended. The good news might already be priced in.
Bottom line: We’re in a good-news-no-follow-through environment. That’s where trend traders need to be extra cautious. The edge on new long entries is getting worse, not better.
Nasdaq

QQQ VRVP Daily Chart
The QQQ continues to push higher. But don’t let the green candles fool you as beneath the surface, participation is thinning out.
📉 Relative volume keeps dropping, even as price grinds into new highs. This is a textbook divergence. When fewer traders are willing to hit the ask at elevated prices, it signals exhaustion — not strength.
🔍 On the Visible Range Volume Profile (VRVP), we’re seeing a heavy cluster of supply just above $561, which has historically triggered selling pressure. Yet QQQ keeps nudging into this zone with weaker volume each time.
🧠 What does this mean for traders?
If you’re not already in from much lower levels, this is not the time to chase.
Momentum breakouts are struggling to follow through.
Earnings reactions have been lukewarm, even on beats (see: GOOG).
Your risk-reward edge on new longs is shrinking by the day.
The QQQ is up over 42 percent in 15 weeks which is one of the sharpest rallies in recent history. That kind of move demands digestion.
For us, this is a time to sit on our hands, manage open winners, and wait for the next asymmetric setup. Not every candle deserves capital.
S&P 400 Midcap

MDY VRVP Daily Chart
The midcaps are stuck in a tug-of-war and neither side is winning.
We saw a breakout on July 22 that looked promising… but it was quickly faded. Then came another push higher yesterday, only to fade again by the close. And now this morning? Another gap up, but with low relative volume.
This is the definition of chop. While SPY and QQQ grind higher on the backs of mega-cap strength, the MDY is showing a market that can’t make up its mind. One day up, the next day hesitation. No clean break. No consistent demand. And no actionable trend structure for swing traders.
That matters. When the average stock in the midcap universe looks this indecisive, it’s a signal that momentum is softening. Until we see volume step in and price hold up cleanly, this is a segment to observe and watch for a resolution either higher or lower that is clean and actionable.
Russell 2000
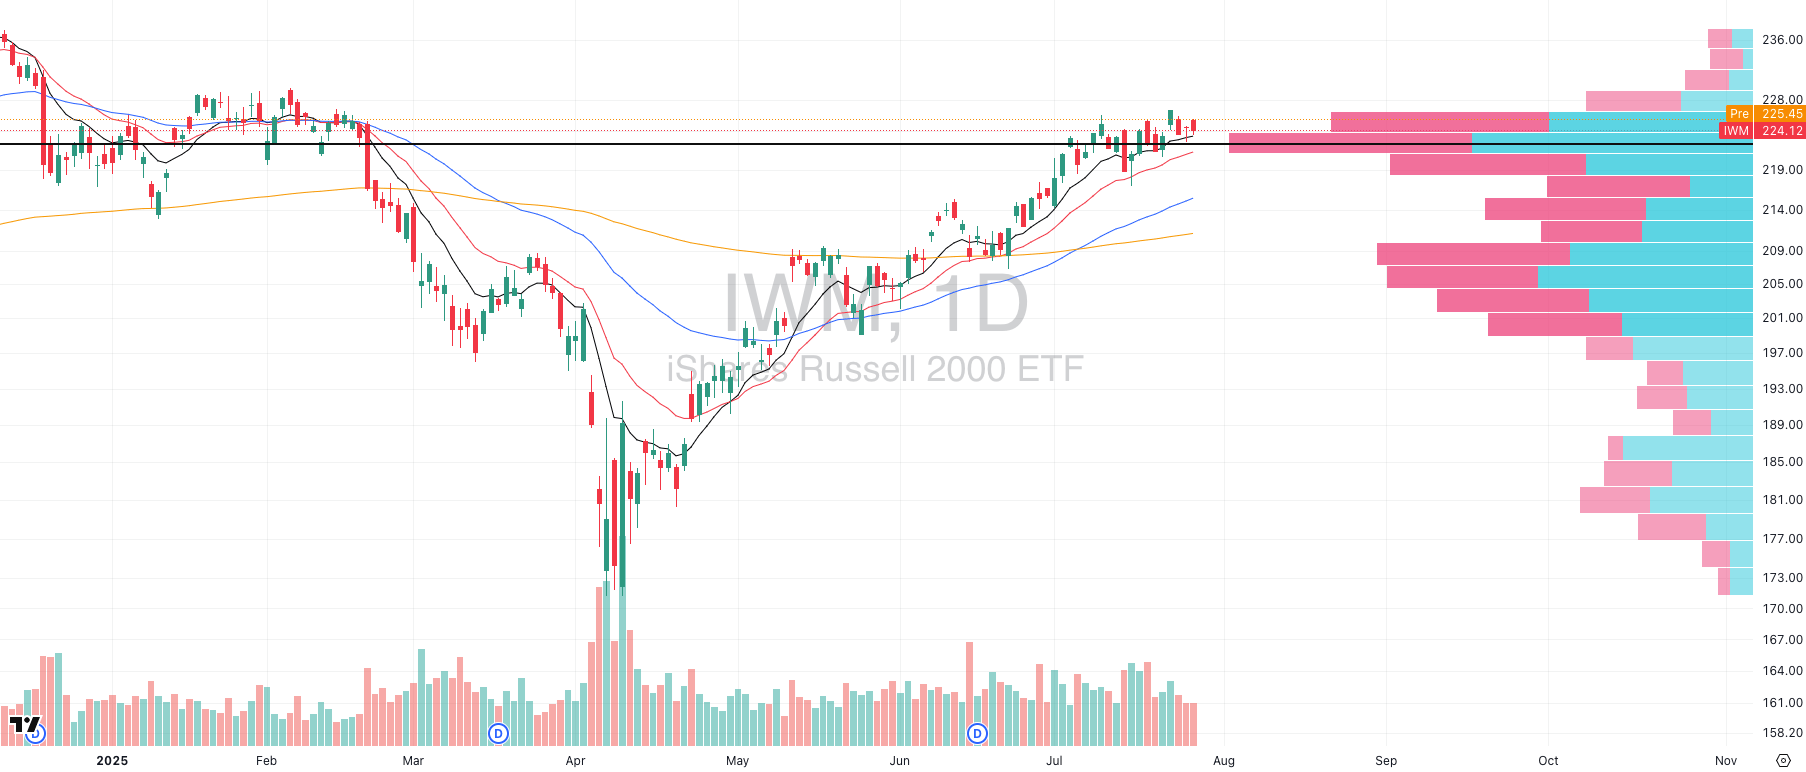
MDY VRVP Daily Chart
The IWM continues to coil around its Point of Control (POC) which is a behavior we typically like to see when setting up for a breakout. Price is hugging the rising 10 and 20-day EMAs, compression is increasing, and we’re nearing a clear inflection zone.
But here's the problem:
We are not making new relative highs
We are starting to see more failed breakouts
Participation beneath the surface is deteriorating
Despite the tight structure, many individual small-cap stocks have failed to hold breakouts over the past week, signaling potential distribution rather than healthy consolidation.
The longer this continues without upside resolution, the more pressure builds on trapped long positions, and the higher the probability of a downside move.
🧠 What we’re watching:
Breadth divergence: The number of actionable setups in small caps is shrinking, not expanding.
Volume imbalance: The VRVP shows light participation above current levels, meaning any rejection could result in fast downside moves.
Reward to risk flip: If buyers can’t gain traction soon, the asymmetric trade shifts away from long setups toward short opportunities.
Former PepsiCo Exec Invented A Plastic That Dissolves in Water

If anyone knows a thing about plastic’s impact on the planet, it’s Manuel Rendon. The former PepsiCo executive and environmental engineer is using his 20 years of expertise to solve one of the world’s biggest problems with Timeplast.
Up to 450 million metric tons of plastic are wasted each year. Microplastics seep into our bodies, and mountains of bottles pile up in the ocean. But Timeplast has patented a water-soluble, time-programmable plastic that vanishes without harming the environment.
Major players are already partnering with Timeplast for its patented technology—their sales grew 6,000% in the first month.
You have just a few days left to invest as Timeplast scales in its $1.3T plastic market, from packaging to 3D printing. Become a Timeplast shareholder by midnight, 7/31.
This is a paid advertisement for Timeplast’s Regulation CF Offering. Please read the offering circular at invest.timeplast.com.
FOCUSED STOCK
APP: A Perfect Multi Month Base

APP VRVP Daily Chart
We have been tracking APP for a long time now. In fact, we even took a long position back in mid-May 2025 when the stock first crossed over its descending resistance from December 2024. That setup ultimately failed — but what’s happened since is even more interesting.
APP has since pulled back and found solid support right at its point of control (POC) around $331. From there, it has quietly built a powerful sequence of higher lows, tightening up as its key moving averages compress and flatten out.
This base now stretches back several months, making any breakout from here potentially very meaningful. The longer the base, the bigger the move. And with APP sitting well below any extended levels, the risk to reward here is strong.
This is a name to keep close watch on into earnings. With the structure we’re seeing, any upside earnings reaction could trigger an episodic pivot move — a type of gap-up that marks the start of a brand-new trend.
FOCUSED GROUP
GBTC: The Top Bitcoin Play

GBTC VRVP Daily Chart
GBTC is starting to look interesting again. After a few choppy weeks, it is now tightening up along its rising 10 and 20-day EMAs. This mirrors what we are seeing in spot Bitcoin (BTCUSD), which has been building a clean three-week base just under the 119000 level.
Bitcoin has quietly been one of the top-performing assets over the past few months. And while correlations with equities have ticked higher lately, it still behaves like a different animal. When it moves, it moves with force. And often, it leads.
This is why GBTC deserves your attention. If BTCUSD breaks out with conviction, GBTC could offer a high-quality asymmetric setup. But timing matters.
Bitcoin trades around the clock. GBTC does not. That means any real move will start in BTCUSD first. Watch the spot chart closely. If Bitcoin tightens further and then explodes out of this base, GBTC could follow with a powerful lag effect that trend traders can exploit.
This is one of the few spots in the market where opportunity could emerge quickly and the number 1 segment right now.

Q&A
Got a trading question? Hit reply and ask!
Q: “The market is going up, but I keep losing money even though I am right?”
At its core, trend trading is not about being right. It’s about positioning yourself inside positively skewed payoff distributions where the expected value (EV) of your system is driven by asymmetry, timing, and position size relative to probability of follow-through.
Let’s break this down in hard terms:
📊 The Math of Edge
Most swing trend systems win 30–40% of the time.
Why? Because these systems are built on the assumption that when they’re right, they can extract 3R–5R+, but when wrong, losses are capped at 1R or less.
A system with a 40% win rate and 3:1 reward:risk profile = EV of +0.8R per trade
Now reverse the asymmetry: a 60% win rate with 1:1 R/R = +0.2R per trade.
The takeaway? More winners ≠ better. Fatter right tails = better.
🤖 Current Climate: Asymmetry Is Breaking Down
Over the past 15 weeks, we’ve seen an extreme right-tail regime:
QQQ has rallied +42%
SPY is up +32%
RSP has gained +25%
During that kind of parabolic move, trend traders already long since April are compounding. But for new entries, that same regime begins to offer diminishing marginal returns:
Breakouts extend but fail to hold
Relative volume declines, even as price climbs
Breadth narrows, setups decay, and chasing = higher stopout rates
This is where the entire asymmetry flips on its head:
🔻 Downside risk increases
📉 Probability of trend continuation shrinks
🟰 Expected value collapses
🧠 What We Actually Do Here
You must switch your thinking to evaluating probabilistic payoffs, not just charts.
When the market is stretched far from equilibrium (e.g. weekly EMAs), and you’re seeing low relative volume, compressed breadth, and overcrowded positioning — the distribution of outcomes starts shifting left.
The question isn’t “will the market go higher?”
It’s:
“Is the upside from this price worth the risk, given participation, extension, volume, and crowding?”
Right now? The answer is: probably not.
Unless you’re already long from lower, the asymmetric entry points have passed.
🪬 Our Job Right Now
As swing traders, our job is to:
Stay in trend if already positioned well
Avoid forced entries in deteriorating setups
Wait for mean reversion or consolidation to reload risk at lower expected stop distances
That’s how you protect system integrity. That’s how you avoid death-by-a-thousand-chops. And that’s how you maintain capital efficiency so you’re alive for the next high EV cluster when the market resets.
Remember: Every time you enter a trade, you’re placing a bet on future demand overwhelming supply, not just on a breakout, but a sustained, multi-day price discovery.
If that bet doesn't offer asymmetric risk-reward and high follow-through odds, skip it.
Because in this game, preserving capital until the next fat pitch is the edge.
Want the full breakdown, trade reviews, and complete daily setups in real time?
That’s all inside Swingly Pro → see what’s included
Reply