- Swingly
- Posts
- Ceasefire Broken: How Stocks Will React
Ceasefire Broken: How Stocks Will React


MARKET ANALYSIS
The Bounce Held: Major Sign of Strength

Markets are pausing this morning after yesterday’s powerful relief rally, and that is exactly what you would expect after such a violent one-day repricing.
The key change overnight is not that the ceasefire has collapsed, but that the market is being reminded how fragile the agreement still is.
Iran is now accusing the U.S. of violating the truce, tanker traffic through the Strait of Hormuz remains extremely limited, and oil is already rebounding after yesterday’s historic collapse.
That matters because yesterday’s rally was built on one core assumption: that the ceasefire would quickly translate into a genuine reopening of the Strait and a meaningful easing in energy pressure.
This morning, that assumption looks much less secure.
Oil is still well below this week’s panic highs, but the rebound matters. Brent and WTI pushing back toward the high-$90s tells you the energy market is not yet pricing a clean resolution.
In other words, the market has moved from pricing imminent catastrophe to pricing a fragile truce, and those are two very different things.
That is why futures are softer this morning rather than sharply lower. Investors are not fully abandoning the relief move, but they are beginning to fade the most optimistic version of it.
If crude remains elevated, inflation pressure stays alive, and that limits how far equities can run even if geopolitical rhetoric becomes less aggressive.
That is especially important because if Hormuz stays meaningfully impaired for longer, desks are already starting to talk about Brent back above $100 as a realistic base case rather than a tail risk.
So while the ceasefire changed the short-term direction of markets, it has not yet restored confidence in underlying supply conditions.
Beneath the surface, the leadership yesterday was exactly what you would expect from a relief rally: transports, cyclicals, travel, crypto, and high-beta growth all surged as oil collapsed.
This morning’s reversal in oil is already testing that move. Airlines are softer, energy is bouncing, and the market is being forced to decide whether yesterday was the start of something more durable or simply the first leg of a volatile re-pricing.
There are also other pockets of strength still worth noting. AI infrastructure remains firm, with the new Meta–CoreWeave agreement reinforcing that the secular demand story in that part of the market is still very much alive.
But even there, macro is still in charge. If oil reaccelerates and the ceasefire deteriorates further, sector-specific positives are unlikely to override the broader tape.
Nasdaq
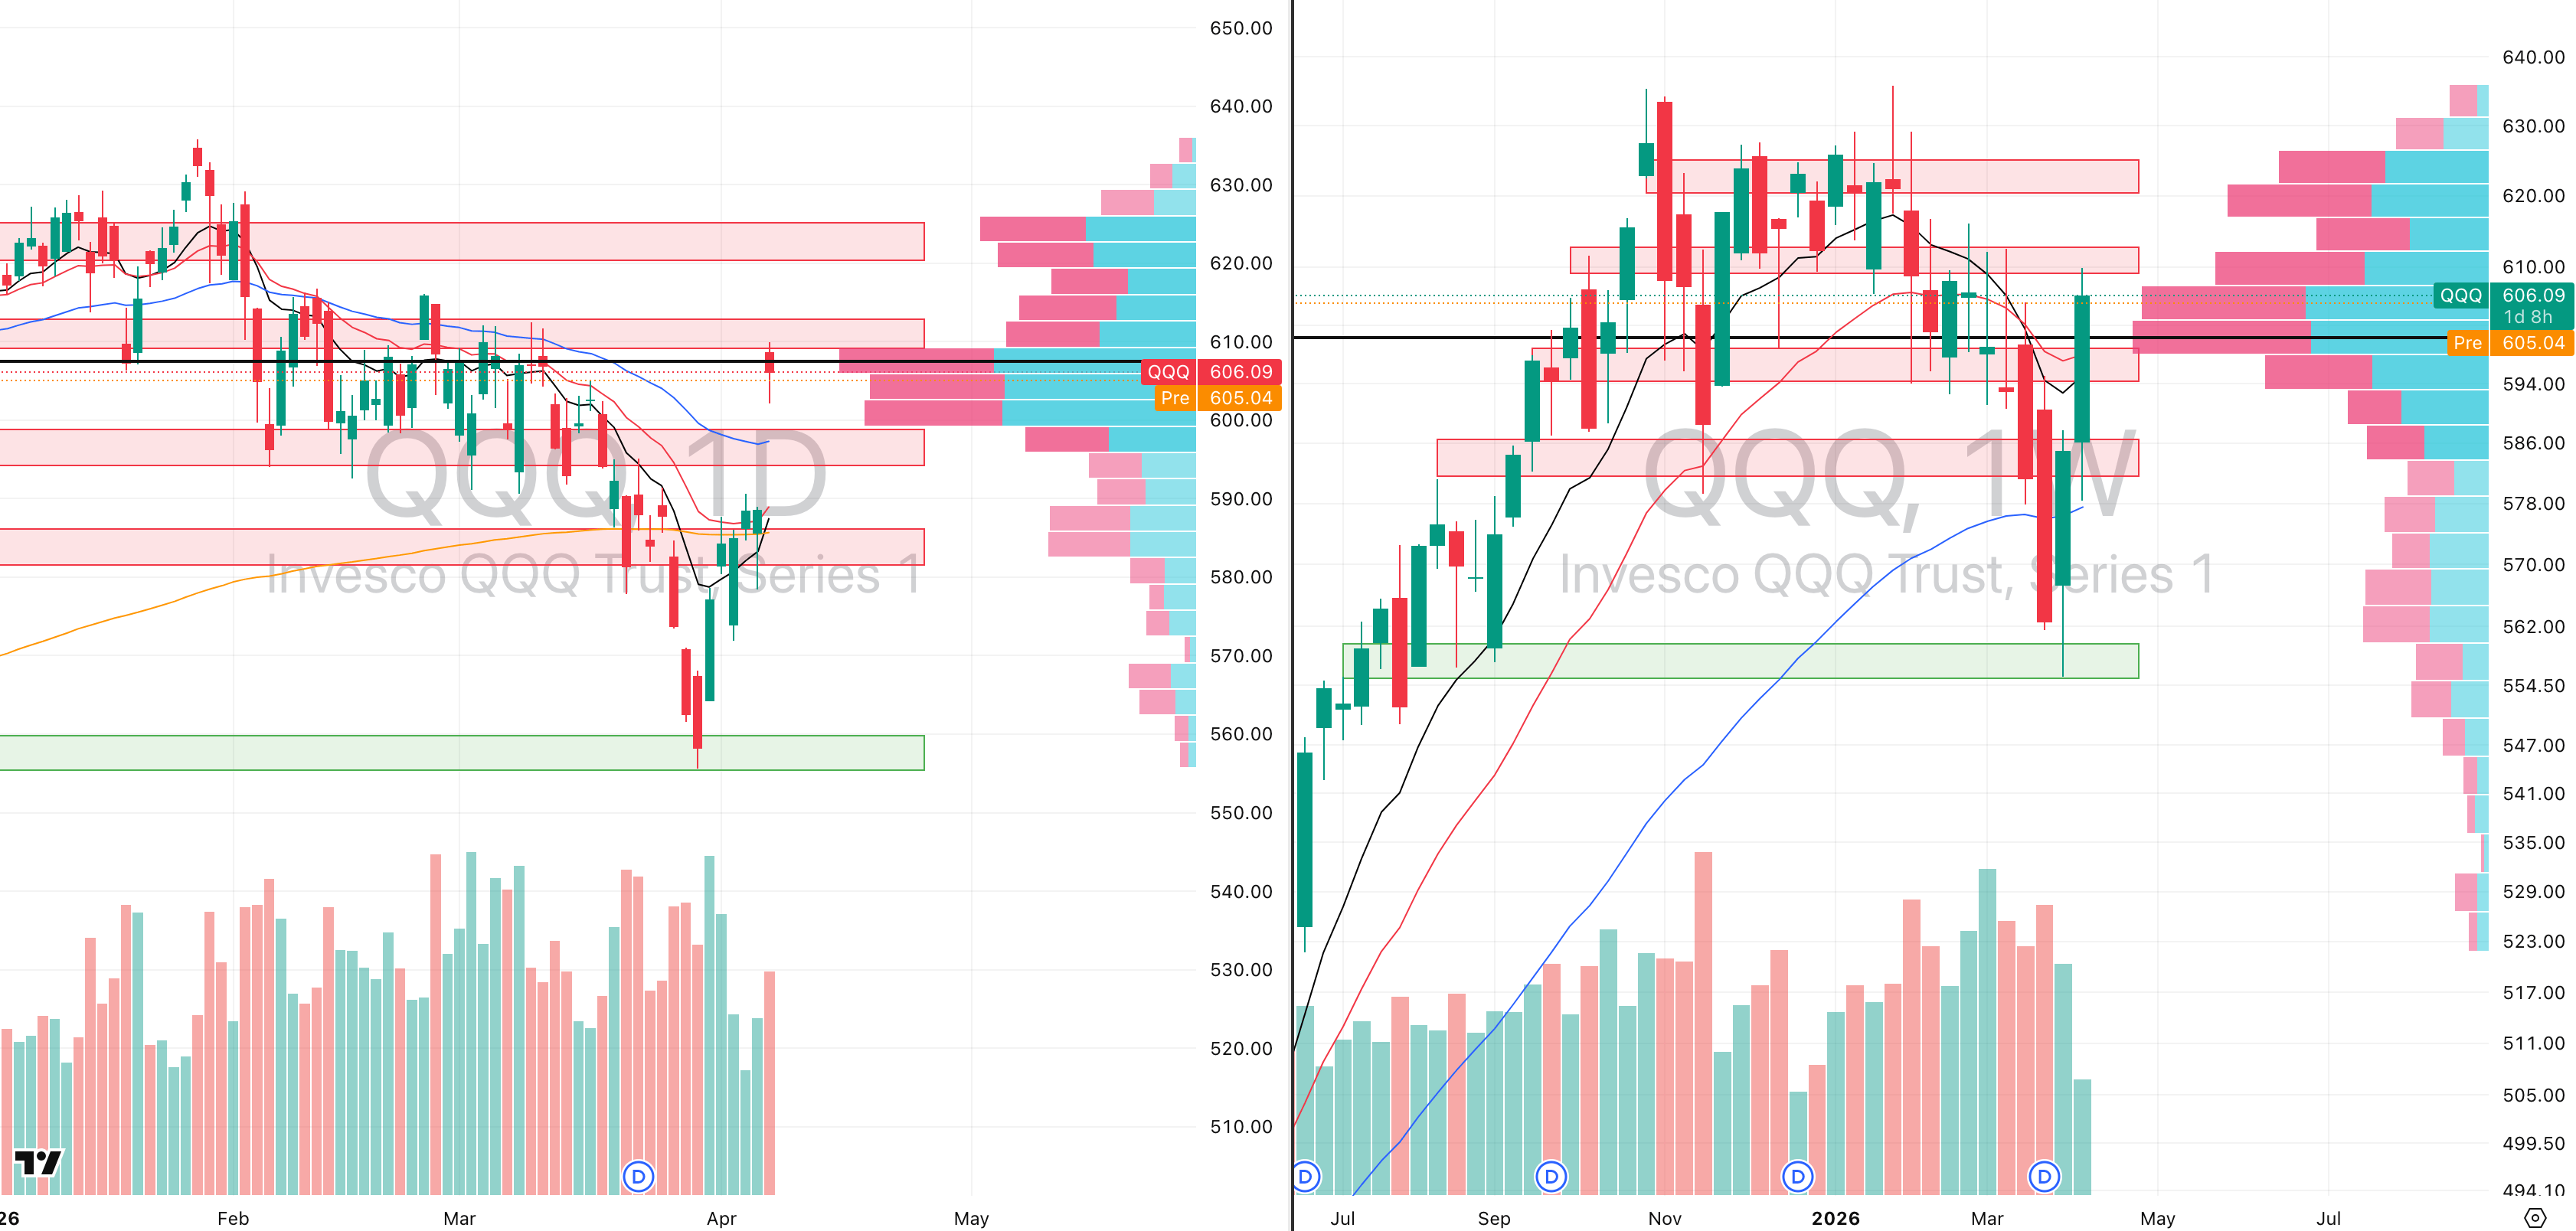
QQQ VRVP Daily & Weekly Chart
68.31%: over 20 EMA | 48.51%: over 50 EMA | 48.51%: over 200 EMA
The Nasdaq held above yesterday’s gap lows, but the quality of the move remains questionable and we continue to view the setup with caution.
Price did exactly what we expected on the upside, pushing into the $610 to $614 supply zone, where overhead resistance became active almost immediately.
That zone matters because the visible range volume profile shows roughly 7 million shares traded green versus only 4.5 million red, which means there is now a meaningful pocket of trapped buyers likely to add to selling pressure on any further push into those highs.
In other words, yesterday’s gap higher may have improved price structure short term, but it also created fresh trapped inventory directly beneath resistance.
What concerns us most is participation. Relative volume on yesterday’s session came in at only 91% of the 20-day average, which is very weak considering how violent the overnight repricing was.
For a true character-change move, you would normally expect a much stronger expansion in volume.
Instead, the lack of aggressive participation suggests the move may have been more mechanical than conviction-driven.
That is why we continue to view this gap as fragile and from our perspective, the area below current price down toward $590 remains vulnerable, and the setup increasingly resembles a potential gap-fill short rather than a clean breakout continuation.
From yesterday’s close, that would imply roughly -2.85% downside, which is significant enough to remain attractive if weakness begins to accelerate intraday.
S&P 400 Midcap
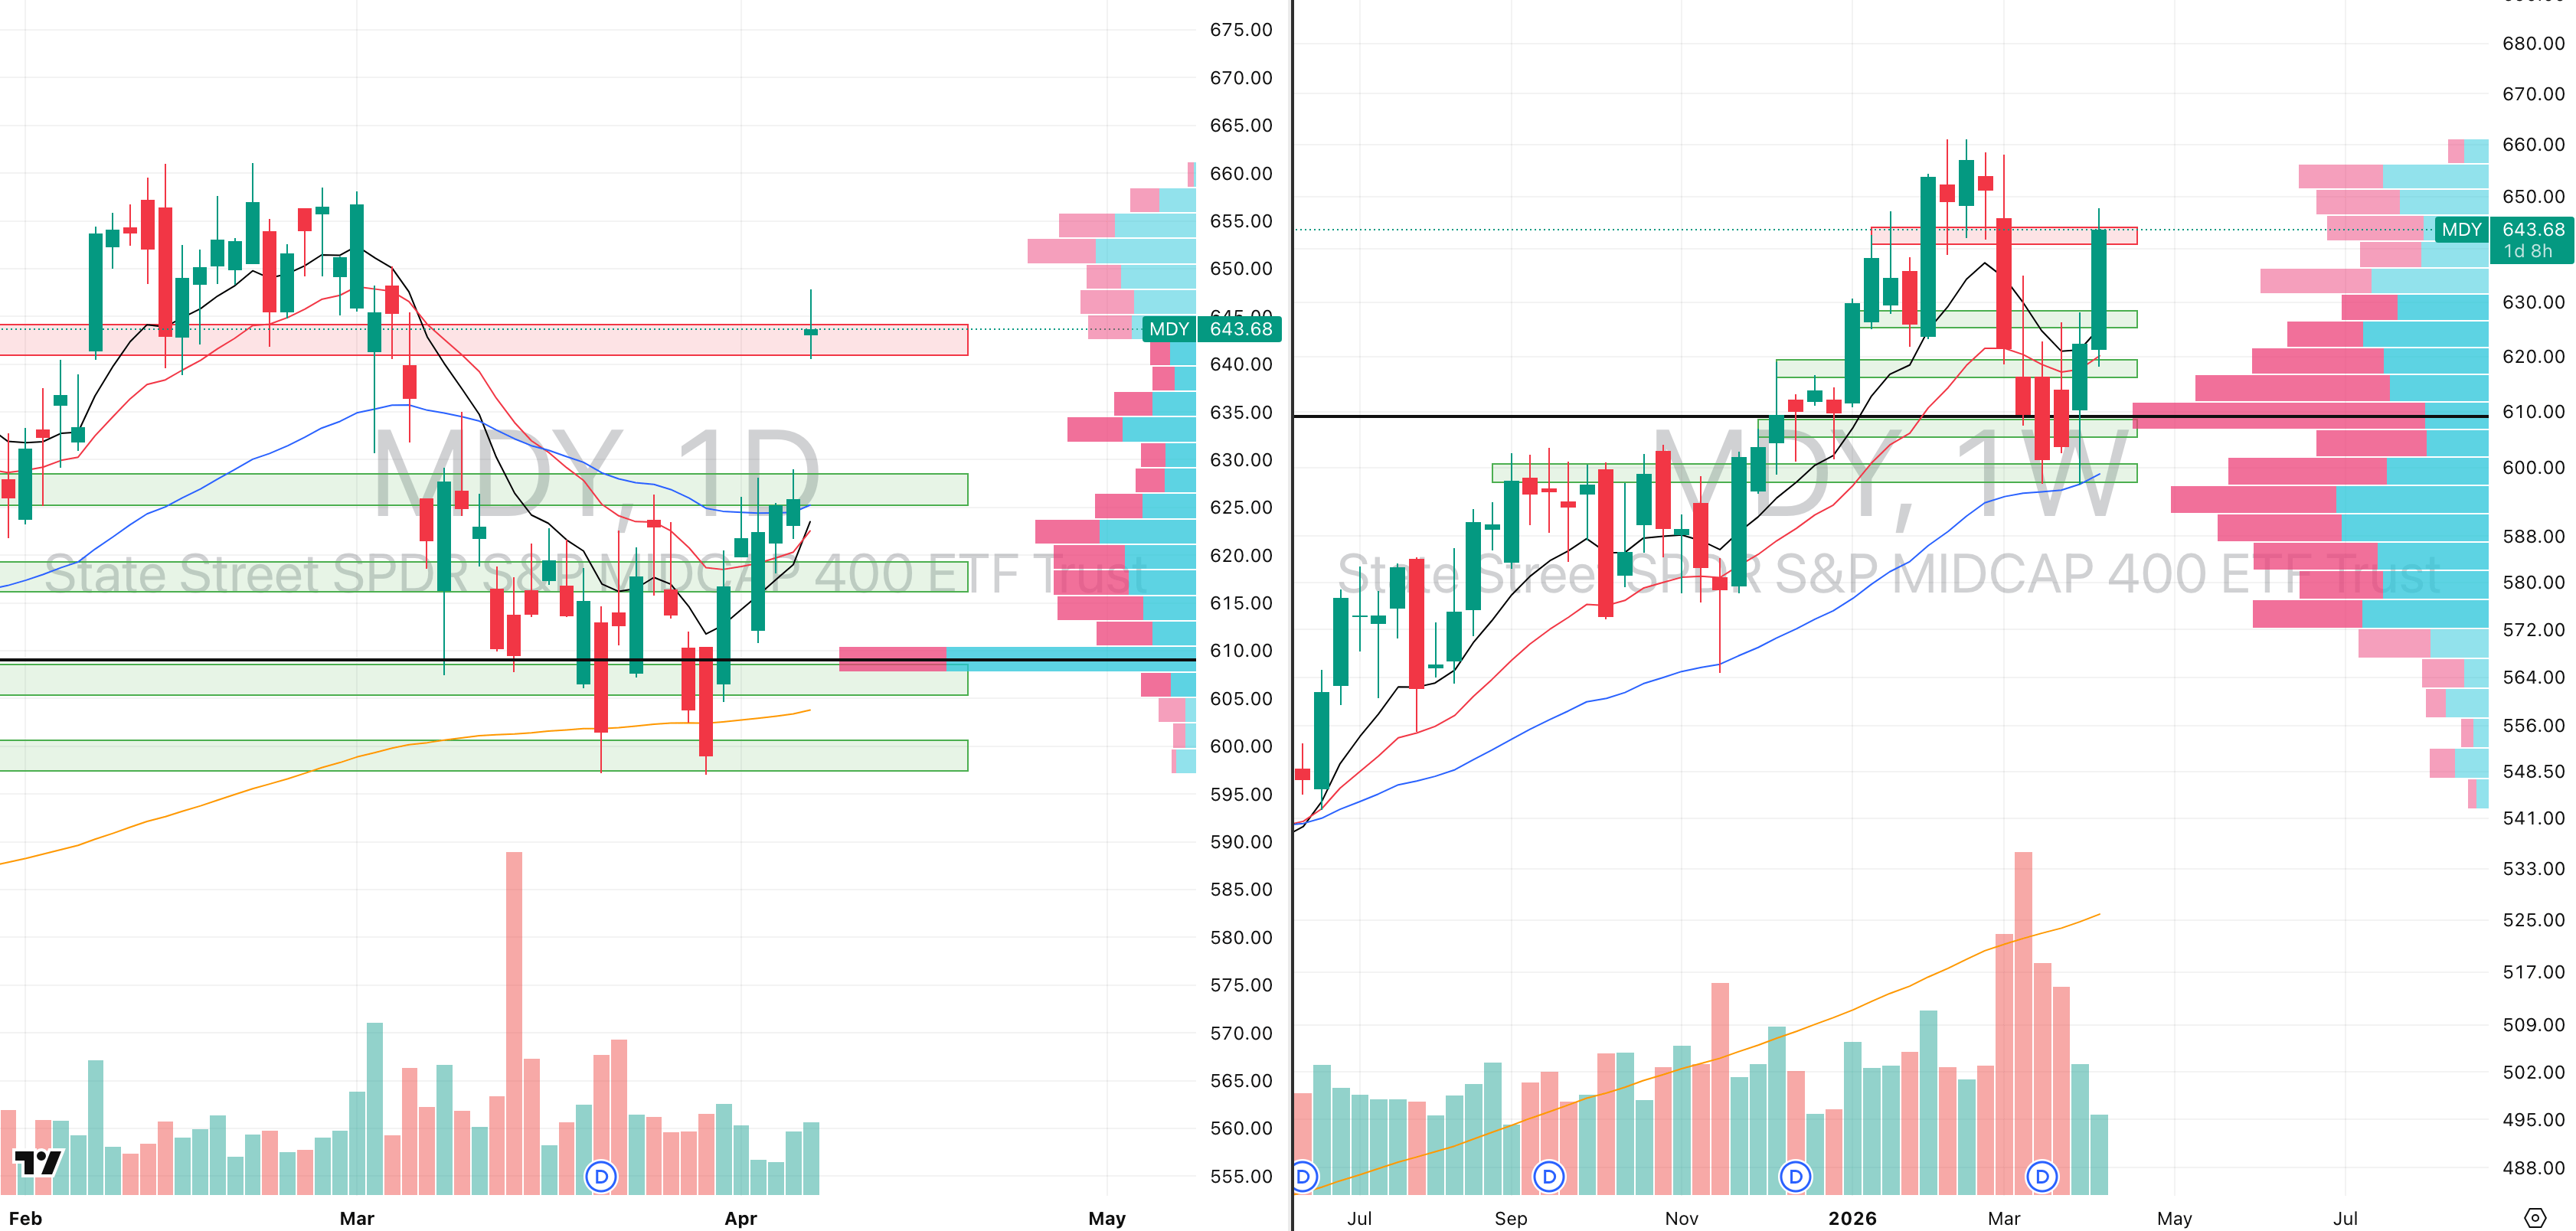
MDY VRVP Daily & Weekly Chart
81.00%: over 20 EMA | 49.25%: over 50 EMA | 57.25%: over 200 EMA
Mid-caps also showed signs of exhaustion yesterday as price extended as high as $648, but failed to hold those gains and instead retraced lower to finish with a green indecision doji.
Again, the issue is not simply the candle shape but it is the participation behind it.
Relative volume came in at just 89% of the 20-day average, which is extremely low for what should have been a much stronger confirmation session if this were truly a durable character change.
That weak participation makes the move far less convincing.
More broadly, one of the bigger concerns for mid-caps — and really for all the major indices right now — is breadth.
The MDY now has more than 80% of constituents above their 20-day EMAs, while the QQQ and IWM are not far behind, sitting roughly in the 68% to 77% range.
That kind of breadth surge is extremely strong in the short term, but in most cases it also points toward near-term mean reversion risk once the initial impulse begins to cool.
That matters here because we have seen a dramatic breadth expansion without a matching expansion in conviction volume.
In simple terms, the bounce is broad, but it is not yet proving itself through participation.
From our perspective, the MDY now needs to consolidate sideways above the gap low and build a proper base so that a real exchange of ownership can occur at these new levels.
Until that happens, the move remains fragile and our base case still leans toward a gap-fill short down to $629, which would imply roughly -2.09% downside from yesterday’s close.
Russell 2000

IWM VRVP Daily & Weekly Chart
77.37%: over 20 EMA | 54.34%: over 50 EMA | 56.00%: over 200 EMA
Small caps are already starting to front-run what we suspect could become a much more painful next few sessions.
Unlike the SPY and QQQ, the IWM is already breaking below yesterday’s low in premarket trade, with price down toward $258.41.
That weakness is important because it tells you small caps are once again failing first, which is often where broader market fragility begins to show up earliest.
The rejection came at the $262 supply zone, where the visible range volume profile again shows a clear concentration of trapped buyers and growing supply overhead.
Just like in the other indices, yesterday’s participation was not impressive enough to validate the move.
Relative volume only reached around 101% of the 20-day average, which is barely above baseline and not nearly strong enough for a session that was supposed to represent stress relief and renewed risk appetite.
That leaves very little reason to be aggressively long into this structure while so much supply is still sitting overhead.
More importantly, the broader macro backdrop is already beginning to work against the rally.
Oil has rebounded hard directly off its 10-week EMA, and the ceasefire already looks increasingly unstable.
So what should have been a genuine easing of market stress is already starting to fade.
From our perspective, that makes the small caps especially vulnerable, and unless they can reclaim yesterday’s range quickly, this likely becomes the first index to signal that the broader relief move is failing.
Did you find value in today's publication?This helps us better design our content for our readers |
Reply