- Swingly
- Posts
- 🚨 Breadth Just Collapsed: What It Means
🚨 Breadth Just Collapsed: What It Means

OVERVIEW
Cracks Are Starting To Show
Macro: S&P rally paused as Oracle weakness exposes fragility of AI leadership; sentiment remains euphoric but risk/reward is compressing.
Fed: September minutes today are the key macro event — expect clarity on policy division heading into year-end.
Breadth: Sharp deterioration across indices — Nasdaq shows first real distribution since breakout; midcaps and small caps saw abrupt breadth collapses, signaling systemic selling.
Nasdaq (QQQ): Still above 10-EMA, but internals weakening fast — critical support ~$599–600.
Midcaps (MDY): Rejected at $602.50 resistance; volume spike + breadth collapse point to seller control; $595 is last shelf before accelerated downside.
Small Caps (IWM): Pulled back to $244 support; breadth weak, limited buyer defense; break risks $240–241 zone.
Focused Stock – GEV: Clean energy leader building bull flag; higher lows + declining consolidation volume = accumulation; breakout above $620 could target $640–650.
Focused Group – XLE: Energy rebounding off major support ($88–89) with textbook breakout → retest → demand validation; structural leadership rotation under the surface.

MARKET ANALYSIS
Momentum Fades, Leadership Unclear

Markets are pausing after a seven-day S&P streak, with weakness in Oracle reminding traders how narrow leadership risk remains in AI-linked names.
The broader narrative is less about one earnings miss and more about positioning: sentiment is euphoric, liquidity is supportive, and history shows bubbles can stretch further before breaking.
The U.S. shutdown is now in week two and is largely dismissed by markets so far, but each additional day raises the odds of knock-on effects for confidence and data flow.
The real inflection to watch is the Fed: today’s September minutes will reveal the depth of division inside the committee and help shape rate expectations into year-end.
This is a tape defined by stretched momentum and fragile leadership. Until the Fed or credit markets force a regime shift, upside can continue, but the risk/reward is compressing as cracks are starting to form.
Nasdaq
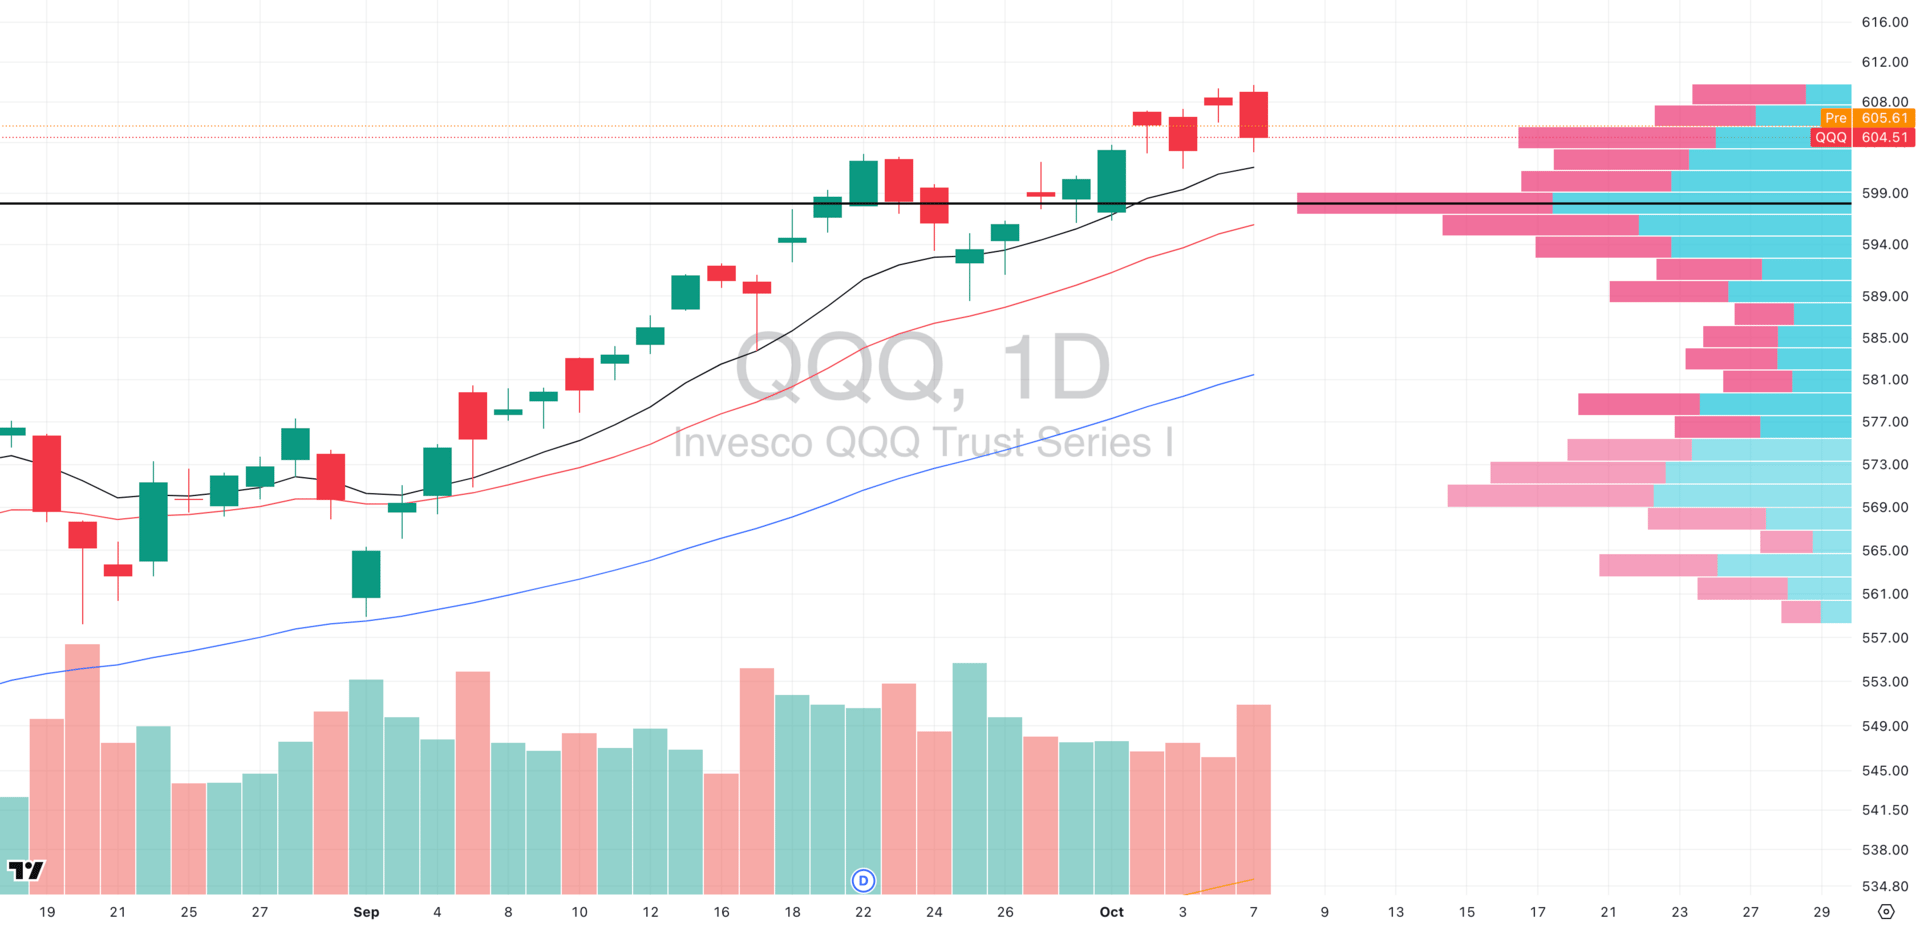
QQQ VRVP Daily Chart
% over 20 EMA: 48.51% | % over 50 EMA: 52.47% | % over 200 EMA: 60.39%
The pullback from the $104 extension occurred on notably expanded volume relative (117% 20 day average) to the prior week's declining volume advance, representing the first meaningful distribution signature since the breakout above $99 resistance.
Nearly one-fifth of Nasdaq components fell below their 20-day EMAs in a single session (-19% decline), representing substantial momentum deterioration.
This velocity of breadth compression indicates systematic selling across the complex rather than isolated profit-taking, validating the volume profile's distribution warning.
Rising 10-EMA remains decisive threshold and we don't attempt to outsmart this critical support level (~$599-600) as it continues defining the short-term trend structure. Sustained hold maintains immediate bullish framework despite deteriorating internals
Too early to call top, too late to ignore warnings although the current configuration suggests elevated distribution risk yet lacks the decisive breakdown required to confirm reversal. This challenging regime demands defensive positioning wit
S&P 400 Midcap
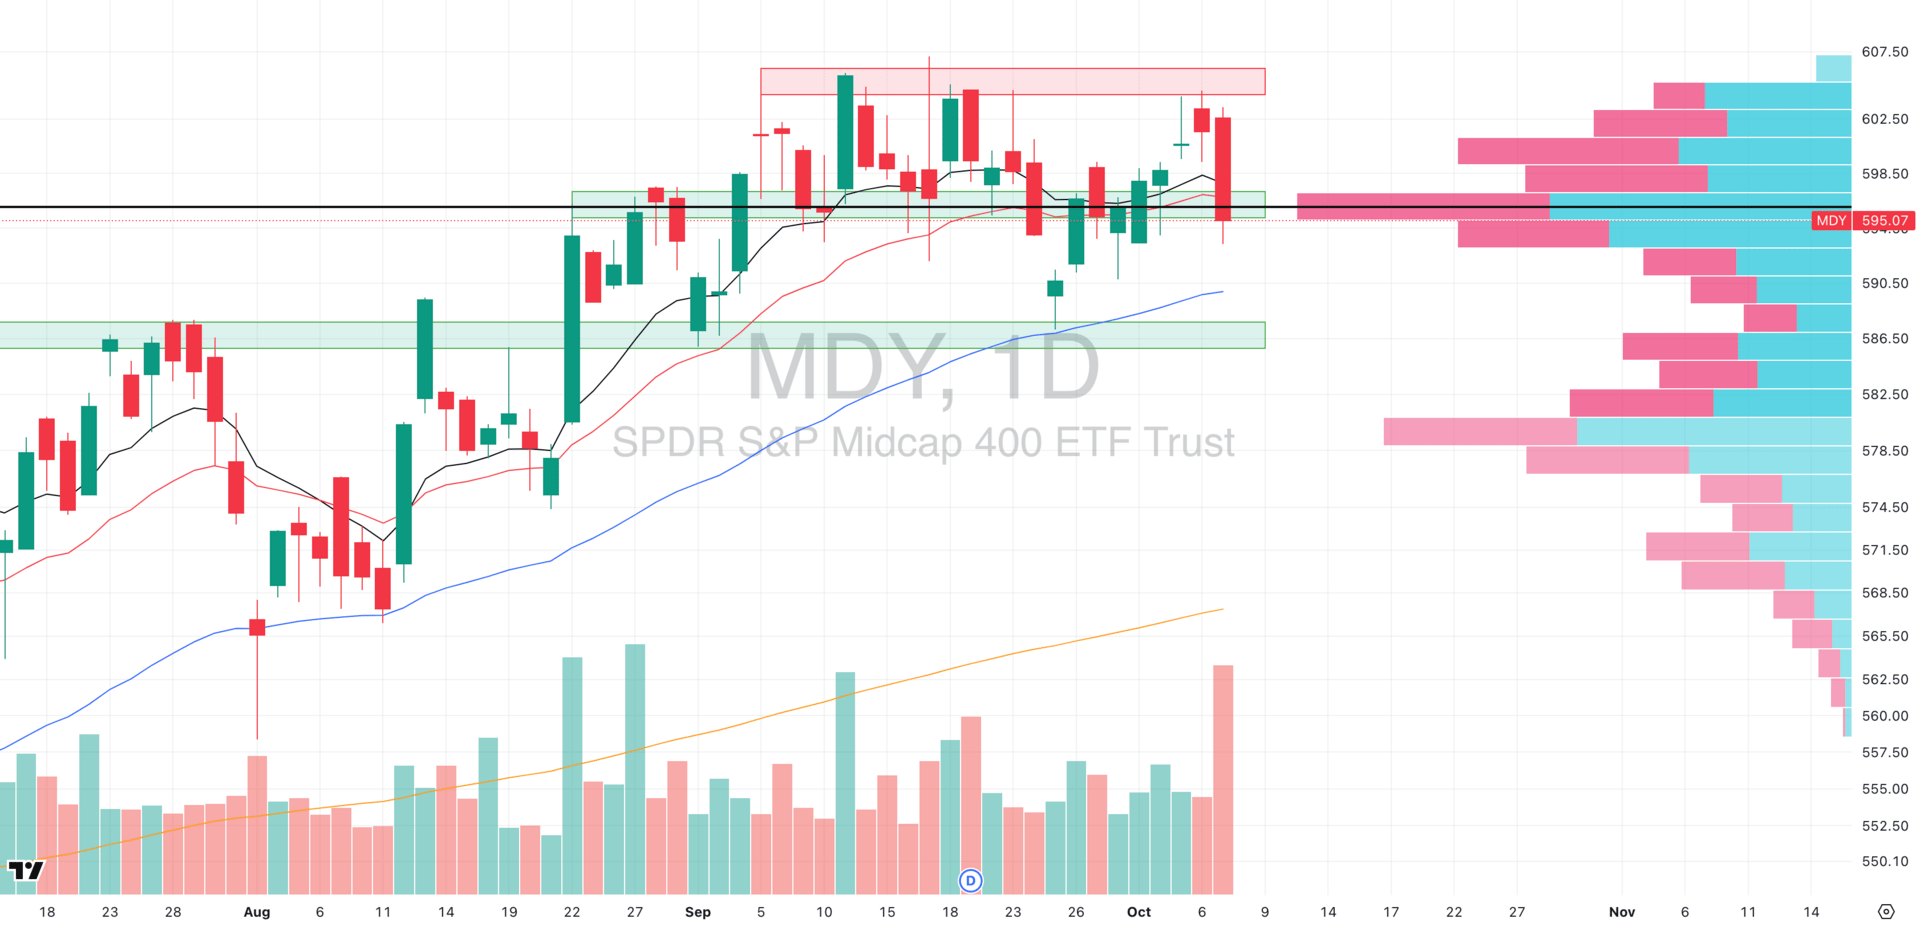
MDY VRVP Daily Chart
% over 20 EMA: 38.15% | % over 50 EMA: 47.38% | % over 200 EMA: 58.10%
Yesterday’s session confirmed a decisive rejection right at $602.50, the same overhead supply zone that has repeatedly capped every rally attempt since August.
The rejection came on extremely high relative volume (200% the 20 day average), signaling that sellers are now firmly in control of that region.
What’s more concerning is the absence of responsive buyers even as price tested the rising 10- and 20-day EMAs and levels that typically attract dip demand in healthy trends.
That failure suggests a psychological shift in participation: buyers are no longer defending trend, they’re waiting lower.
The Visible Range Volume Profile (VRVP) shows price barely holding above the Point of Control (~$595) and the most transacted level of the past quarter and the final structural shelf before deeper liquidity gaps open below.
A decisive break under this zone would expose a thin-volume pocket toward $585–588, where downside acceleration could emerge quickly.
Internal deterioration has accelerated sharply. The percentage of midcap stocks trading above their 20-day EMA collapsed by more than 24% in a single day, down to just 38.15%
This kind of abrupt breadth failure rarely happens inside healthy consolidations.
Russell 2000
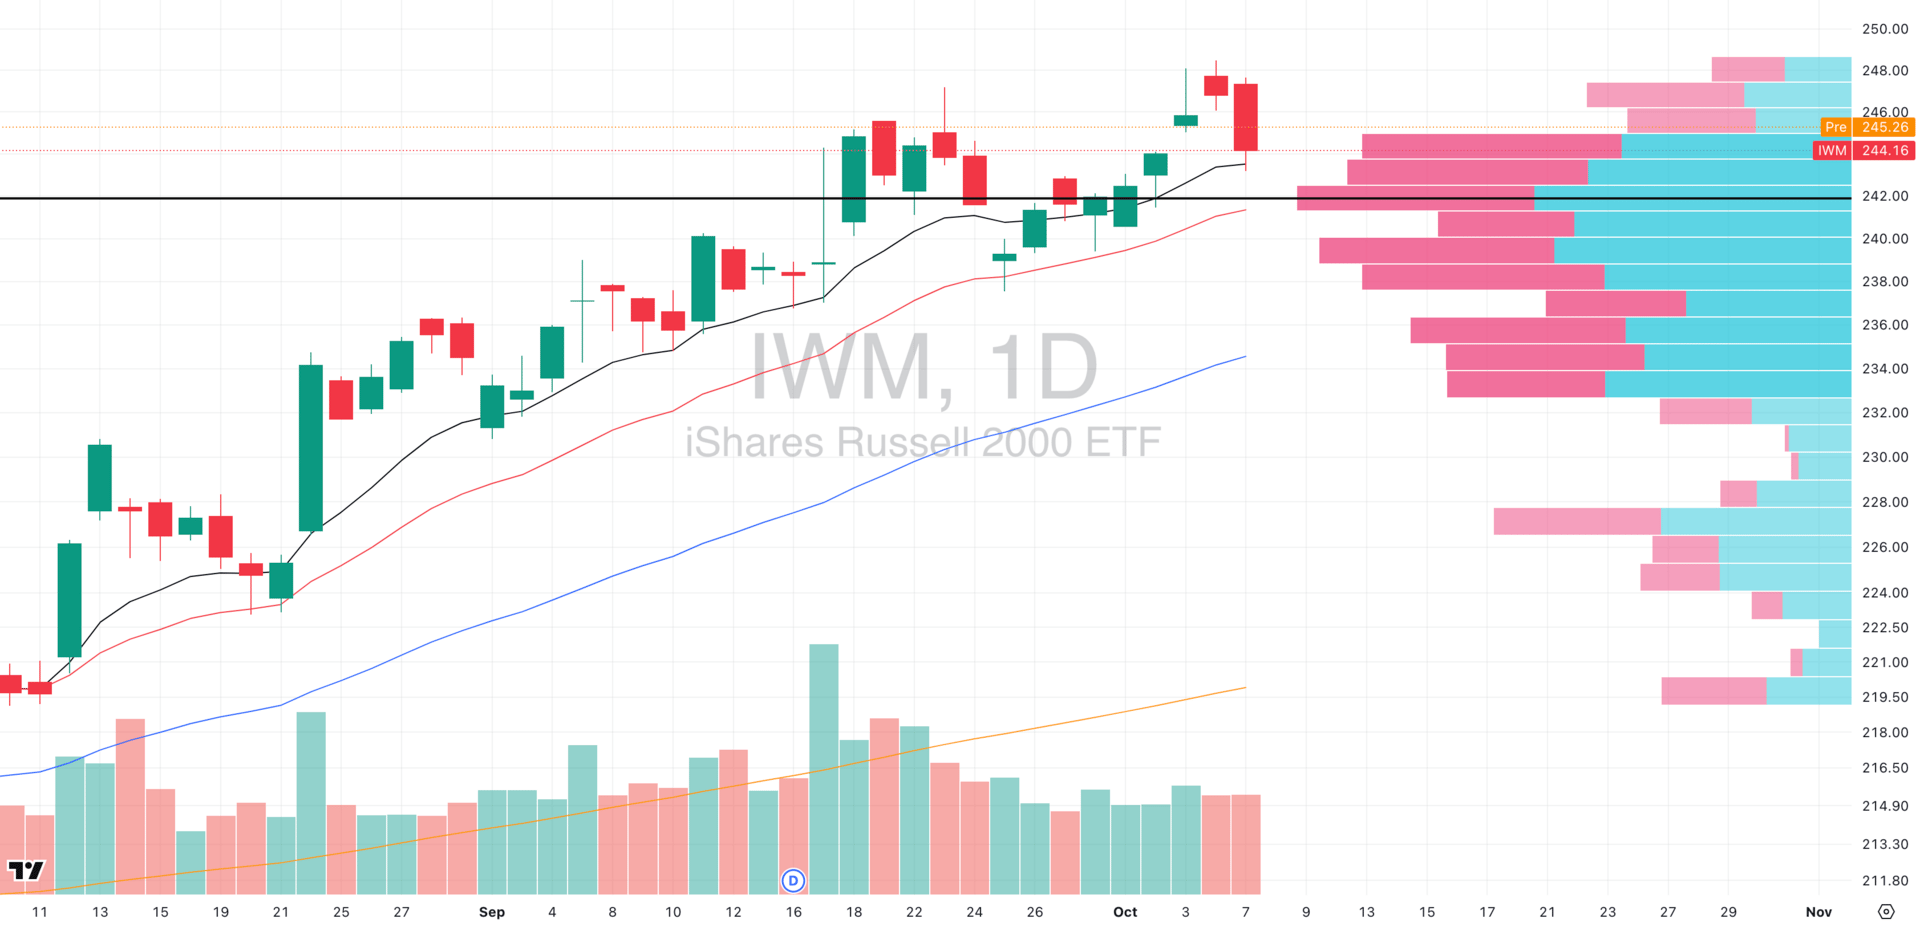
IWM VRVP Daily
% over 20 EMA: 38.60% | % over 50 EMA: 49.23% | % over 200 EMA: 56.81%
Small caps (IWM) reversed sharply yesterday, unwinding back to the rising 10-day EMA in a clean mean reversion move. This type of controlled pullback is typical after a vertical run, but what’s missing here is confirmation through demand as relative volume failed to expand, suggesting buyers didn’t step in to defend strength.
Internal participation remains thin, with only 38.6% of Russell 2000 components trading above their 20-day EMA. That’s an objectively weak breadth profile for a group that just tested fresh relative highs last week.
The IWM continues to trade just above a dense VRVP cluster near $244, a level that provided prior resistance through mid-September and is now acting as short-term support. Losing this shelf would expose the next liquidity pocket around $240–241, where trend integrity would be tested.
For traders holding existing small-cap or midcap exposure, manage positions based on each stock’s relationship to its key moving averages e.g. strength above 10/20-EMA can still be trailed, but new long exposure here is a real risk.
13 Investment Errors You Should Avoid

Successful investing is often less about making the right moves and more about avoiding the wrong ones. With our guide, 13 Retirement Investment Blunders to Avoid, you can learn ways to steer clear of common errors to help get the most from your $1M+ portfolio—and enjoy the retirement you deserve.
FOCUSED STOCK
GEV: Rotation Into Clean Energy
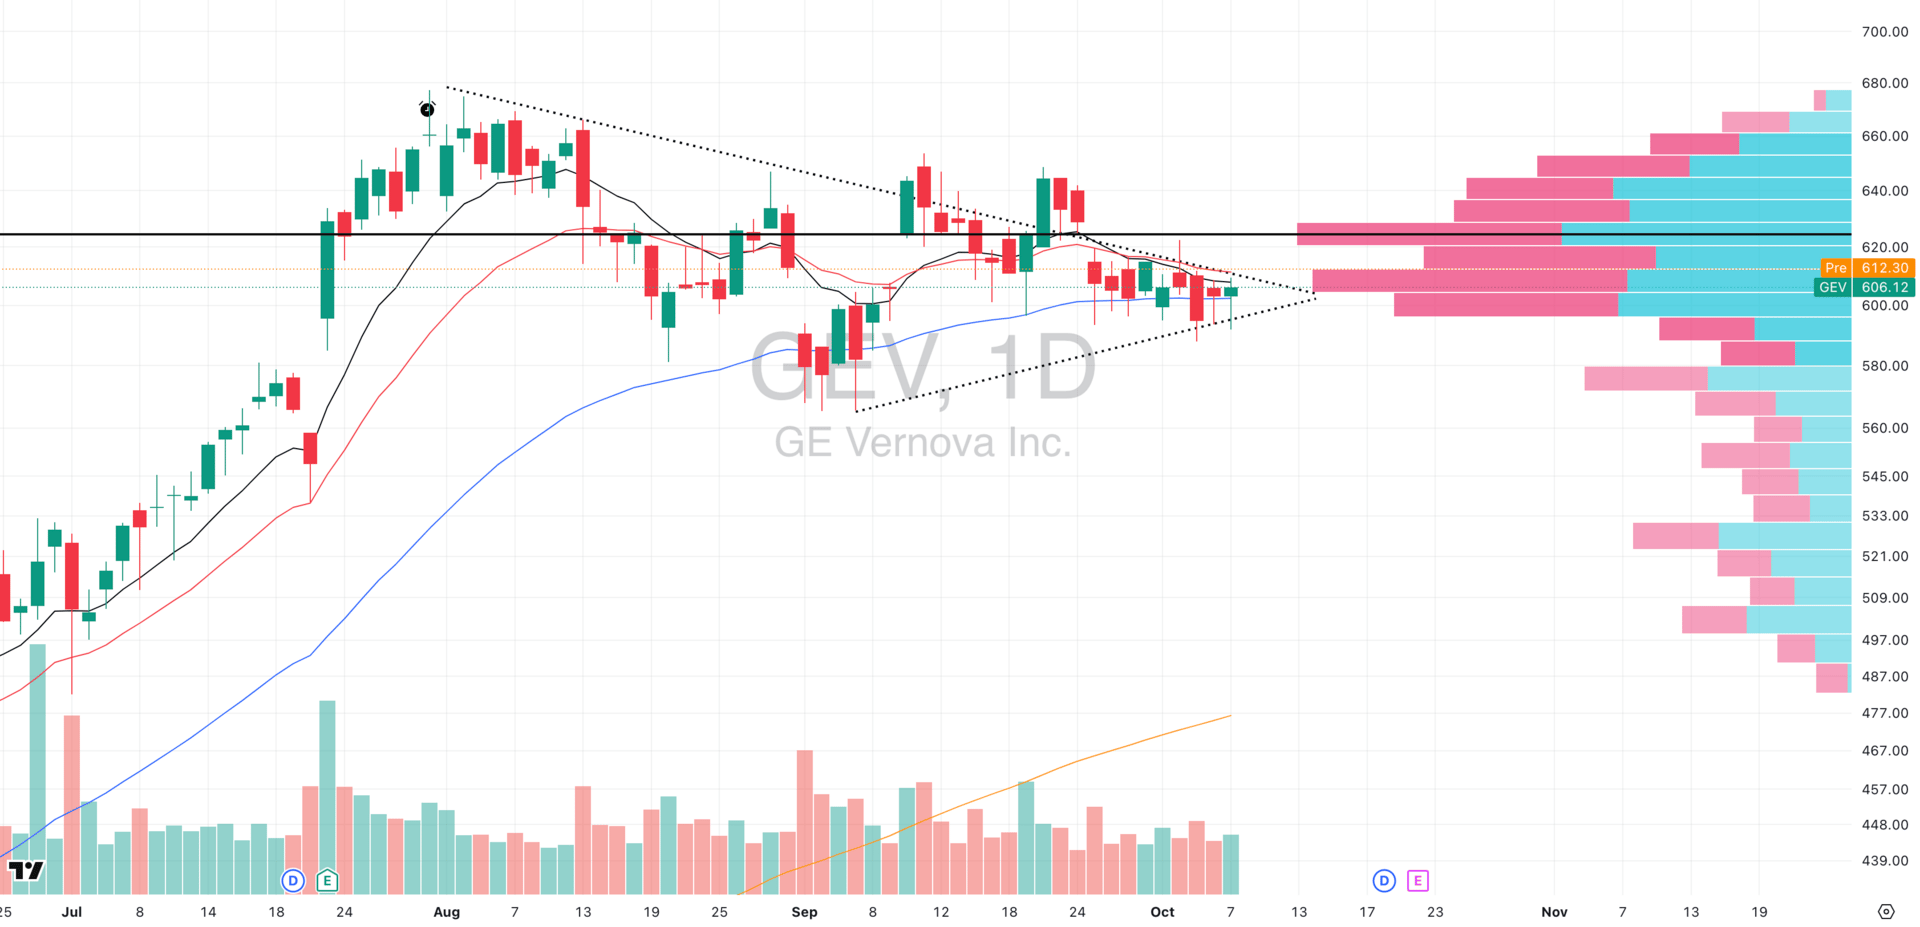
GEV VRVP Daily Chart
ADR%: 3.43% | Off 52-week high: -10.5% | Above 52-week low: +140.6%
Bull flag formation in play: GEV has constructed a consolidation pattern following its explosive summer rally, with price coiling between converging trendlines as it digests gains and builds energy for the next leg higher
Series of higher lows confirms structural strength: Each pullback since late August has found support at progressively elevated levels, with the ascending support trendline (currently near $595) repeatedly validated through multiple tests without violation
Large base formation suggests institutional accumulation: The multi-week consolidation zone between $590-620 exhibits characteristics of accumulation rather than distribution, with volume declining during the range (typical bull flag behavior)
We're monitoring for high relative volume breakout above $620 – A decisive move through overhead supply on expanding volume would trigger technical breakout, likely accelerating toward the $640-650 zone where volume profile shows minimal resistance
FOCUSED GROUP
XLE: Energy Holding The Line
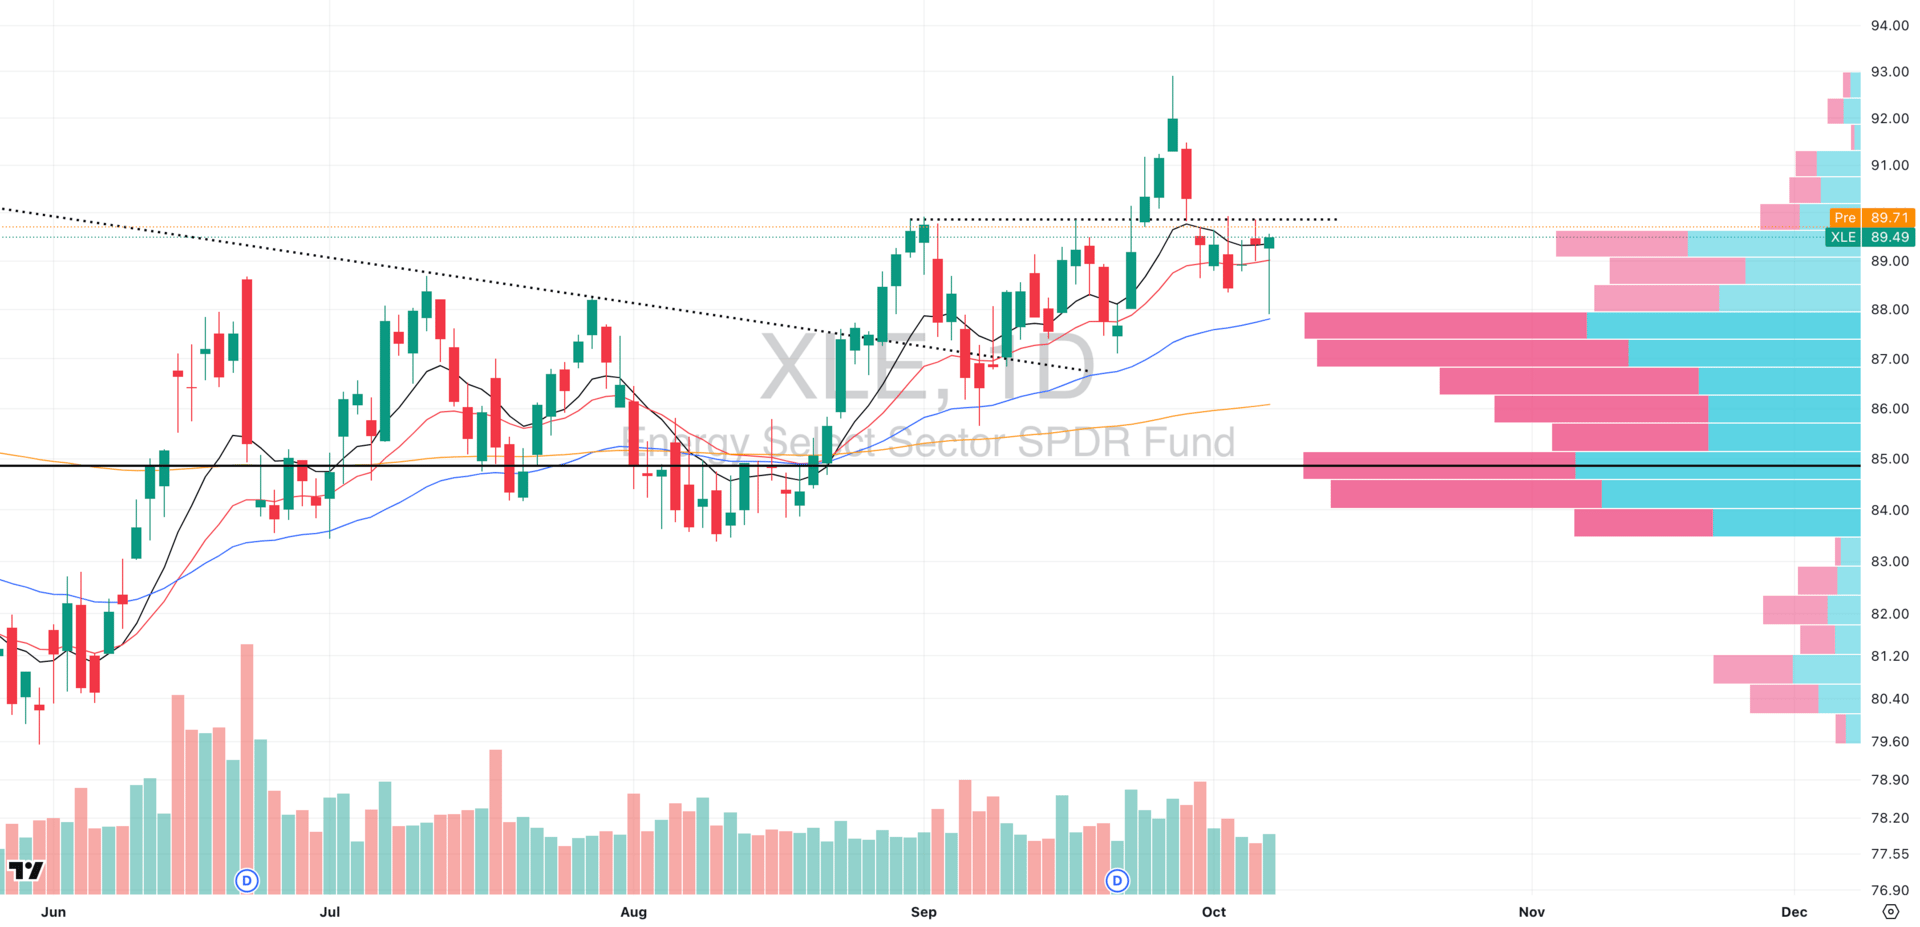
XLE VRVP Daily Chart
XLE rebounded cleanly off the $88 shelf, a confluence zone of the rising 50-day EMA and a dense volume cluster on the Visible Range Volume Profile (VRVP).
This is the precise area where buyers previously absorbed heavy supply, turning short-term weakness into a structural retest.
The VRVP reveals that most of Q3’s institutional positioning occurred between $86–89 and exactly where the rebound formed.
When price reacts within a high-volume node after a breakout, it signals validation as the market is effectively testing the conviction of those who built size during the base.
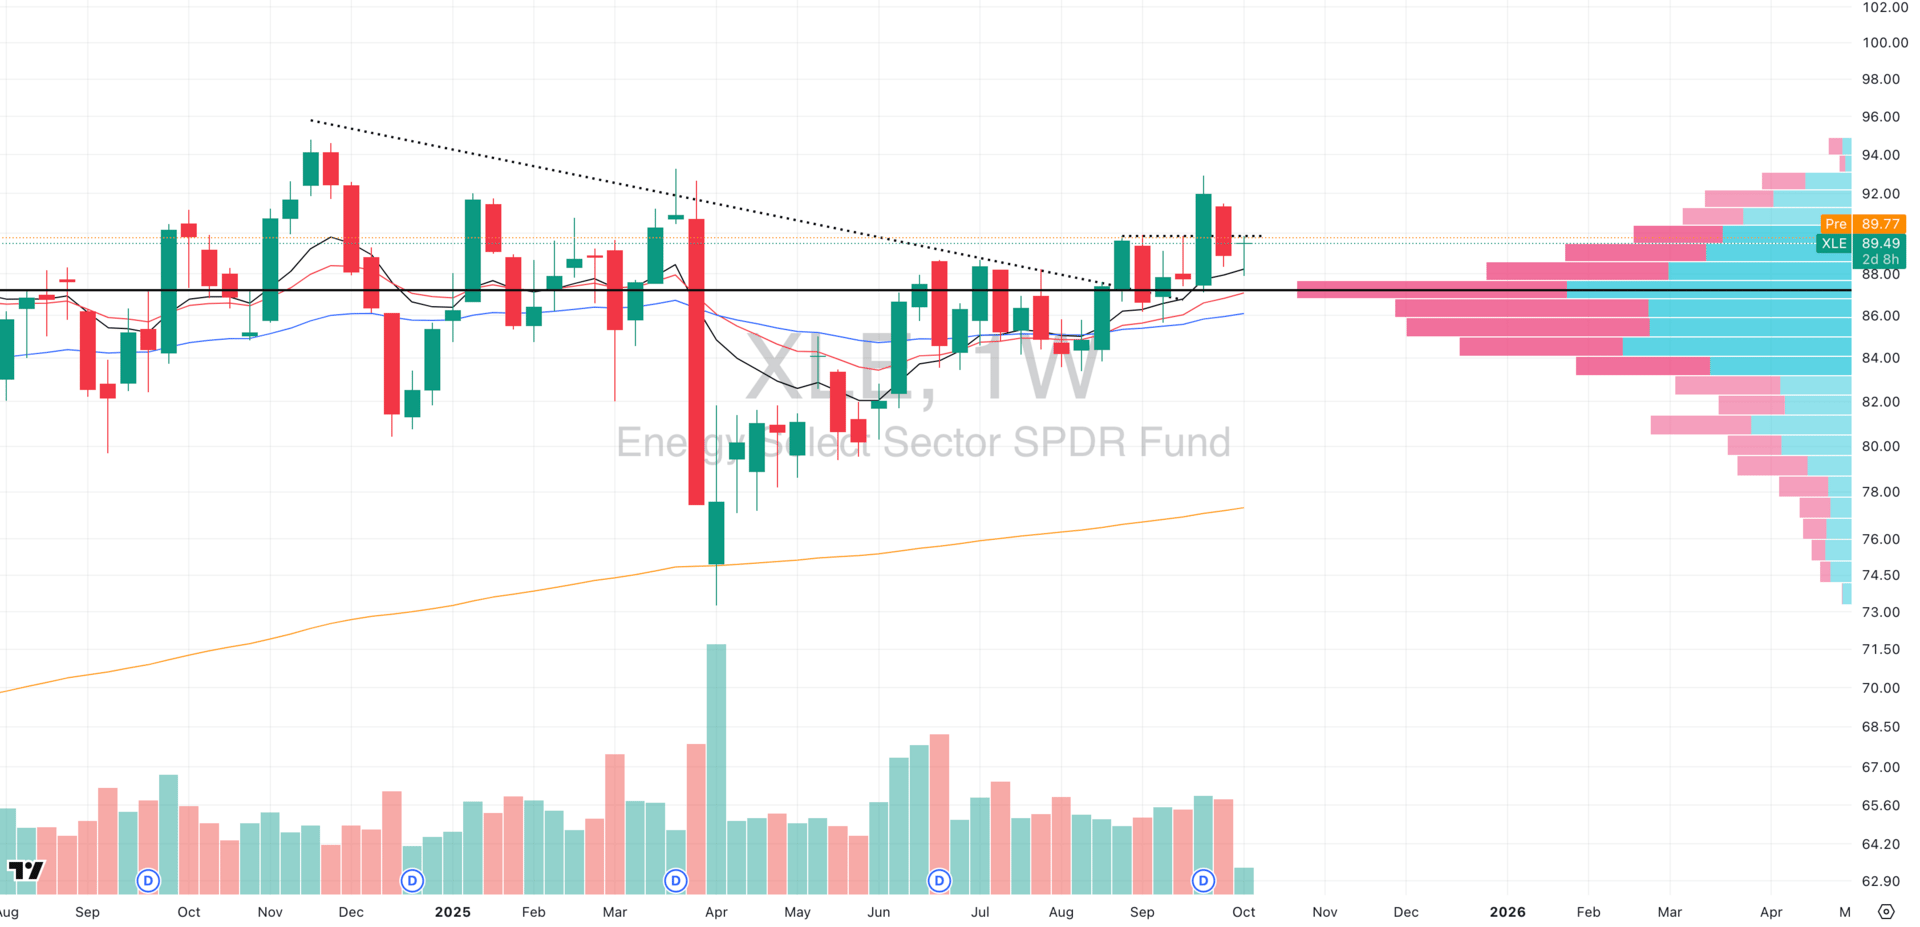
XLE VRVP Weekly Chart
Also, on the higher timeframe, XLE just performed its first pullback into the breakout zone after clearing both its weekly Point of Control (~$87) and a year-long descending resistance trendline dating back to November 2024. That level is now acting as support which is another a clear structural shift from overhead supply to demand zone.
This kind of technical rhythm — breakout → first retest → response off volume support is exactly what we like to see for signs of leadership rotation.
The group may not lead the tape day-to-day, but under the surface, XLE is quietly behaving like a sector preparing for another expansion leg

Did you find value in today's publication?This helps us better design our content for our readers |
Reply