- Swingly
- Posts
- Breadth Breakthrough: This Rally Just Got Real
Breadth Breakthrough: This Rally Just Got Real
In partnership with
OVERVIEW
Here’s What You Need To Know
Macro:
Futures flat after S&P 500’s all-time high.
Headlines (earnings beats from Delta, Pepsi, Costco; Oracle as AI beneficiary; gold pause above $4,000; oil volatility) are secondary.
Core focus = breadth expansion across equities, far more important than individual earnings or commodities.
Nasdaq (QQQ / QQQE):
Breadth broadened: 57%+ of Nasdaq above 20/50/200 EMA.
Best-case setup: mega-caps strong and participation expanding.
QQQE holding rising 10-EMA with accumulation → textbook Stage 2 action.
Midcaps (MDY):
Green hammer at $596 POC inside $593–597 demand zone.
Critical support defended repeatedly since September → credibility reinforced.
Above $600 unlocks $608 target. Broad buying even in laggards = bullish.
Small Caps (IWM):
Bounce off 10-EMA + $244–246 VRVP cluster (resistance turned support).
Respectful volume action, not forced defense.
Contracting on declining volume → coiled spring beneath $248 resistance.
Focused Stock – ALAB (Astera Labs):
340%+ run since April Stage 2 breakout, never broke weekly 10-EMA/daily 50-EMA.
Coiling under $220 resistance; six rejections since Oct 7 = accumulation, not distribution.
Breakout >$220 → targets $235–240, ~2% risk vs 8–10% upside.
Focused Group – CIBR (Cybersecurity ETF):
Ascending triangle under $78.5 multi-month resistance.
20-EMA held every pullback since Sept breakout → clear institutional demand.
Macro tailwind: security spend is non-discretionary.
Key components NET + PLTR tightly consolidating → likely to amplify breakout.

MARKET ANALYSIS
A Perfectly Timed Rescue: What A Market

There’s not much new on the macro front today. Futures are flat after the S&P 500’s fresh all-time high, and outside of Fed speak (Powell and others later today), catalysts are light with the government shutdown limiting data releases.
Earnings season is delivering its usual mix; Delta and PepsiCo both beat, Costco posted solid September sales, and Oracle was highlighted as another AI beneficiary.
Gold has also stalled just above $4,000 after a historic run, and oil remains jittery around OPEC+ supply questions.
But for our purposes, these headlines are background noise.
The real story is the expansion in equity strength. Breadth in Nasdaq and mid/small caps is improving in unison, confirming that leadership is no longer just a handful of mega-caps dragging indices higher.
That’s the development we’ve been waiting on, and it carries far more weight for our positioning than whether Costco’s comps beat by 50bps or whether gold cools off after a monster run.
Now, let’s get into the technicals.
Nasdaq
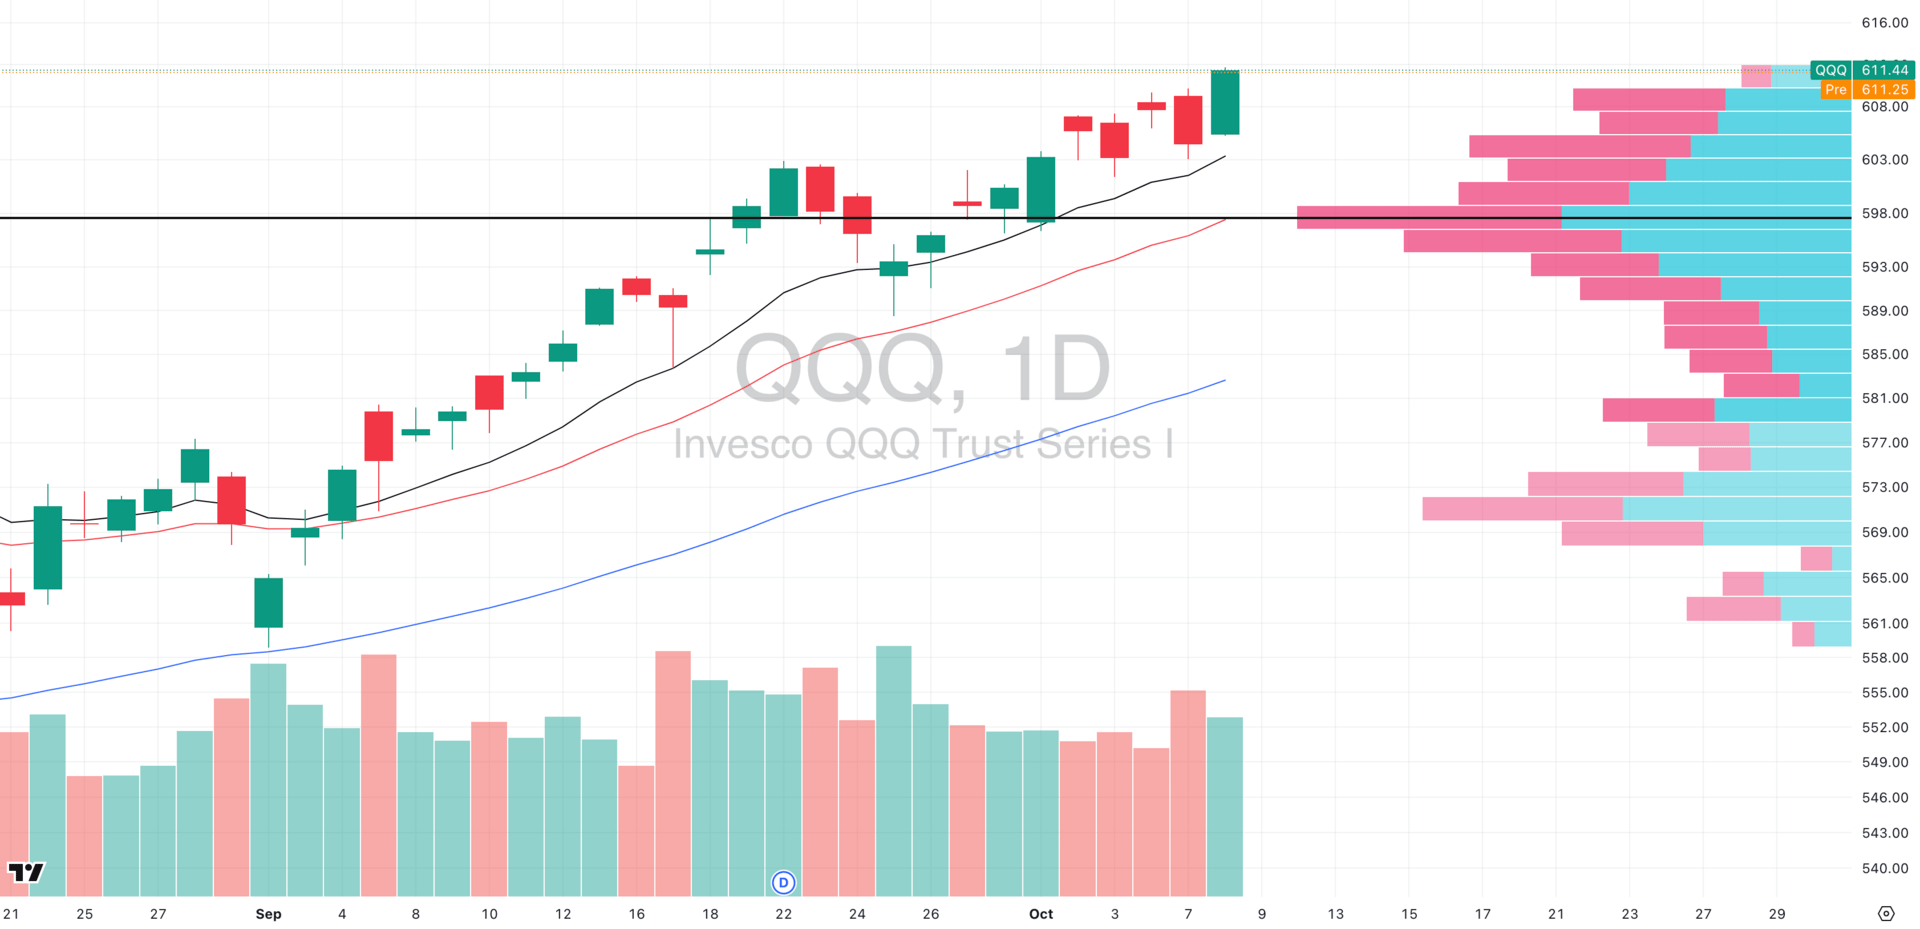
QQQ VRVP Daily Chart
QQQE VRVP Daily Chart
% over 20 EMA: 57.42% | % over 50 EMA: 55.44% | % over 200 EMA: 58.41%
Wednesday delivered the exact confirmation we were looking for: breadth finally broadened out.
The QQQ (cap-weighted) has pushed to new highs, showing that mega-cap leadership hasn’t lost any momentum even as breadth improves underneath.
That was best-case scenario we laid out in yesterday’s report.
The percentage of Nasdaq stocks above their 20-, 50-, and 200-day EMAs all pushed into the mid-50s, with the short-term (20-EMA) reading jumping nearly 10 points in a single session.
Why it matters: when breadth broadens, it means participation shifts from a handful of trillion-dollar names to the “average stock.” Instead of NVDA or AAPL carrying water, we saw buyers step in across the board.
That creates a healthier foundation for the uptrend as leaders keep driving, but now they’re being reinforced by followers rather than dragged down by them.
Technically, QQQE is holding its rising 10-EMA with higher lows throughout October. The volume profile shows accumulation at these levels and this is classic Stage 2 action with shallow pullbacks, firm support, expanding breadth on rallies.
S&P 400 Midcap
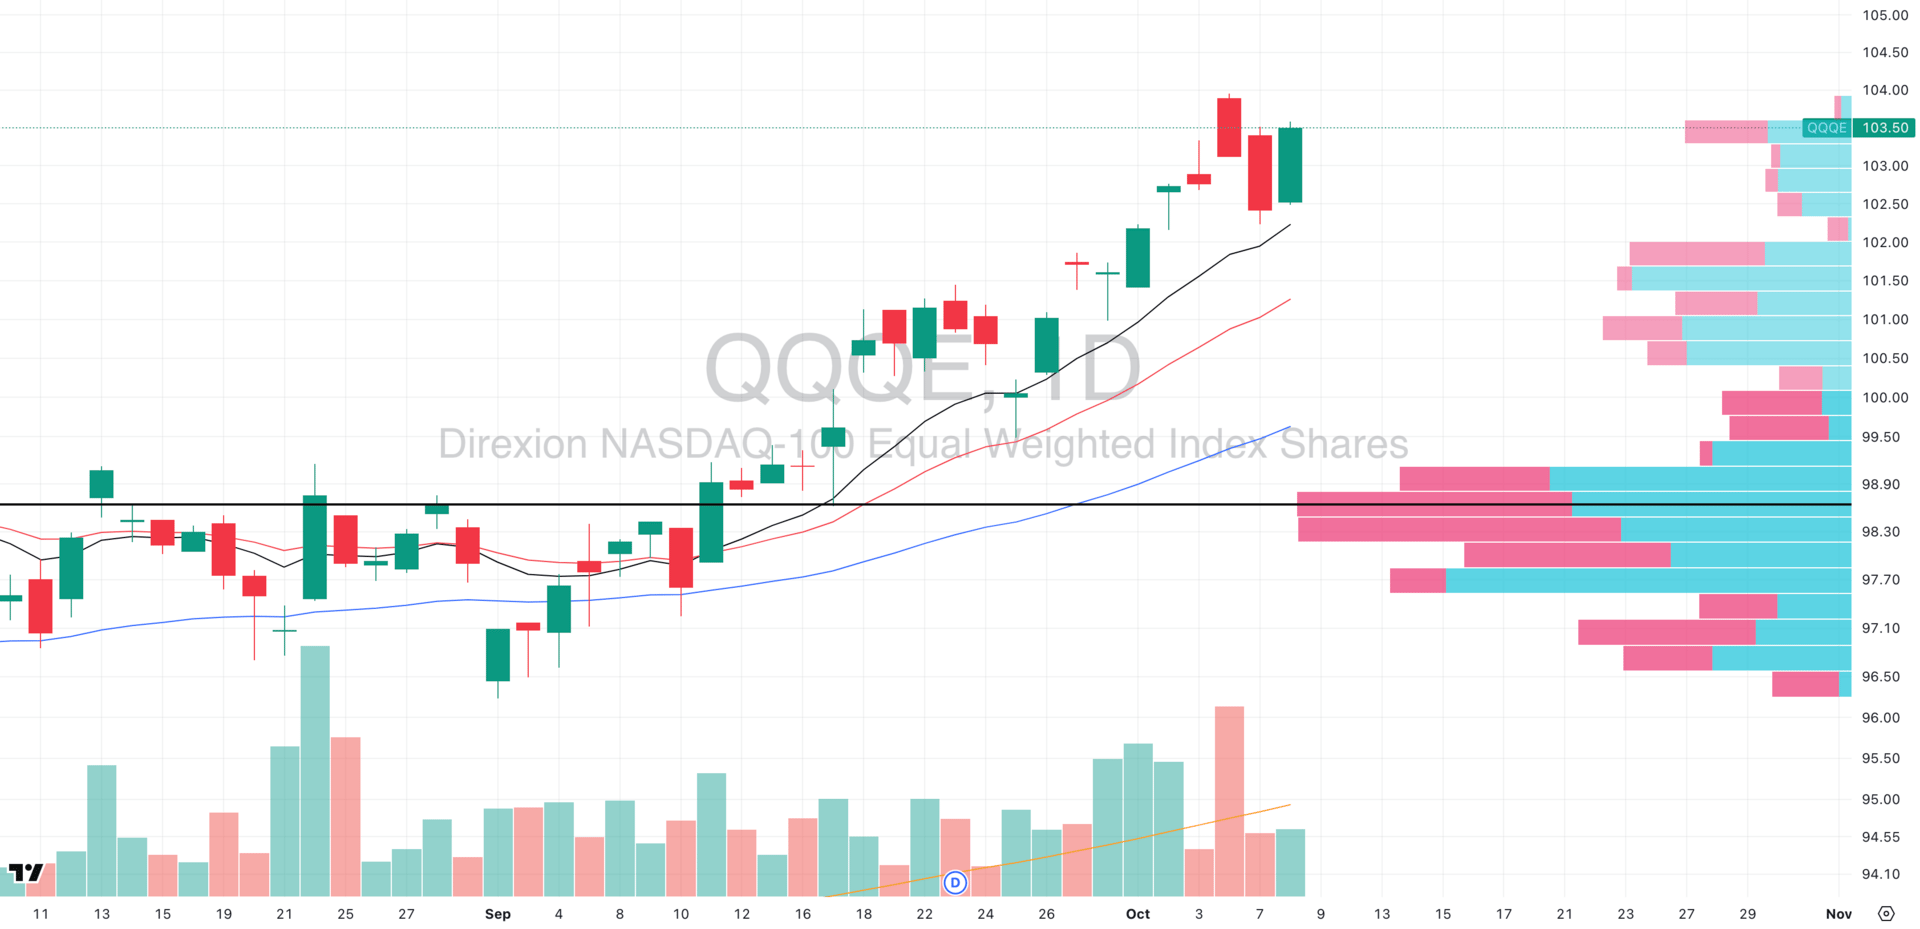
MDY VRVP Daily Chart
% over 20 EMA: 45.88% | % over 50 EMA: 50.62% | % over 200 EMA: 60.34%
Midcaps just printed their most important signal of the week: a green hammer at $596 POC, right in the middle of the $593–597 demand zone we’ve been tracking as the final line before distribution.
This level has been defended multiple times since the September breakout, each bounce reinforcing its credibility. Wednesday’s hammer adds another layer of confirmation as buyers are still stepping in where they’ve consistently shown up.
Context really matters: midcaps remain the weakest segment by cap size and that’s precisely why this bounce is significant.
When laggards catch a bid at critical support, it suggests strength is broadening.
The near-term pivot is $600 resistance, where heavy supply sits on the volume profile. Clearing and holding above that unlocks the next target at $608, the prior consolidation top.
Bottom line: Midcaps may be laggards, but their hammer off $596 demand is a bullish sign of broad-based buying. Hold $596 → reclaim $600 → target $608.
Russell 2000
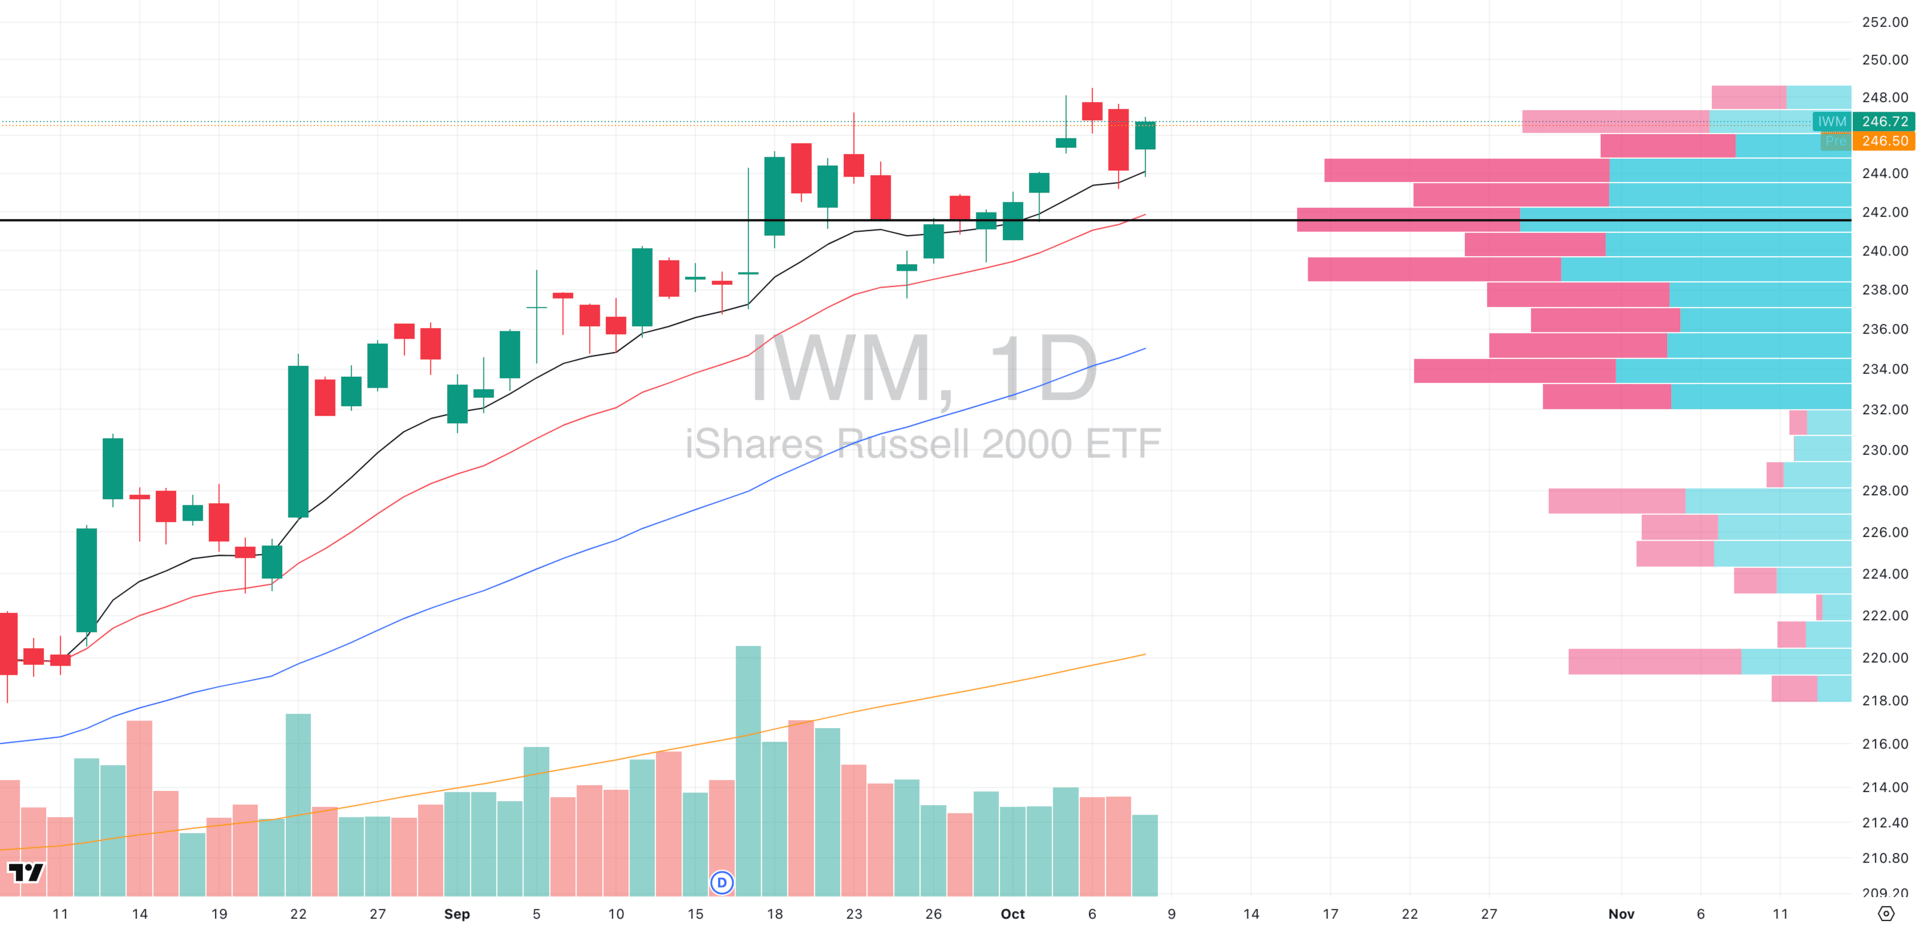
IWM VRVP Daily Chart
% over 20 EMA: 43.91% | % over 50 EMA: 52.46% | % over 200 EMA: 58.82%
Small caps delivered a clean bounce off the rising 10-EMA, right at the $244–246 VRVP cluster.
This is also a zone rejected IWM multiple times in September before the breakout and now it’s acting as support.
Levels with such heavy two-way volume become “value zones” in market memory. When they flip from capping upside to defending downside, it signals a shift in perception.
Wednesday’s precise bounce at that cluster, in confluence with the 10-EMA, confirms the level as genuine support.
Volume behavior strengthens the case. The bounce didn’t really need heavy buying as it held on normal flow, showing the level is respected, not desperately defended.
At the same time, price is now contracting into a tighter range with four straight sessions of declining volume. That’s a coiled spring: range narrows, participation fades, selling pressure exhausts.
The Smartest Free Crypto Event You’ll Join This Year

Curious about crypto but still feeling stuck scrolling endless threads? People who get in early aren’t just lucky—they understand the why, when, and how of crypto.
Join our free 3‑day virtual summit and meet the crypto experts who can help you build out your portfolio. You’ll walk away with smart, actionable insights from analysts, developers, and seasoned crypto investors who’ve created fortunes using smart strategies and deep research.
No hype. No FOMO. Just the clear steps you need to move from intrigued to informed about crypto.
FOCUSED STOCK
ALAB: A Market Leader Ready To Rally
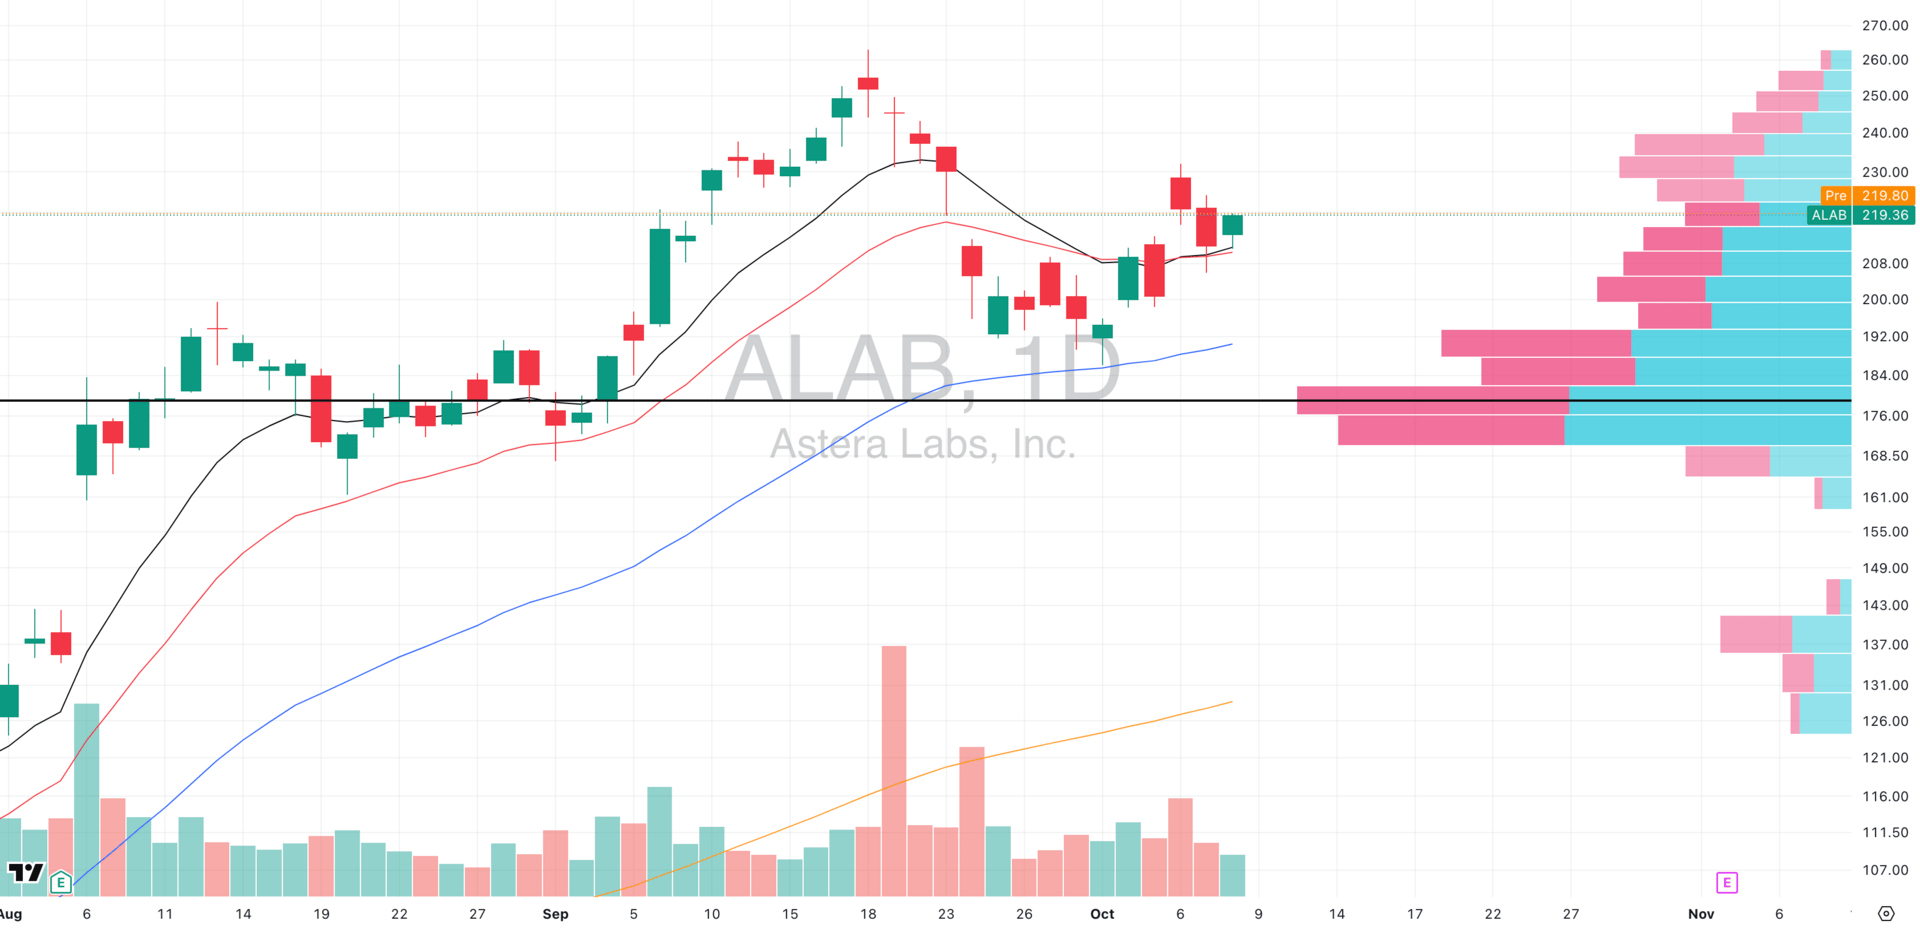
ALAB VRVP Daily Chart
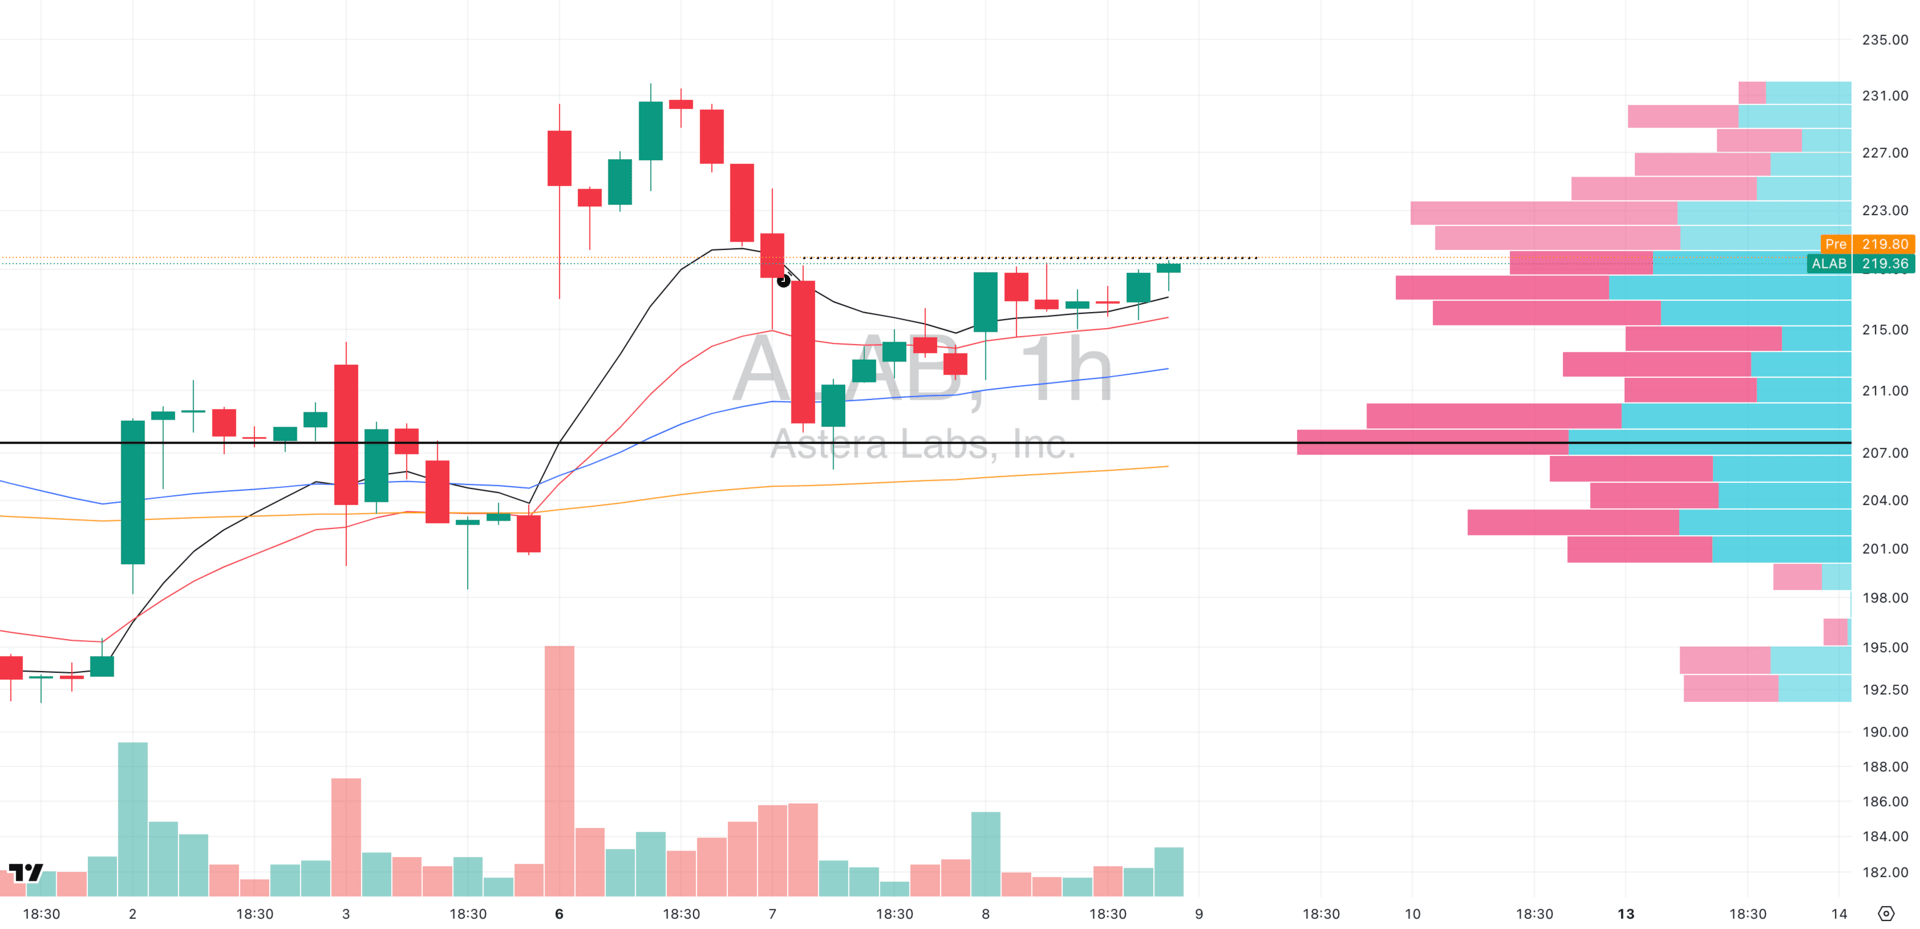
ALAB VRVP Hourly Chart
ADR%: 6.31% | Off 52-week high: -16.6% | Above 52-week low: +365.5%
Astera Labs checks every box of a true market leader: persistent strength, structural integrity, and alignment with the dominant AI semiconductor theme.
Since its Stage 2 breakout in April, ALAB has advanced 340%+ without once closing below its weekly 10-EMA or daily 50-EMA- an unmistakable sign of heavy institutional support.
Now, price is tightly coiled beneath $220 resistance. The daily chart shows classic contraction, while the hourly reveals six clean rejections since October 7, each test building pressure without breaking support. This is accumulation against a clear ceiling.
Relative strength at 98 vs SPX confirms ALAB’s leadership, with volume clustering at current levels showing positioning, not exit. Layer in the macro with AI megacaps driving, semis leading (NVDA, AMD, MU, etc), and the setup becomes obvious: ALAB sits at the heart of the strongest pocket of the market.
The Setup: Break above $220 on the hourly unlocks $235–240 initial targets (consolidation width). Stops sit just under $215, giving ~2% risk vs 8–10% initial upside. The tight coil suggests the move, when it comes, will be sharp.
FOCUSED GROUP
CIBR: Why We Are Big On Cybersecurity
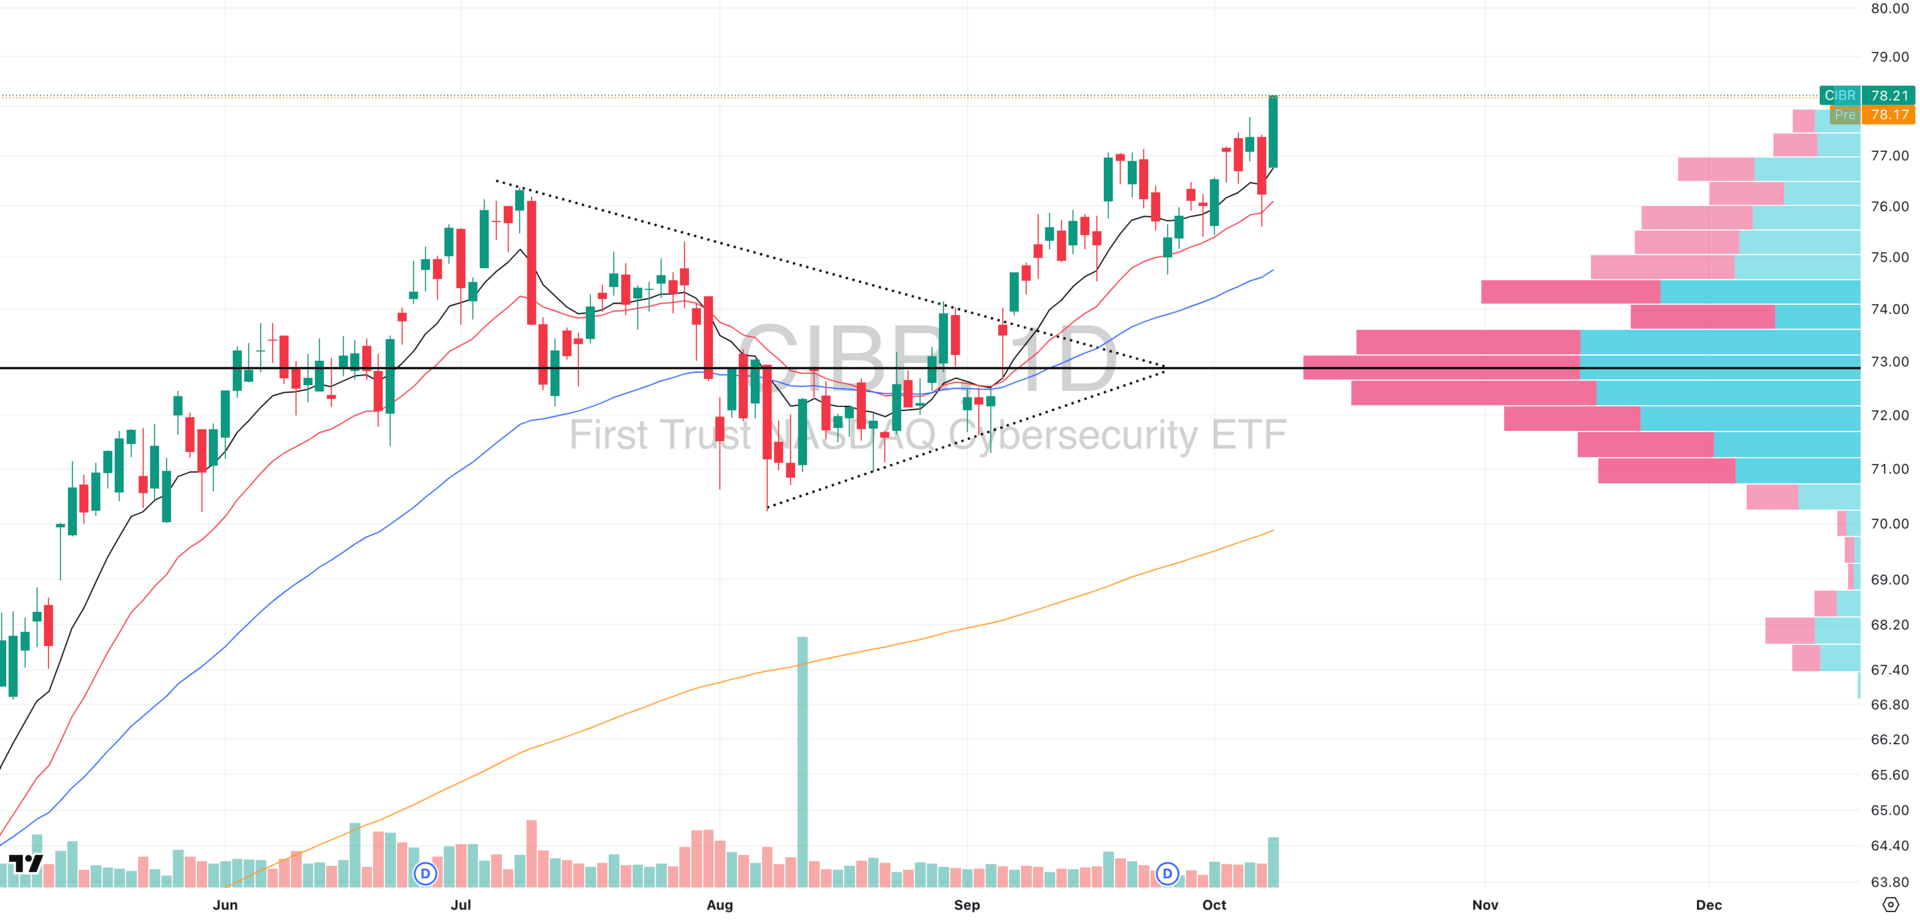
CIBR VRVP Daily Chart
Cybersecurity is one of the market’s strongest theme with secular growth plus geopolitical urgency. CIBR, the sector’s pure-play ETF, is coiling in a textbook ascending triangle right under multi-month resistance.
The daily chart shows higher lows pressing into a flat ceiling, with the 10-EMA providing consistent support.
Yesterday’s 1.71% bounce came directly off this level, and notably, the 20-EMA has held every pullback since the September 8 breakout with a clear sign of persistent institutional accumulation.
Volume also contracted into the apex, the classic setup before a breakout.
The backdrop only reinforces the chart. Security spend is non-discretionary: corporate breaches, nation-state attacks, and AI-driven threats guarantee budgets regardless of the macro. Cyber is one of the few true defensive growth sectors.
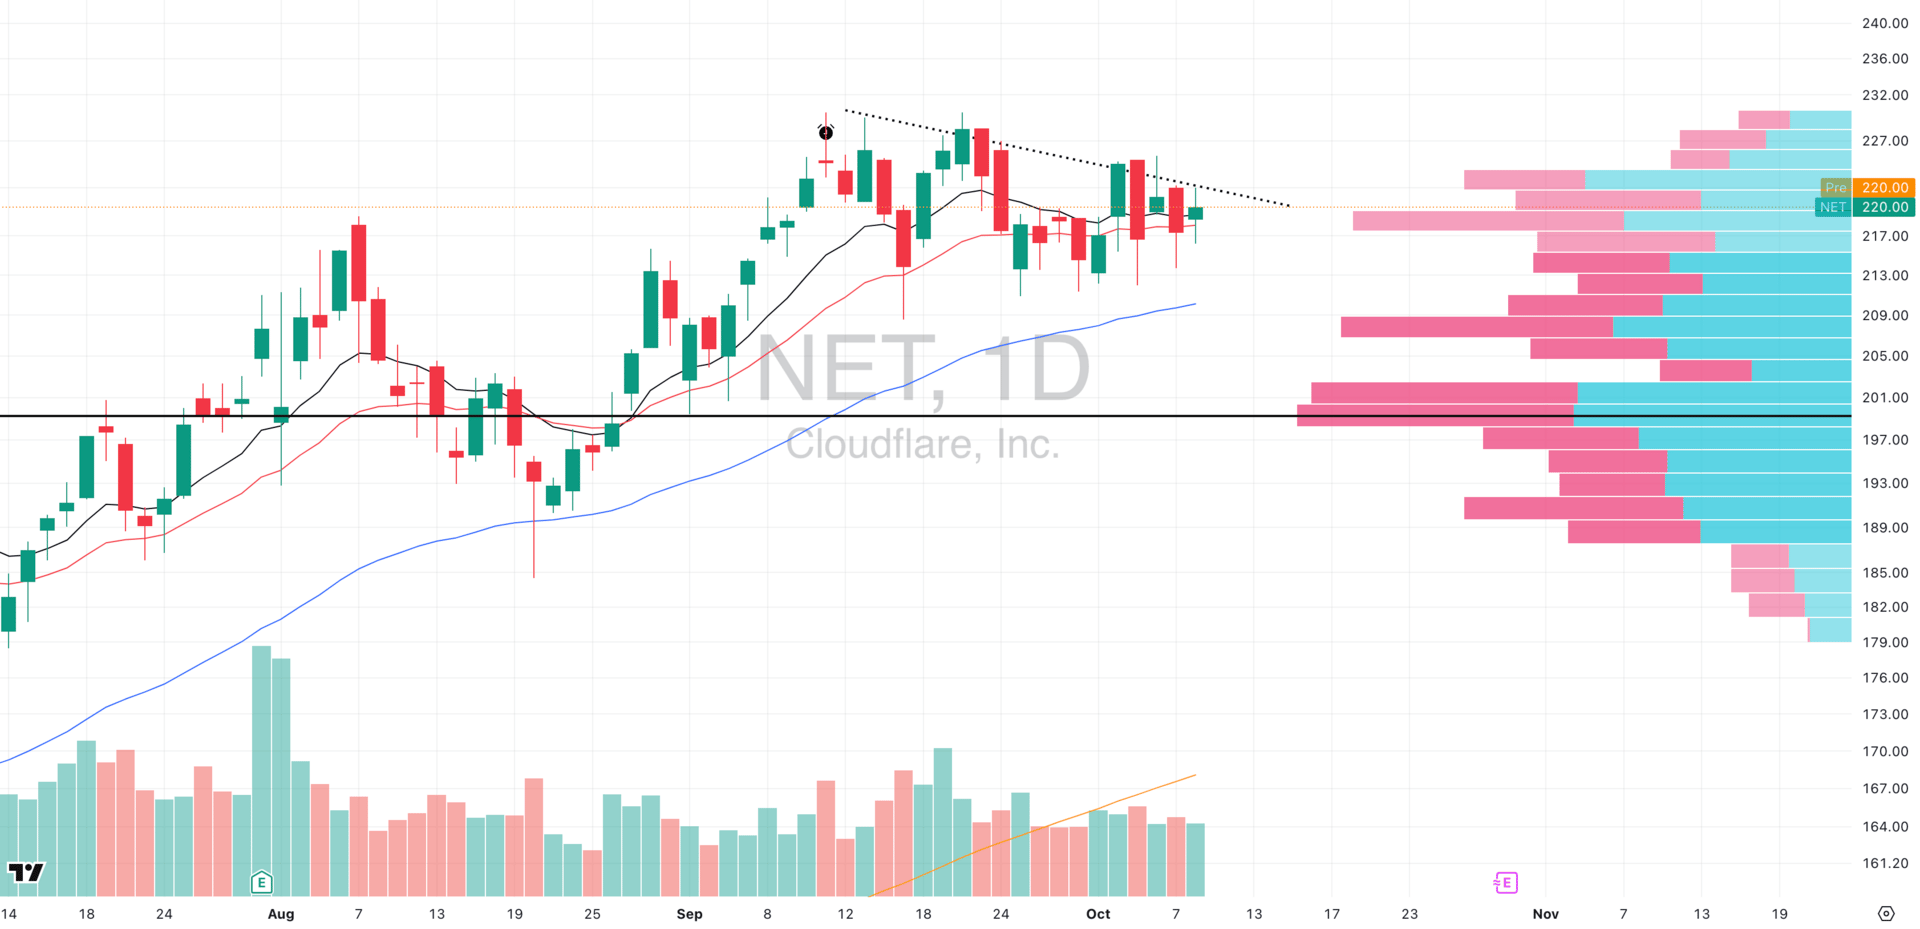
NET VRVP Daily Chart
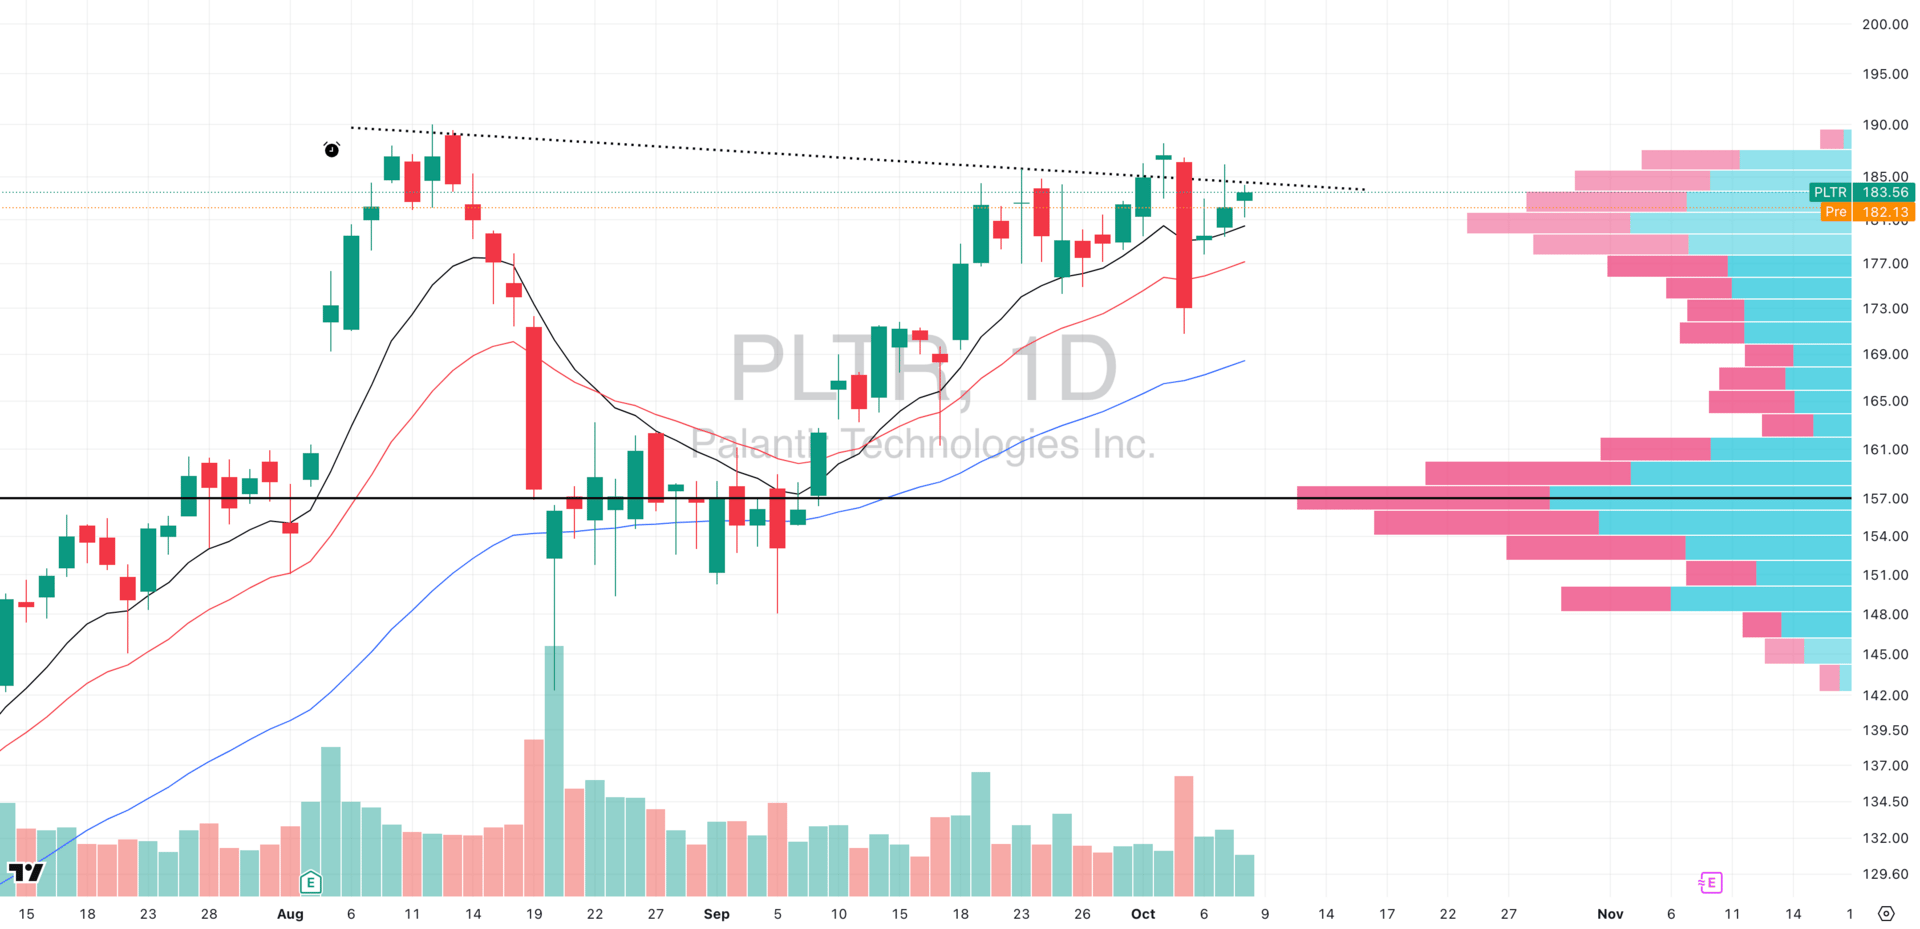
PLTR VRVP Daily Chart
Within CIBR, two standouts—NET (Cloudflare) and PLTR (Palantir)—are consolidating tightly beneath resistance.
When the ETF breaks, these leaders should provide amplified upside and we want to be there with size when they do.

Did you find value in today's publication?This helps us better design our content for our readers |
Reply