- Swingly
- Posts
- Bad To Worse: Why Stocks Are Selling Off
Bad To Worse: Why Stocks Are Selling Off


MARKET ANALYSIS
Here’s What You Need To Know
U.S. futures are under pressure again this morning after another weak session on Wednesday, with the Dow, S&P 500, and Nasdaq all falling sharply as inflation fears intensified and the market digested a much more difficult macro mix than it had been pricing even a week ago.
The Dow closed at a fresh 2026 low and fell below its 200-day moving average, while the S&P 500 finished only marginally above its own 200-day reference level.
The immediate catalyst is energy. Brent crude has surged back toward the mid-$110s after attacks on major Qatari and Iranian gas infrastructure, while WTI remains near the high-$90s.
That matters because this is no longer just a crude story; the market is now having to price the possibility of a broader energy complex shock, including LNG and refined products, at the exact moment inflation was already running hotter than expected.
Yesterday’s Federal Reserve meeting did very little to calm nerves. Rates were held steady, as expected, but Powell repeatedly emphasized uncertainty and made clear that the economic effects of the Iran war are impossible to model with confidence right now.
The market effectively heard what it least wanted to hear: the Fed is not in a position to offer much reassurance while oil is spiking and inflation risks are re-accelerating.
The broader fear now is stagflation. The hotter producer price data, combined with the jump in oil and gas, is forcing investors to consider a scenario where growth slows while price pressures rise again.
That is a very different setup from the one equities had been benefiting from earlier in the year, when the market was still assuming inflation would continue easing and eventually allow cleaner rate relief.
Importantly, the market is still not fully pricing a worst-case macro scenario. Even with this sell-off, several strategists continue to point to resilient earnings and a still-holding consumer as reasons why equities have not fully broken apart yet.
The key unknown remains duration. If the war drags on and energy remains elevated, that is the point where inflation and growth damage becomes much harder for markets to ignore.
Global markets are already reflecting that stress. European equities are broadly lower, with the Stoxx 600 down heavily and nearly every major regional market in the red, while Asian markets also sold off sharply overnight.
The fact that this is happening across both Europe and Asia tells you the pressure is no longer isolated to U.S. positioning alone.
There are still selective bright spots beneath the surface, but they are not strong enough yet to offset the macro drag.
Nvidia remains relatively stable after supportive developments around China sales, and Micron’s earnings were fundamentally strong even though the stock is under pressure on capex concerns. That tells you demand in the AI complex has not collapsed, but right now even strong company-level results are struggling to overpower the macro tape.
The political backdrop is also becoming harder to ignore. Reports around a potential Iran war spending request above $200 billion, even if not yet final, reinforce that markets are now dealing with a conflict that could become both economically and fiscally larger than originally expected. That naturally keeps risk appetite constrained.
The main takeaway for today is that the market is trying to absorb an inflation shock, an energy shock, and a policy environment that remains highly uncertain, all at the same time.
That is why every attempted bounce continues to be treated with skepticism, and it is why upside needs to be proven with real participation rather than simply assumed because indices are getting oversold.
At the same time, this is exactly the kind of environment where sharp countertrend rallies can emerge if fear gets fully priced in.
That does not make the macro backdrop constructive, but it does mean traders need to separate the longer-term macro risk from the shorter-term reality that very oversold markets can still produce violent upside mean reversion even inside a weak tape
Nasdaq
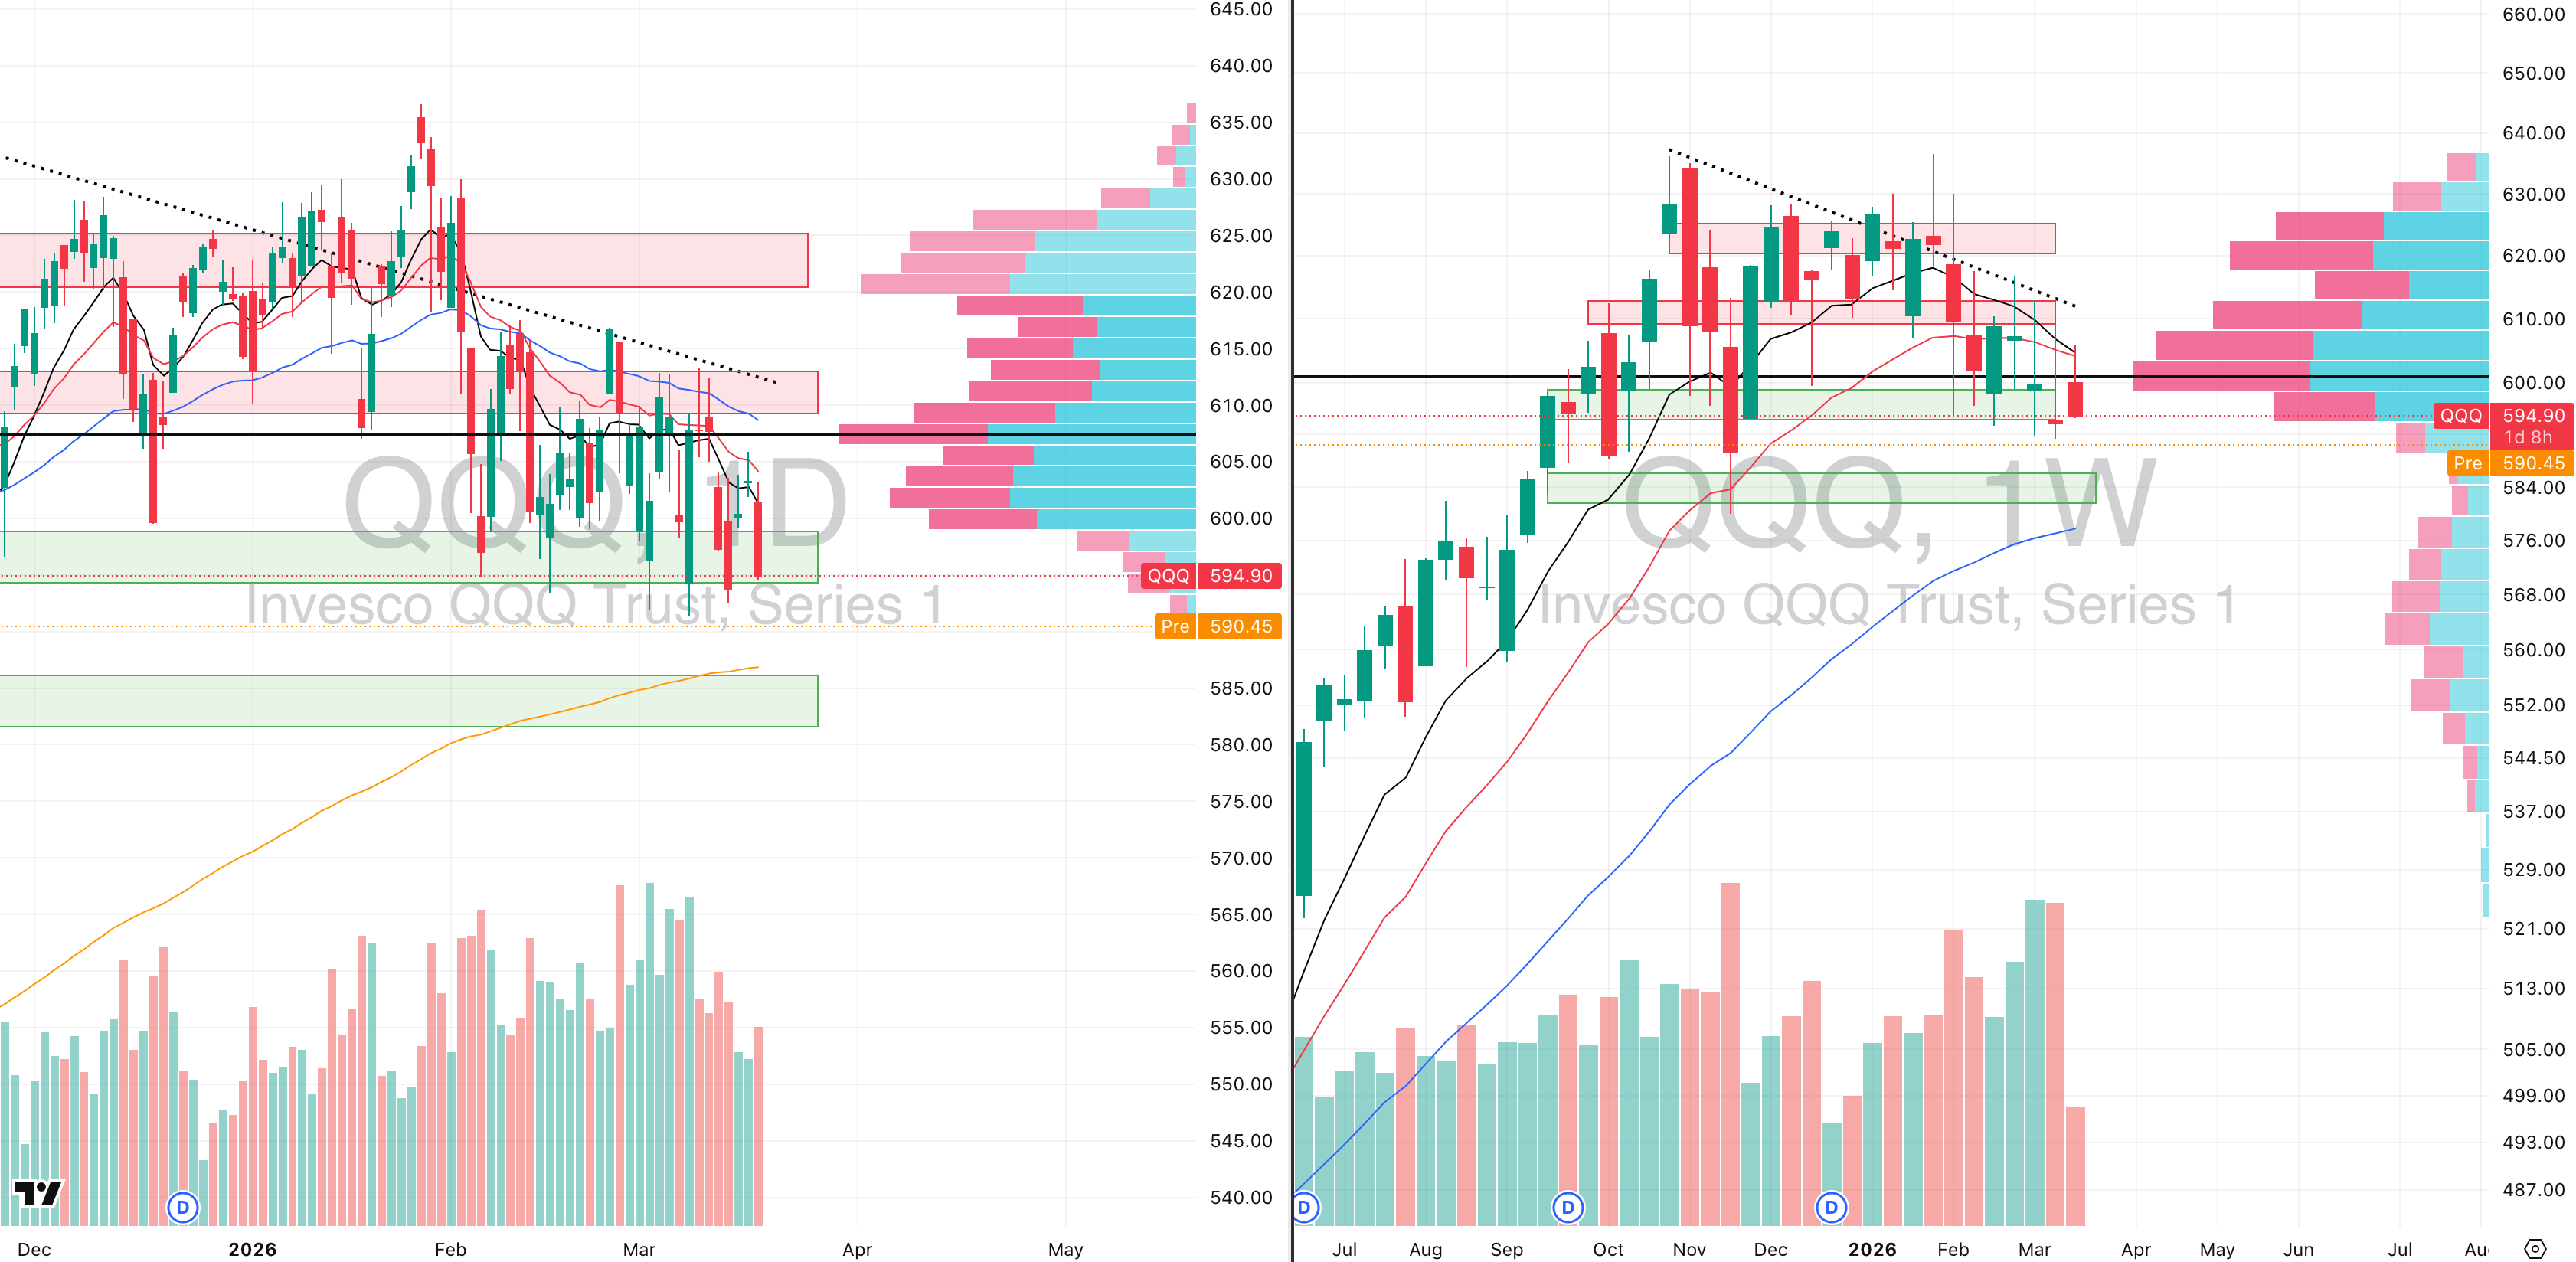
QQQ VRVP Daily & Weekly Chart
23.76%: over 20 EMA | 26.73%: over 50 EMA | 44.55%: over 200 EMA
It is becoming increasingly obvious that the QQQ sell-off is likely not finished, because we now have two full weeks of continued rejection at the declining 10-week and 20-week moving averages, with every rally into that cluster failing to attract meaningful follow-through.
This morning’s gap lower is especially important because price is now breaking below 593, which was the key demand zone we had been outlining repeatedly over the last few weeks as the first level that needed to hold to avoid a deeper continuation lower.
Once that level begins to fail, the most obvious next downside reference becomes 587, where the rising 200-day EMA now sits, representing roughly -1.42% downside from current levels.
That is the first level where we would expect meaningful technical reaction, simply because the 200-day EMA still carries considerable weight on the daily structure.
However, if that level does not stabilize price, the next major downside level sits materially lower at 576, where the rising 50-week EMA becomes the more important weekly support zone.
What continues to make the QQQ vulnerable is the steady supply build-up overhead. Every bounce over the last two weeks has been absorbed rather than expanded, and the macro backdrop is only adding further pressure.
With oil continuing to push higher and geopolitical uncertainty worsening, there is still significant weight pressing directly on large-cap growth.
One important additional concern from a breadth perspective is that the QQQ had previously retained stronger internal participation than the MDY or IWM, with materially more stocks still holding above their 20-day, 50-day, and 200-day moving averages.
That relative strength is now beginning to erode, which matters because it means the QQQ still has more internal deterioration available if selling pressure continues.
In simple terms, unlike the MDY and IWM — which are already deeply washed out below the 20–25% breadth zone — the QQQ still has more room for internal weakness to expand.
S&P 400 Midcap
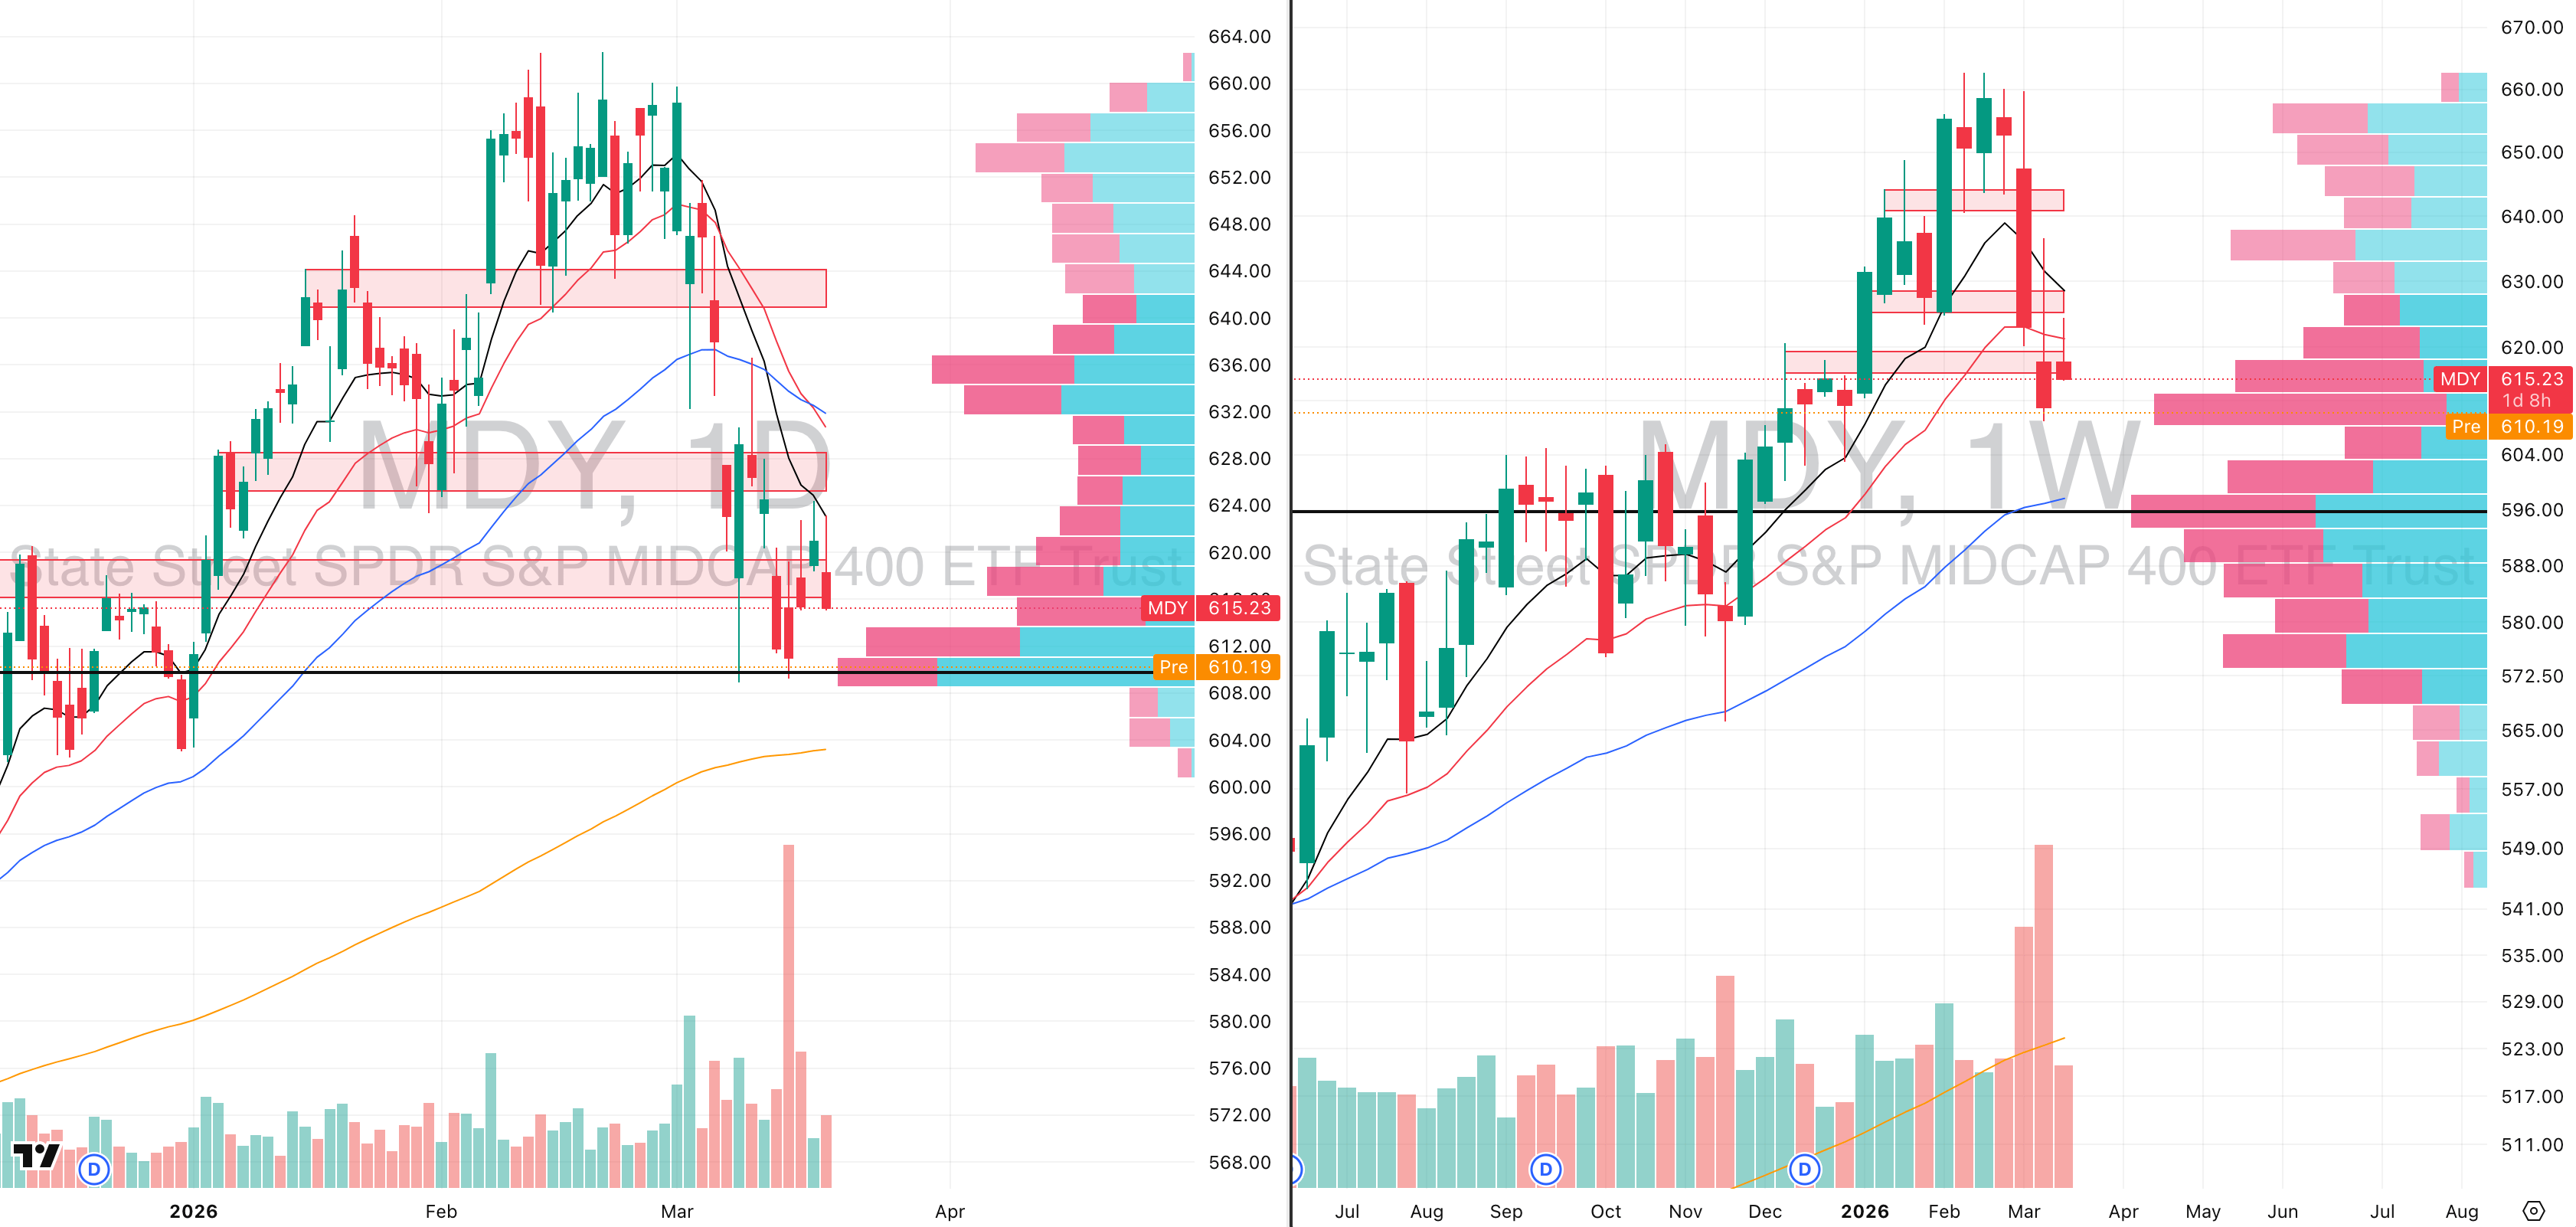
MDY VRVP Daily & Weekly Chart
17.25%: over 20 EMA | 24.50%: over 50 EMA | 44.25%: over 200 EMA
The MDY continues to validate the broader head-and-shoulders top structure we discussed earlier, and price is now effectively testing what appears to be the developing right-side shoulder near 610.
Although some short-term demand is visible here, structurally this level remains highly vulnerable.
Our expectation remains that price likely pushes lower again, with the most obvious next target being 604, where the rising 200-day EMA sits and where the weekly structure becomes more relevant.
More precisely, the strongest technical reference is 603, which is where the daily 200-day EMA and broader support cluster align.
Yesterday’s rejection was significant because price failed on 96% relative volume, which tells you participation was not absent — sellers were still clearly active at resistance.
That context matters because low-quality bounces often fail precisely when volume remains unable to expand positively into resistance.
As always with MDY, the weekly structure is the more important chart.
On the weekly timeframe, we now have two full weeks of repeated rejection at the declining 10-week and 20-week moving averages, which continues to confirm that intermediate supply remains dominant.
This remains one of the weakest segments in the entire U.S. market, and until that weekly supply is reclaimed, every bounce still looks temporary rather than durable.
Russell 2000
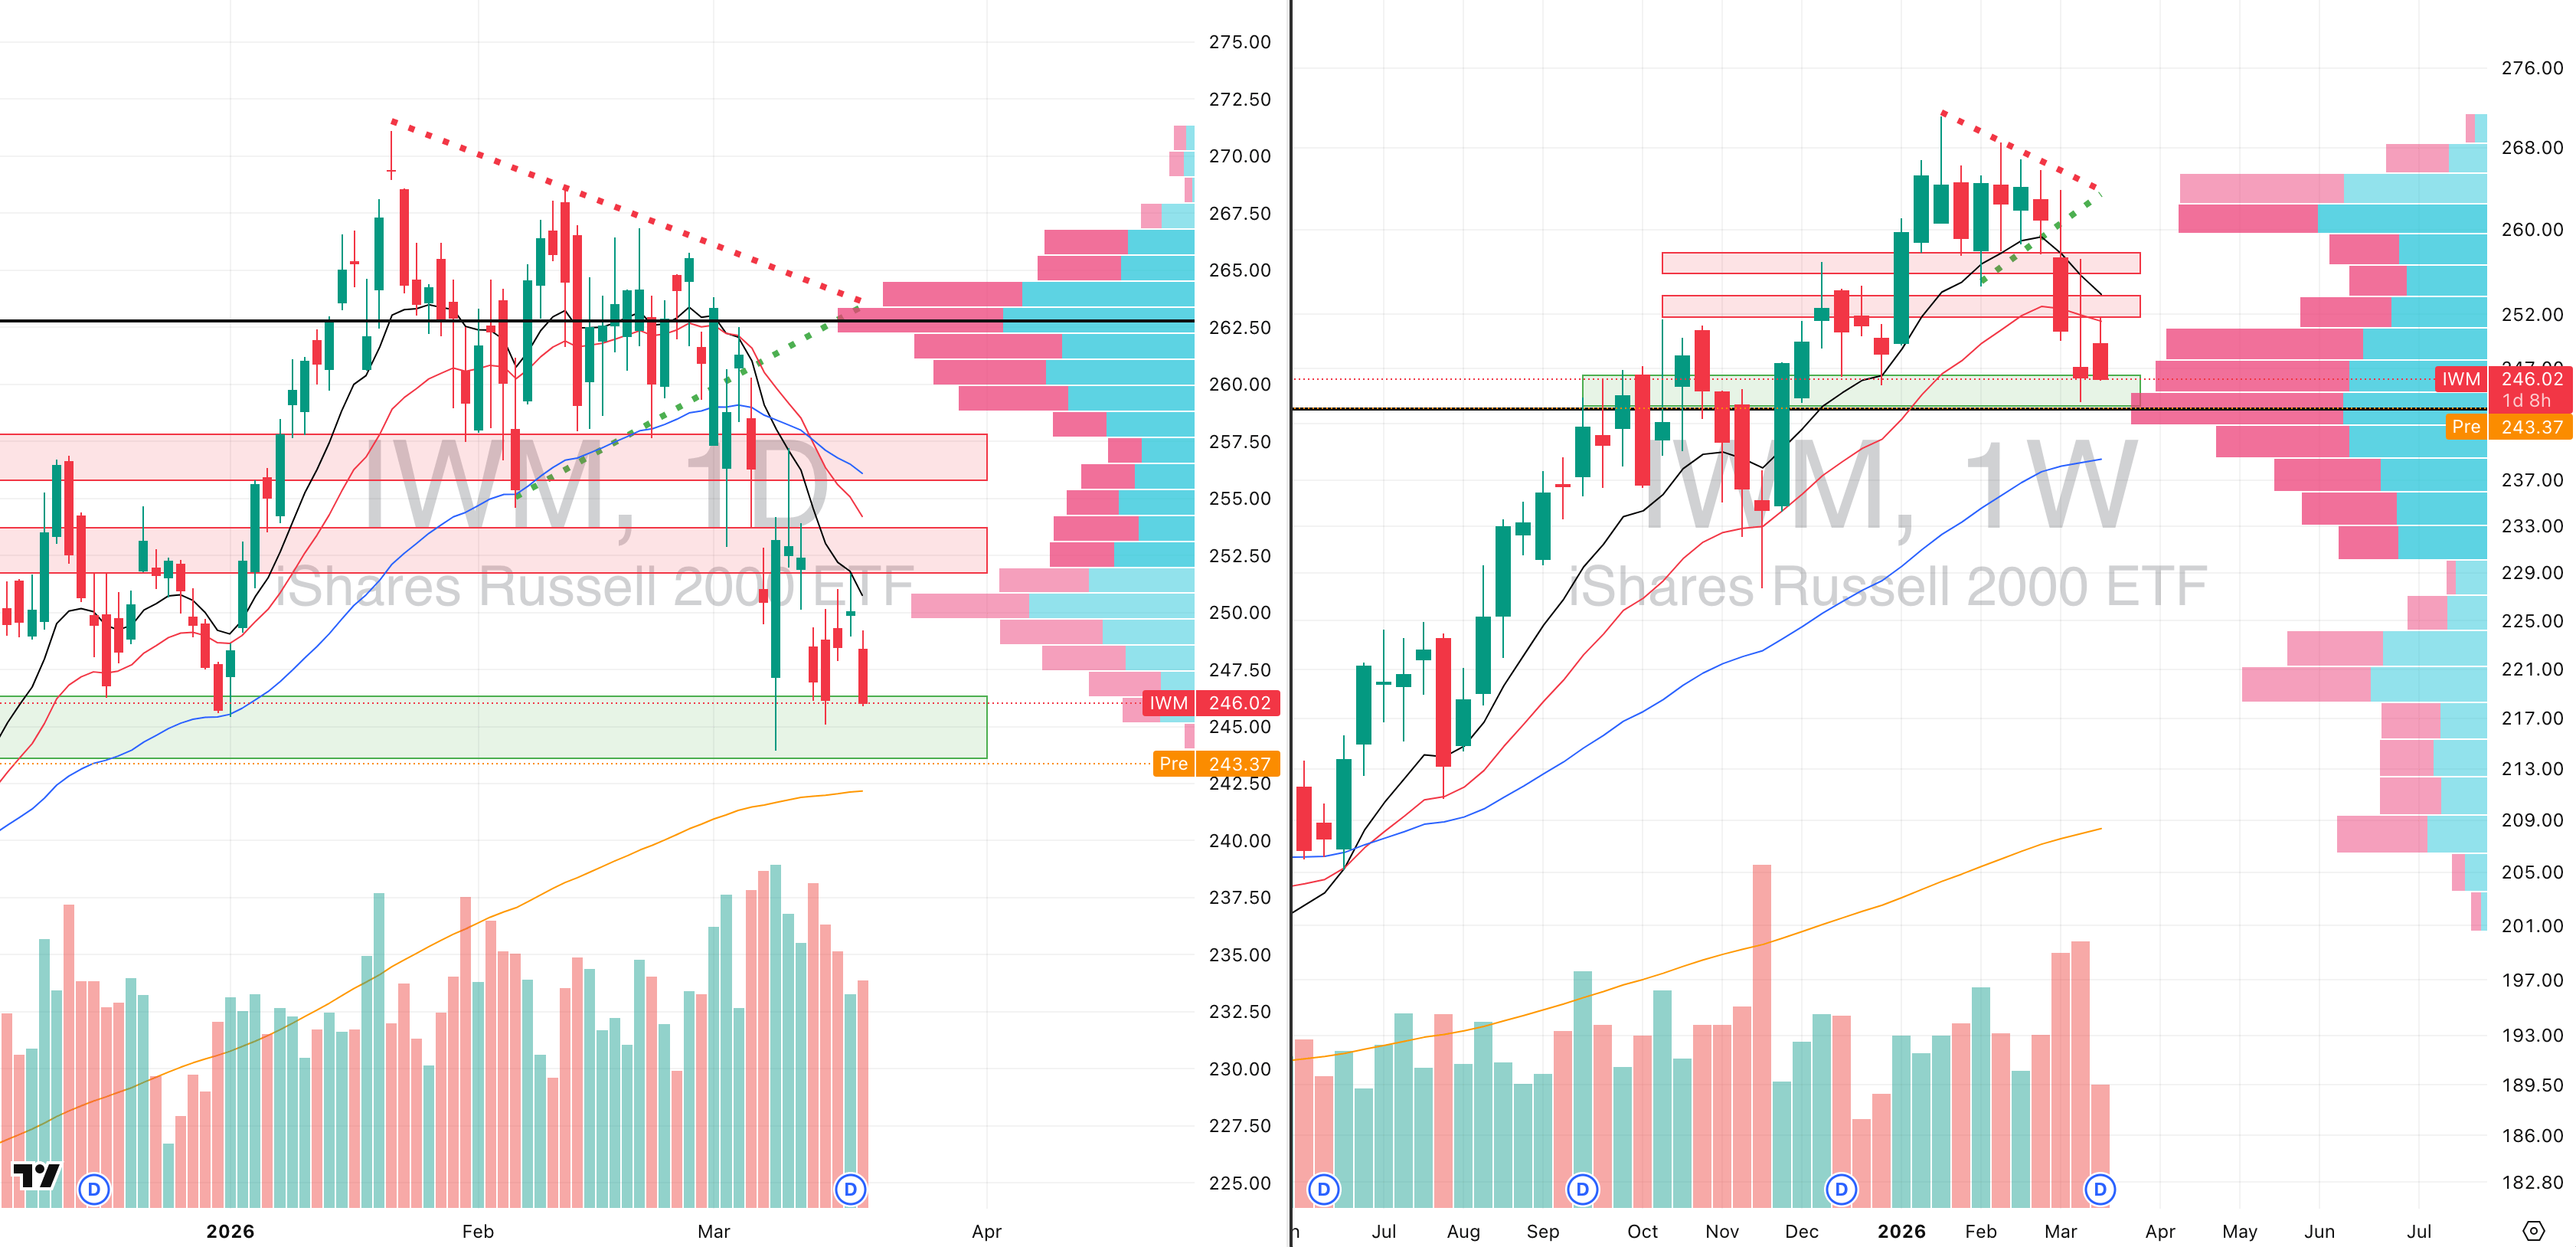
IWM VRVP Daily & Weekly Chart
19.57%: over 20 EMA | 24.42%: over 50 EMA | 44.62%: over 200 EMA
The MDY continues to validate the broader head-and-shoulders top structure we discussed earlier, and price is now effectively testing what appears to be the developing right-side shoulder near 610.
Although some short-term demand is visible here, structurally this level remains highly vulnerable.
Our expectation remains that price likely pushes lower again, with the most obvious next target being 604, where the rising 200-day EMA sits and where the weekly structure becomes more relevant.
More precisely, the strongest technical reference is 603, which is where the daily 200-day EMA and broader support cluster align.
Yesterday’s rejection was significant because price failed on 96% relative volume, which tells you participation was not absent — sellers were still clearly active at resistance.
That context matters because low-quality bounces often fail precisely when volume remains unable to expand positively into resistance.
As always with MDY, the weekly structure is the more important chart.
On the weekly timeframe, we now have two full weeks of repeated rejection at the declining 10-week and 20-week moving averages, which continues to confirm that intermediate supply remains dominant.
This remains one of the weakest segments in the entire U.S. market, and until that weekly supply is reclaimed, every bounce still looks temporary rather than durable.

Did you find value in today's publication?This helps us better design our content for our readers |
Reply