- Swingly
- Posts
- 🚨This Rally Is Unsustainable
🚨This Rally Is Unsustainable
In partnership with

OVERVIEW
Trend-Following Danger Zone
Shutdown uncertainty: First in 7 years → jobs report likely delayed → Fed flying blind into October.
Nasdaq (QQQ): Looks strong above $600, but advance is on declining relative volume → typical of digestion, not breakout.
Equal-Weight Nasdaq (QQQE): Flashing red flags → yesterday’s 188% vol hammer already erased premarket → shows underlying weakness.
Midcaps (MDY): Slipped below $596 demand shelf on 73% vol → breadth falling hard (%>20EMA only 38.8%) → looks more like exhaustion than digestion.
Small Caps (IWM): Bounce off 20EMA already failing in premarket → 1 month of progress erased → watch $239 shelf as make-or-break.
Breadth Divergence: Megacaps holding indices up, but mid/small caps showing distribution risk.
Focused Stock (BMNR): A leveraged ETH proxy controlling 2.2% of supply → consolidating over 50EMA → set up for explosive move if ETH bid continues.
Focused Group (Industrials): XLI broke out of multi-month chop with confirming volume; RSPN following → rotation potential emerging.

MARKET ANALYSIS
Protect Any Open Profits

Market Overview
The government shutdown has officially begun, the first in seven years, and markets are already showing signs of fatigue. After wrapping up their strongest third quarter since 2020, investors are shifting quickly from optimism to caution as the economic toll of a prolonged shutdown comes into focus.
Hundreds of thousands of federal workers are now furloughed, and critical agencies like the Bureau of Labor Statistics are halting operations. That means Friday’s all-important jobs report (a key gauge for the Federal Reserve) will likely be delayed, forcing policymakers to navigate the next rate decision with far less visibility than usual.
The real concern isn’t the shutdown itself — it’s the uncertainty around how long it will drag on and what economic data will go dark in the meantime. Private data sources like ADP payrolls and PMI readings are suddenly taking center stage.
Nasdaq

QQQ VRVP Daily Chart
% over 20 EMA: 52.47% | % over 50 EMA: 48.51% | % over 200 EMA: 58.41%
The QQQ continues to look strong on the surface, pressing above $600. But the advance over the last four sessions has come on steadily declining relative volume and showing a pattern that’s far more typical of consolidation phases than true breakouts.
That suggests digestion here is the higher-probability path, not clean continuation.

QQQE VRVP Daily Chart
The more important signal comes from the equal-weight Nasdaq (QQQE). Yesterday’s session saw a 188% relative volume hammer off $101, which normally screams accumulation.
But the fact that this entire move has already been unwound in pre-market with QQQE set to gap back under $101 toward its rising 10EMA at ~$100.60 shows you the weakness beneath the surface.
That narrowing leadership raises fragility risk. If breadth doesn’t re-engage, QQQ’s highs become more vulnerable than they look on the surface.
S&P 400 Midcap

MDY VRVP Daily Chart
% over 20 EMA: 38.84% | % over 50 EMA: 48.37% | % over 200 EMA: 58.89%
Midcaps are struggling, and yesterday’s session highlighted it clearly. Volume came in at just 73% of the 20-day average, a weak effort as price slipped back below the key $596 demand zone that had acted as support since late August.
The bigger concern is not the lack of progress, but the quality of participation.
Breadth inside the midcap complex has been steadily deteriorating: only 38.8% of components sit above their 20EMA, while even the 50EMA breadth is sliding (48.3%).
Structurally, MDY has failed multiple times to clear the $600 ceiling. Each attempt higher has been met with sellers, while demand keeps thinning out. Combine that with declining relative volume during bounces, and it’s hard to frame this as healthy digestion… it looks more like exhaustion.
Russell 2000
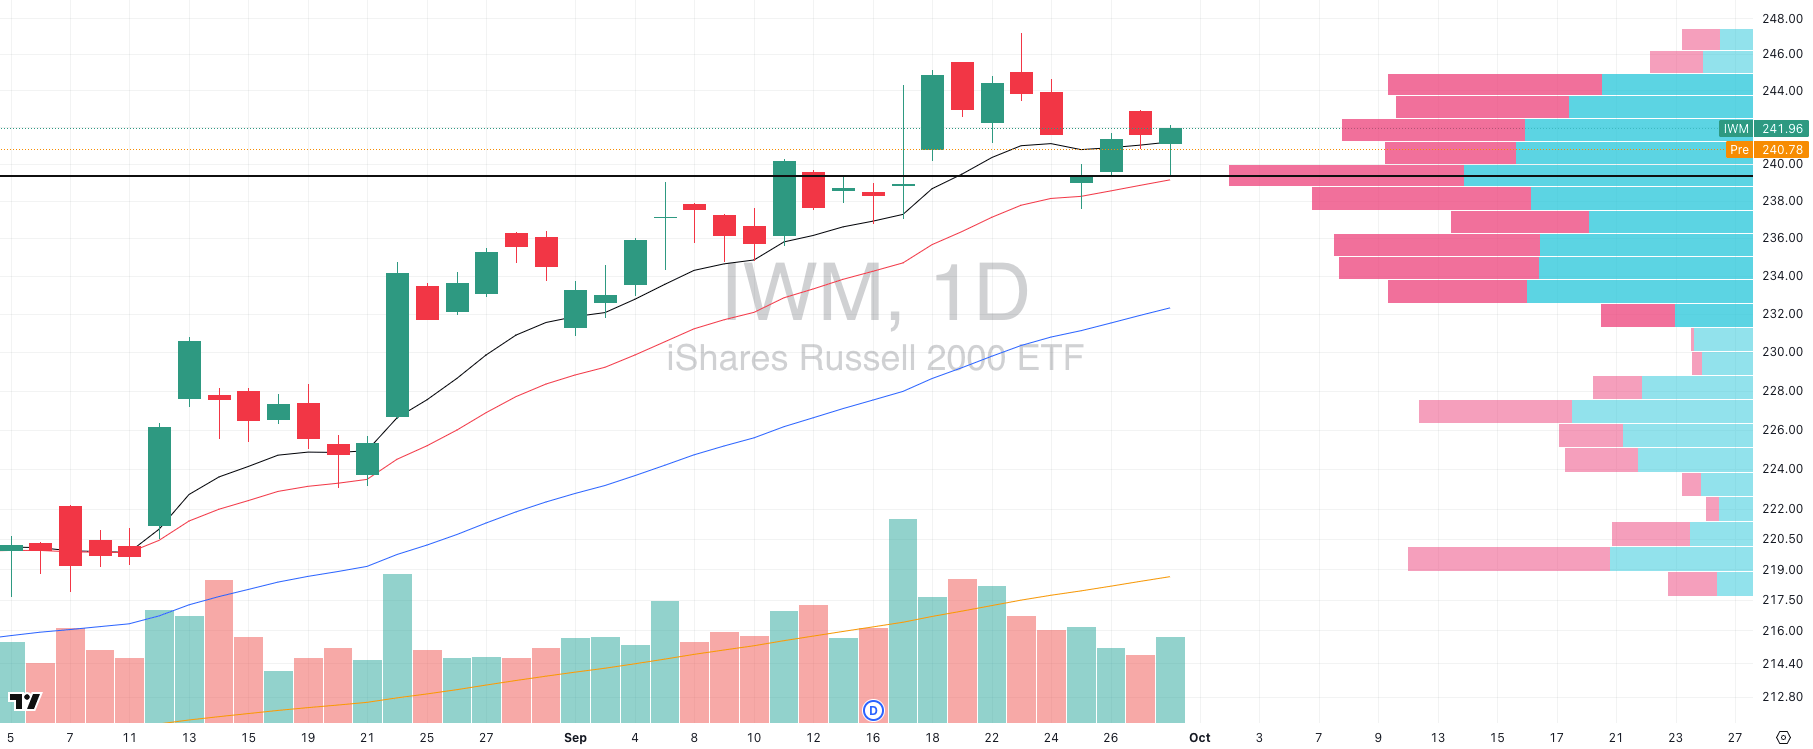
IWM VRVP Daily Chart
% over 20 EMA: 41.47% | % over 50 EMA: 55.18% | % over 200 EMA: 59.95%
Small caps staged a constructive bounce yesterday off the rising 20-day EMA, which also aligns with the point of control (POC) around $239. That defense came on 92% relative volume, enough to suggest buyers were active at the shelf but nothing special.
But the problem is follow-through. In premarket, IWM is already breaking back below its daily 10EMA, effectively erasing a month’s worth of progress.
ThIn 2021, IWM spent months churning sideways while SPX kept printing highs and by the time breadth collapsed, the top was already in. We’re seeing the same early symptoms here: leadership narrowing into megacaps, with the Russell unable to sustain trend despite liquidity support.
Stop Drowning in Market News. Focus On Making Money.

Every day: 847 financial headlines, 2,300 Reddit stock mentions, 156 Twitter trading threads, 12 IPO updates, 94 crypto developments.
Your problem isn't lack of information; you have too much.
While you're scanning headlines wondering what matters, profitable trades slip by. The signal gets buried in noise.
What if someone did the heavy lifting for you?
Stocks & Income reads everything:
Twitter traders
Reddit buzz
IPO announcements
Crypto insider takes
Crowdfunding opportunities
Market news
Then we send you only what can actually move your portfolio.
No fluff. No useless news. Just actionable stock insights in 5 minutes.
We track every source so you don't have to. You get the 3-5 opportunities worth your time, delivered daily.
Stop wasting time on useless “investing news” and start thinking critically about real opportunities in the stock market.
Stocks & Income is for informational purposes only and is not intended to be used as investment advice. Do your own research.
FOCUSED STOCK
BMNR: Ethereum Leverage on Steroids

BMNR VRVP Daily Chart
ADR%: 8.44% | Off 52-week high: -67.7% | Above 52-week low: +2594%
BMNR is not your typical swing candidate as it’s essentially a leveraged derivative on Ethereum’s cycle. The company controls over 2.2% of the total ETH global supply, which is an astonishing figure when you think about how concentrated crypto ownership usually is.
With ETH starting to pick up pace again, BMNR is structurally positioned as one of the highest-beta equities tied to that move.
Leadership matters here too. BMNR is led by Tom Lee, one of the most respected investors in the digital asset space, which adds credibility to what would otherwise be written off as a speculative side play.
In July, BMNR ran from the low teens into the $140s in just a handful of sessions which should serve as a reminder of how violently this thing can move.
Since then, it’s digested in textbook fashion: a long, orderly consolidation pinned around its rising 50-day EMA. That base-building has compressed volatility while allowing supply to clear, which is exactly what you want to see before the next expansion.
If ETH’s bid continues to firm, BMNR is set up as the equity-market proxy that could rip far harder than the underlying.
FOCUSED GROUP
XLI: The Next Group To Rotate Into?

XLI VRVP Daily Chart
Industrials have been a sleeper sector for months, stuck in a frustrating chop zone, but yesterday finally delivered a constructive shift.
Industrials (XLI) quietly pushed to fresh highs yesterday, closing at $154.23. That move matters because it finally cleared the sticky resistance zone that’s capped price since late July.
Importantly, this breakout attempt came with volume confirming the push through the upper end of the visible range (VRVP) node around $151. That’s the highest demand shelf of the past three months.

RSPN VRVP Daily Chart
This alignment between XLI and RSPN is exactly what you want to see when gauging rotation: the heavyweights are leading, but the rest of the sector is following.
Structurally, both ETFs are emerging from multi-month consolidations, which is the textbook Stage 1 → Stage 2 transition that precedes sustainable uptrends.
The takeaway here is not to suddenly crown Industrials the new leaders, but to recognize that their tape is improving in tandem.
If XLI holds this breakout on volume and RSPN continues to push higher, Industrials shift from “dead money” to “developing rotation play.”
That’s where you want your scans ready looking for clean Stage 2 names within the group that can act as secondary beneficiaries if this broadening strength sticks.

Did you find value in today's publication?This helps us better design our content for our readers |
Reply