- Swingly
- Posts
- A Very Big Move Is Building: Here’s What Comes Next
A Very Big Move Is Building: Here’s What Comes Next
In partnership with

OVERVIEW
What You Need To Know
Macro
Risk sentiment soft after Thanksgiving, with futures slightly red and tech leaders fading; global jitters (BoJ, crypto) adding pressure.
Despite the wobble, November closed strong with multiple weekly reversal patterns confirmed across indices.
Nasdaq (QQQ / QQQE)
Both QQQ and QQQE staged a 5-day breakout, clearing the declining October trendline and rejecting the head-and-shoulders risk.
A controlled pullback into $611–$609 is now expected and healthy; this retest will determine whether last week’s breakout becomes a trend reset.
S&P 400 Midcap (MDY)
Printed and confirmed a perfect weekly Morning Star reversal — strong evidence the mid-cap washout is done.
Immediate rejection at the $604–$608 multi-month supply shelf is normal after a +4% week; pullback toward $596 POC expected.
Russell 2000 (IWM)
Now pulling back into the $244 POC, the exact level buyers should defend; next support at $242 (EMA cluster).
A flag under $248–$251 supply would set up the next leg higher if demand holds.
Focused Stock: VIST
VIST is one of the cleanest setups in Energy: reclaimed the 200-week EMA, showing institutional support.
XOP is coiling hard; if the sector breaks out, VIST is positioned as a first-mover leader.
Focused Group: XLB (Materials)
XLB has printed a double-bottom with perfect demand at $84.50–$85, confirming structural support.
Reclaimed all major EMAs (10/20/50D + 200W) and strengthening as precious metals (XME, gold, silver) accelerate.

MARKET ANALYSIS
5 Days of Strength. Now the Real Test Begins.

Risk sentiment is rather soft this morning as investors return from Thanksgiving: and we see U.S. equity futures are slightly red, tech leadership (NVDA, PLTR) is fading premarket.
Global markets are also jittery as Japan sold off after the BoJ signaled rate hikes may land this month, while cryptocurrencies, Coinbase, and Strategy shares all slid
Despite the wobble, November still closed strong and we did see a number of reversal patterns last week, the S&P 500 logged a seventh straight monthly gain, powered by the late-month AI rebound, even as bubble concerns remain in the background.
Key macro week ahead as PMIs, ADP employment and Powell’s remarks will shape expectations into the Dec. 10 FOMC. Markets currently price ~87% odds of a third consecutive rate cut, though the recent jump in Treasury yields shows tightening financial conditions short-term.
Political noise is rising as President Trump says he’s chosen a replacement for Jerome Powell, with prediction markets heavily favoring Kevin Hassett which can lead to a potential volatility spark if confirmed.
Nasdaq
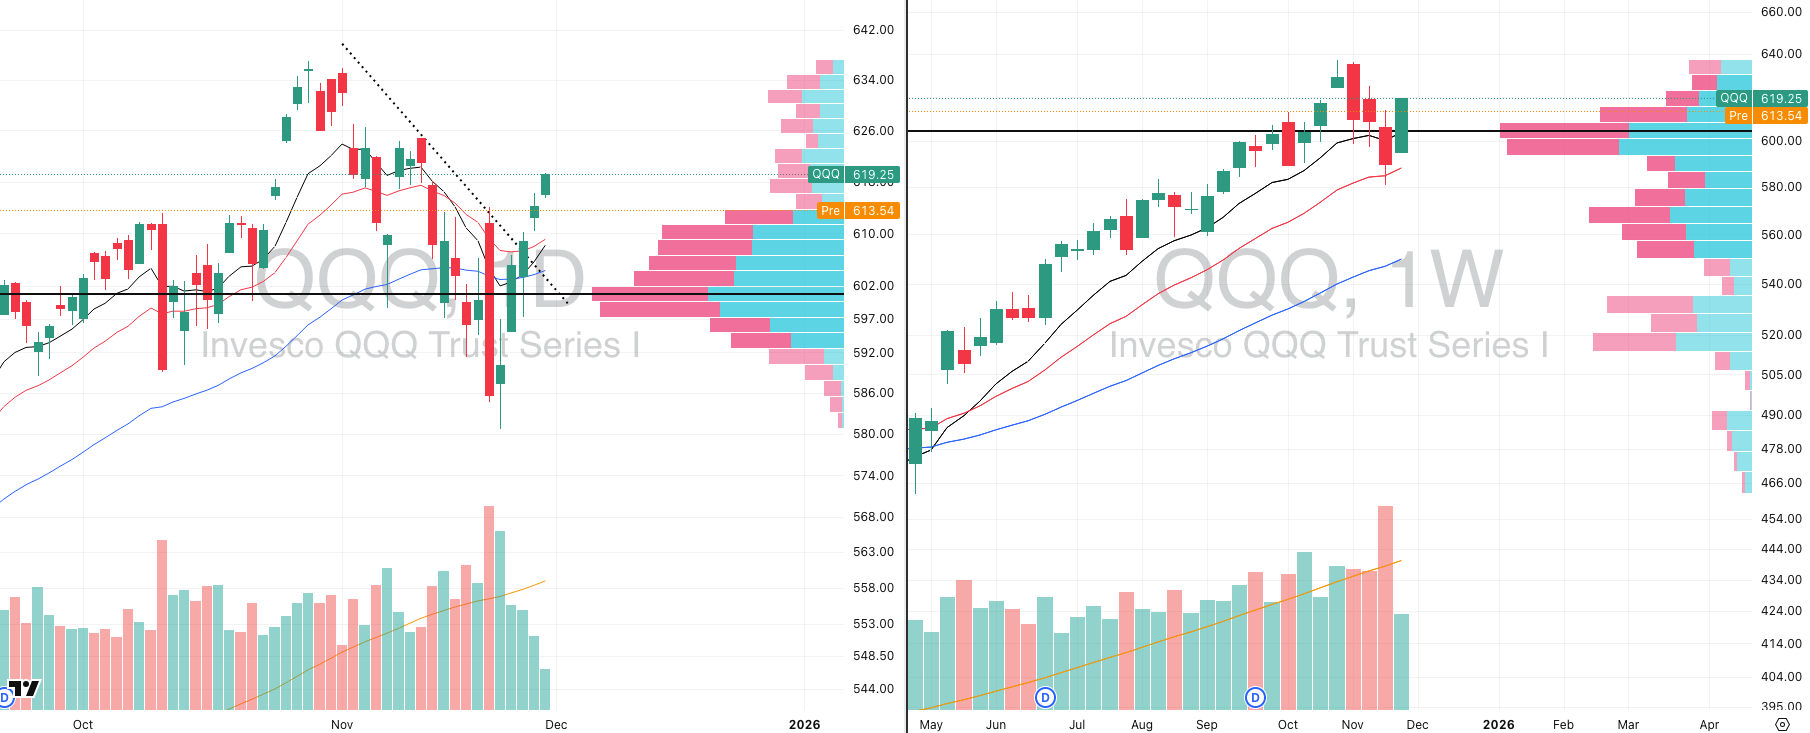
QQQ VRVP Daily & Weekly Chart

QQQE VRVP Daily & Weekly Chart
61.38%: over 20 EMA | 46.53%: over 50 EMA | 52.47: over 200 EMA
Strong 5-day rally reset the tone: Both QQQ and QQQE put in a meaningful upside push last week, rejecting a developing head-and-shoulders risk and reasserting control over their rising short-term trend structure.
Breakout over declining resistance: QQQ has now cleared the descending trendline anchored to the late-October $636 peak, shifting the near-term trend back to constructive and giving bulls the benefit of the doubt.
Pullback now expected and healthy: After an aggressive 5-session move, the probability of a controlled dip is high. We expect QQQ to retest the rising 10–20D EMAs in the $611–$609 region. This is the first real test of whether prior resistance converts cleanly into support.
This retest matters: A clean hold would confirm a trend transition, validating last week’s breakout and setting the stage for continuation. A failure would reopen the door to deeper mean reversion.
QQQE confirms broad Nasdaq participation: The equal-weight index also bounced sharply, showing that the rally was not purely mega-cap driven which is an important checkmark for market health (this is further supported by the fact the leading capitalisation groups in the last week are mid and small cap stocks, not megacap names).
S&P 400 Midcap

MDY VRVP Daily & Weekly Chart
77.25%: over 20 EMA | 55.75%: over 50 EMA | 58.00%: over 200 EMA
Perfect morning star reversal locked in: Over the past three weeks MDY printed a clean, high-probability morning star reversal. Last week’s follow-through confirmed it, signalling that the worst of the mid-cap drawdown is likely behind us.
Immediate rejection at multi-month supply: The rally pushed directly into the well-defined $604–$608 supply zone that has capped the index since early September. This area has consistently halted every attempt to trend higher, and MDY is now pulling back from it again.
Pullback is normal after a +4% weekly range: Last week covered a wide +4% range, so a short-term retracement here is entirely expected (as far down as $596 to be expected on the point of control on the visible range volume profile).
Reversal still stands despite noise: The morning star pattern remains intact and continues to argue for trend stabilisation, even if MDY chops around short-term. Nothing about this pullback invalidates the reversal structure.
What we want to see next: The ideal progression from here is a tight bull flag consolidation above the point of control and is close to $604 — the lower edge of the prior resistance shelf, which would confirm demand is stepping in where supply repeatedly dominated.
Russell 2000

IWM VRVP Daily & Weekly Chart
71.97%: over 20 EMA | 54.86%: over 50 EMA | 59.50%: over 200 EMA
Weekly morning star reversal also confirmed: Just like MDY, IWM printed and confirmed a morning star on the weekly timeframe which a high-probability reversal structure that strongly suggests the small-cap washout phase is behind us (and that the broad market is done selling off).
Pulling back into point of control (POC): On the daily chart, price is retracing directly into the $244 volume POC, which has been the dominant demand/supply node for months. This is exactly where we would expect buyers to defend.
Key short-term levels:
Demand expected at $244 (POC).
If demand fails here: next logical downside is $242, where the rising 10-, 20-, and 50-day EMAs cluster and where we have a strong confluence support zone.
Breakout into supply now being tested: Like midcaps, IWM pushed directly into the $248–$251 supply shelf that has capped the index since September. A pullback from this level was expected, given the sharp +5.6% run last week.
What we want to see next: Ideally, IWM stabilises above $244–$242, forms a tight flag underneath the supply band, and builds the next leg. A successful hold here would confirm prior resistance is turning into support — a critical character change for the small caps.
The Year-End Moves No One’s Watching

Markets don’t wait — and year-end waits even less.
In the final stretch, money rotates, funds window-dress, tax-loss selling meets bottom-fishing, and “Santa Rally” chatter turns into real tape. Most people notice after the move.
Elite Trade Club is your morning shortcut: a curated selection of the setups that still matter this year — the headlines that move stocks, catalysts on deck, and where smart money is positioning before New Year’s. One read. Five minutes. Actionable clarity.
If you want to start 2026 from a stronger spot, finish 2025 prepared. Join 200K+ traders who open our premarket briefing, place their plan, and let the open come to them.
By joining, you’ll receive Elite Trade Club emails and select partner insights. See Privacy Policy.
FOCUSED STOCK
VIST:
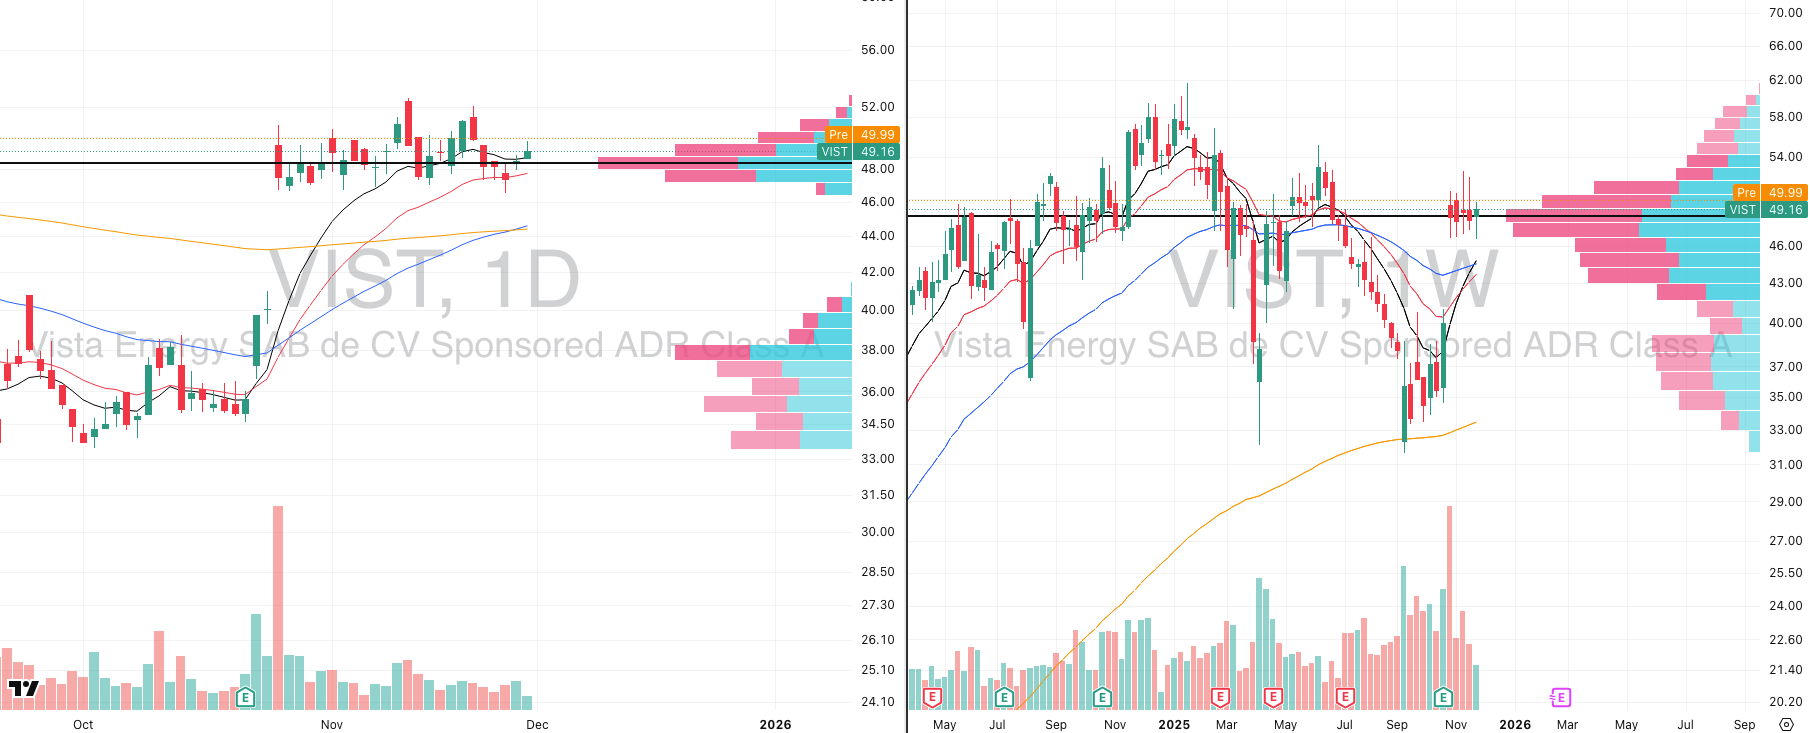
VIST VRVP Daily & Weekly Chart

XOP VRVP Daily & Weekly Chart
ADR%: 4.30% | Off 52-week high: -20.3% | Above 52-week low: +55.4%
Vista Energy (VIST) continues to set up constructively and remains one of the tighter, more technically mature names inside the Oil & Gas Exploration space — a group we’re monitoring closely through XOP, which has now compressed into a multi-week contraction pattern.
When a sector ETF coils this tightly on both the daily and weekly charts, it often precedes a decisive move; leaders inside the group typically resolve first.
Why VIST stands out:
Held the rising 200-week EMA perfectly: The recent undercut-and-reclaim of this long-term institutional demand zone was textbook. That area has acted as structural support, and the reaction confirms buyers still control the primary trend.
Now forming a tight multi-week base: Price has essentially gone flat-on-flat around $48–$50 for four weeks, with declining volatility which exactly what you want to see before a potential expansion phase. This is one of the tightest bases in the group.
Relative strength improving vs XOP: While XOP has drifted sideways and compressed, VIST is sitting in the upper half of its range, indicating clear leadership inside the group.
Sector backdrop supportive: Energy has broadly stabilized, and XOP’s contraction pattern on the weekly chart suggests an imminent directional move. If the group resolves higher, VIST is positioned as a first-mover candidate.
FOCUSED GROUP
XLB: The Strongest Group In The Market
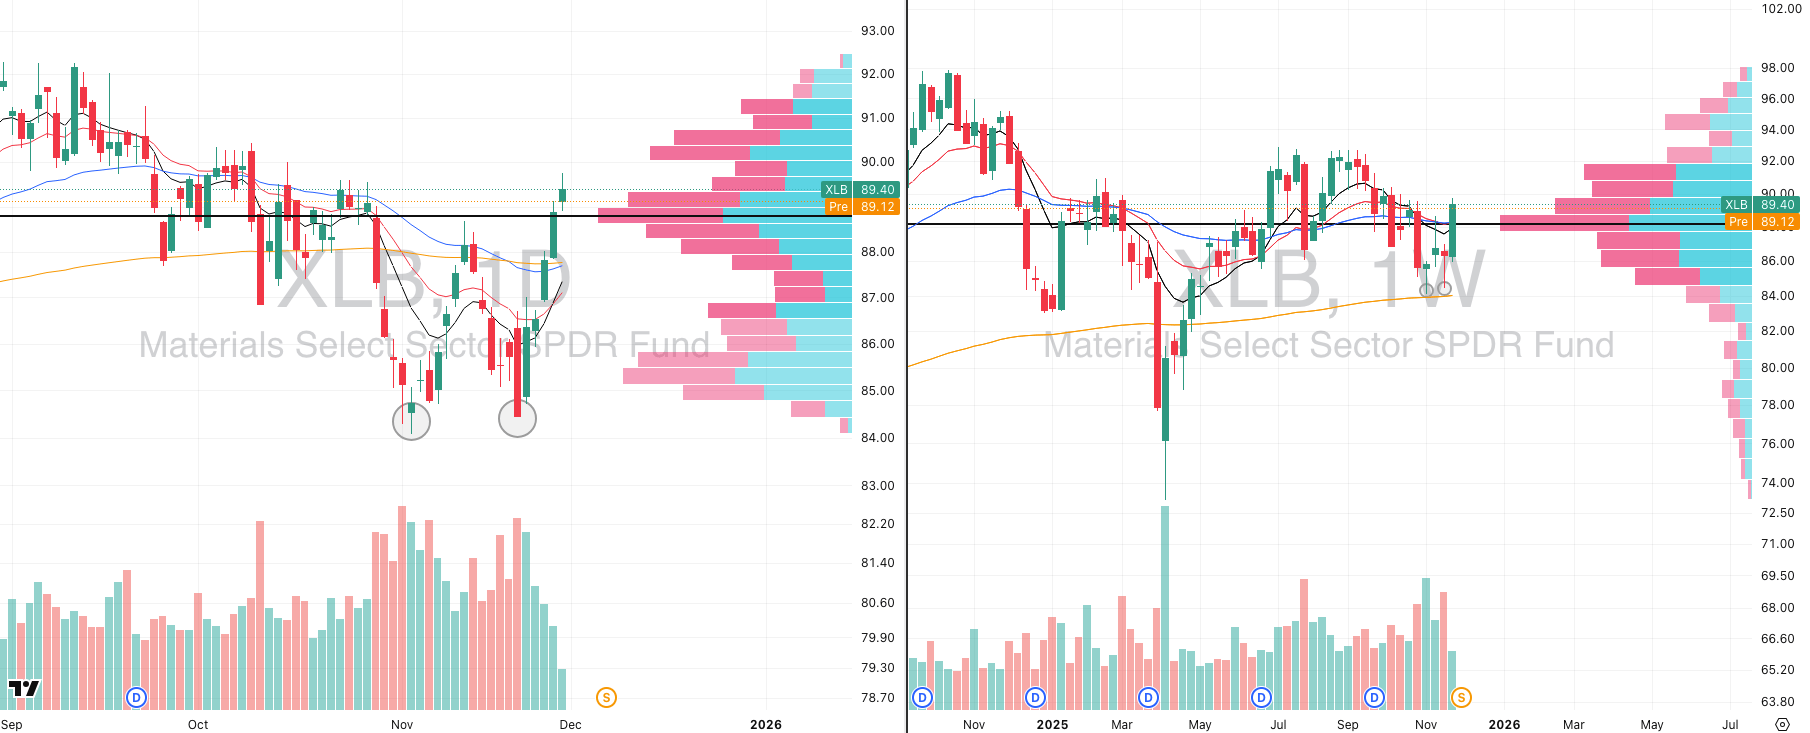
XLB VRVP Daily & Weekly Chart
The Materials sector (XLB) continues to firm up meaningfully, and the technical structure has improved far more than the headline price action suggests.
Clear double-bottom structure: The two circled lows on the daily and weekly charts (mid-November and late-November) formed a clean, higher-volume retest of demand around $84.50–$85.00. That zone held perfectly on both attempts, confirming structural support.
Reclaim of key moving averages: Last week’s bounce carried XLB back above the 10-, 20-, and 50-day EMAs. On the weekly chart, price is stabilising also above the rising 200-week EMA which was where the double bottom happened.
Precious metals driving underlying strength: With gold and silver breaking out aggressively, the entire Materials complex is benefiting. Metals & Mining (XME) is leading, and XLB historically follows the precious-metals impulse with a slight lag (as it is mostly Chemicals weighted). The fact that XLB is strengthening as XME accelerates gives this sector real momentum potential into December.
Sector message: XLB’s double-bottom + reclaim of moving averages + confirmation from precious metals suggests the worst is behind this group. Near-term chop is possible, but structurally this looks like the early stages of a bottoming formation.

Did you find value in today's publication?This helps us better design our content for our readers |
Reply