- Swingly
- Posts
- A Strong Step In The Right Direction!
A Strong Step In The Right Direction!
In partnership with
OVERVIEW
What You Need To Know
Nasdaq (QQQ)
QQQ printed a legitimate Morning Star, but still sits directly under a declining trendline + stacked weekly EMAs that have rejected every bounce for a month.
Trend risk remains elevated until QQQ clears $610–$615 with conviction — otherwise this bounce can still form a right shoulder.
S&P 400 Midcap (MDY)
MDY rallied strongly but stalled exactly at the declining trendline + 10-week EMA cluster, showing supply absorption hasn’t happened yet.
The Adam & Eve double-top on the weekly keeps structural risk high unless MDY reclaims $590 and later the $610 neckline.
Russell 2000 (IWM)
IWM showed the best raw price strength, reclaiming all major EMAs, but on weak volume that tempers conviction.
Price is now running straight into heavy supply toward $242 — this is a rally into resistance, not through it.
Focused Stock: LMND
LMND is showing standout relative strength as it continues defending its rising 10/20-week EMAs despite sector volatility.
A tight multi-week contraction while financial peers break down signals real institutional demand if market conditions stabilise.
Focused Group: KIE
KIE is quietly forming a clean daily bull flag while weekly charts show heavy accumulation at the 50-week EMA + $55.50 demand zone.
With the monthly chart bouncing off the 20-month EMA on huge volume, a breakout above $60 would offer rare multi-timeframe alignment.

The Smartest Free Crypto Event You’ll Join This Year

Curious about crypto but still feeling stuck scrolling endless threads? People who get in early aren’t just lucky—they understand the why, when, and how of crypto.
Join our free 3‑day virtual summit and meet the crypto experts who can help you build out your portfolio. You’ll walk away with smart, actionable insights from analysts, developers, and seasoned crypto investors who’ve created fortunes using smart strategies and deep research.
No hype. No FOMO. Just the clear steps you need to move from intrigued to informed about crypto.
MARKET ANALYSIS
Moving In the Right Direction
The Big Macro Tension Right Now
U.S. equity futures are flat to slightly red after Monday’s tech-led rebound.
Yesterday’s session saw strong moves in AI/semis, but futures this morning show no follow-through, signaling a wait-and-see tone ahead of macro catalysts.
Falling yields + imminent Fed cuts = bullish for duration-sensitive assets (tech, growth, real estate).
But rising layoffs + manufacturing weakness = earnings risk building under the surface.
AI / Tech Dynamics
The biggest story: Meta exploring Alphabet’s AI chips → NVDA down ~4%, GOOGL +4%, AVGO +11% yesterday.
This is a serious rotation risk inside AI hardware: ASICs gaining traction → potential multiple compression for general-purpose GPU leaders.
Despite a sharp rebound Monday, tech remains negative month-to-date (Nasdaq –3.6%, S&P –2%). Momentum in megacap tech remains fragile.
Fed Policy Expectations
Markets now price 80%+ probability of a December rate cut, driven by:
NY Fed’s John Williams saying cuts are possible “near term.”
SF Fed’s Mary Daly supporting cuts due to labor market deterioration.
10-year yield dropped to 4.04%, lowest in a month → helping tech but also signaling weakening growth expectations.
Labor Market Softening
ADP shows accelerating private payroll losses:
Now averaging –13,500 jobs/week over the last four weeks (vs –2,500 prior).
Weakening jobs → supports Fed cuts, but reinforces macro slowdown risk.
China ADRs in Focus
Alibaba (BABA) Q2 earnings pre-market today: critical read on China consumer recovery.
Li Auto earnings tomorrow: key gauge of China EV growth + margin trajectory.
Nasdaq
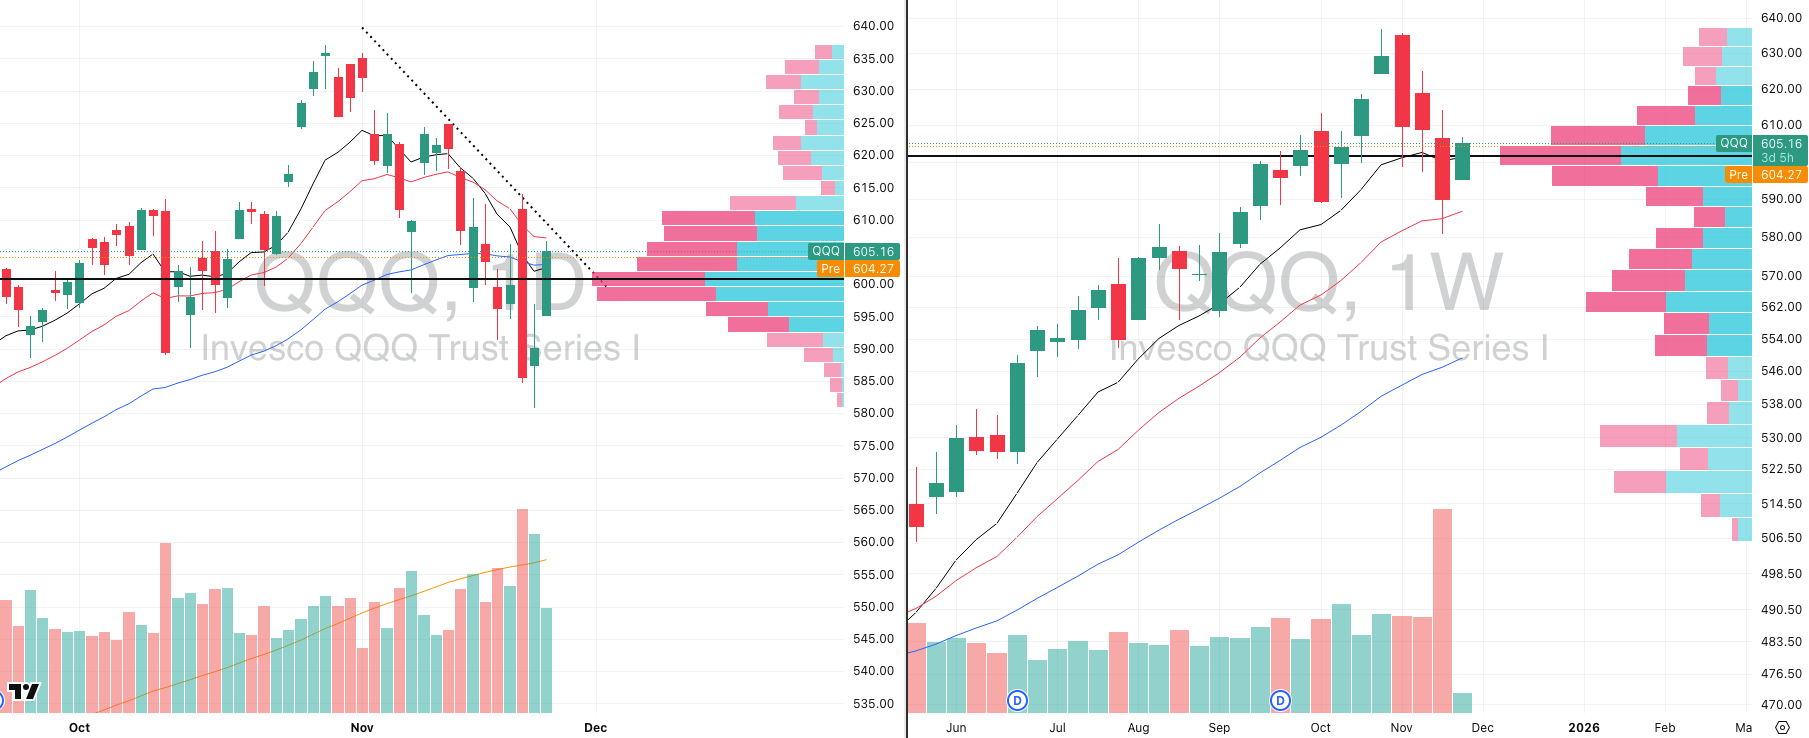
QQQ VRVP Daily & Weekly Chart
% over 20 EMA: 35.29% | % over 50 EMA: 35.29% | % over 200 EMA: 49.01%
QQQ printed a valid Morning Star reversal on the weekly chart as buyers defended the 10-day and 50-day EMAs (~603) and pressed price back into the declining 10-week EMA (~605) and 20-week EMA, a constructive first step after last week’s washout.
Breadth confirmed the move (“see above”) with a sharp expansion in upside participation, but price still sits directly beneath a well-defined declining trendline drawn from the late-October $635 peak which is a trendline that has rejected every bounce for almost a full month.
Despite the weekly Morning Star, QQQ is not out of danger. It remains structurally vulnerable while trading below that trendline and beneath the cluster of declining weekly EMAs, which continue to act as dynamic resistance.
The broader pattern still carries head-and-shoulders risk on the weekly timeframe. This current bounce can still develop into the right-shoulder unless QQQ takes out $610–$615 with conviction and breaks the trendline cleanly.
A decisive move through the trendline + weekly EMAs would flip the risk skew back in favour of buyers and likely drag the rest of the market with it. Until then, this is repair mode, not a confirmed trend reset.
S&P 400 Midcap
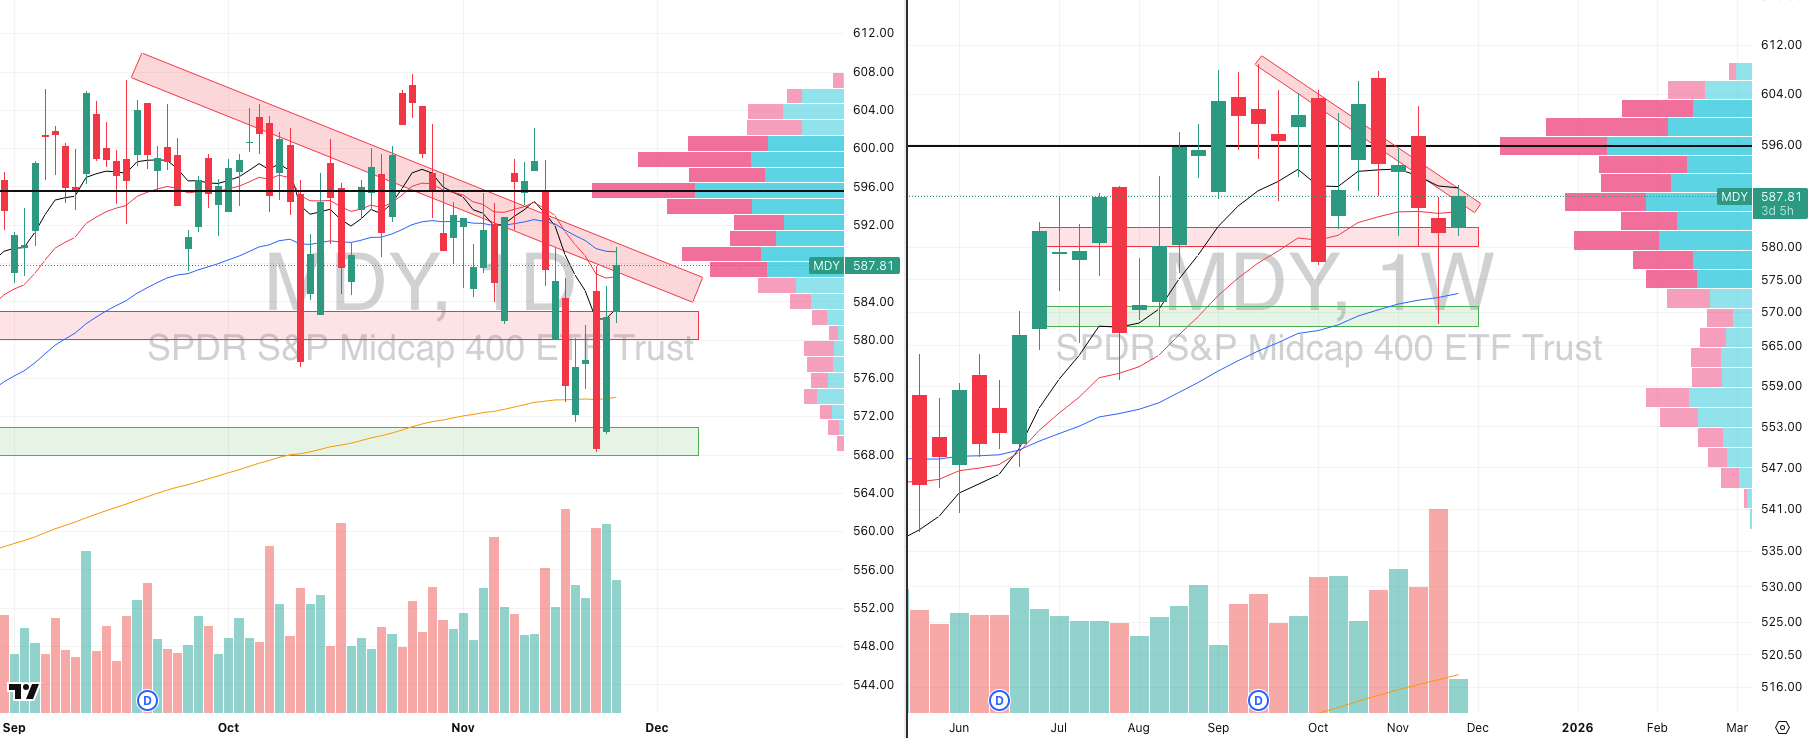
MDY VRVP Daily & Weekly Chart
% over 20 EMA: 52.25% | % over 50 EMA: 42.75% | % over 200 EMA: 52.50%
MDY put in a strong session, but the rally stalled exactly where it “should” stall: the declining trendline from mid-September (now a two-month trend of consistent rejection).
That rejection zone also included the declining 10-week EMA at ~$590 and the declining 50-day EMA, creating a cluster of overhead supply that midcaps were not able to absorb.
The weekly chart continues to show a bigger structural risk pattern: an Adam & Eve double-top.
Adam: the sharp V-top from 25 November 2024 (exactly one year ago today).
Eve: the rounded multi-week top formed Sep–Nov 2025 at $610.
This doesn’t confirm a breakdown, but it raises the bar significantly for any claim that midcaps have bottomed.
MDY will need:
A clean break of $590,
A reclaim of the 10- and 20-week EMAs, and
A decisive close above the $610 neckline, before we can argue the trend has genuinely turned.
Russell 2000
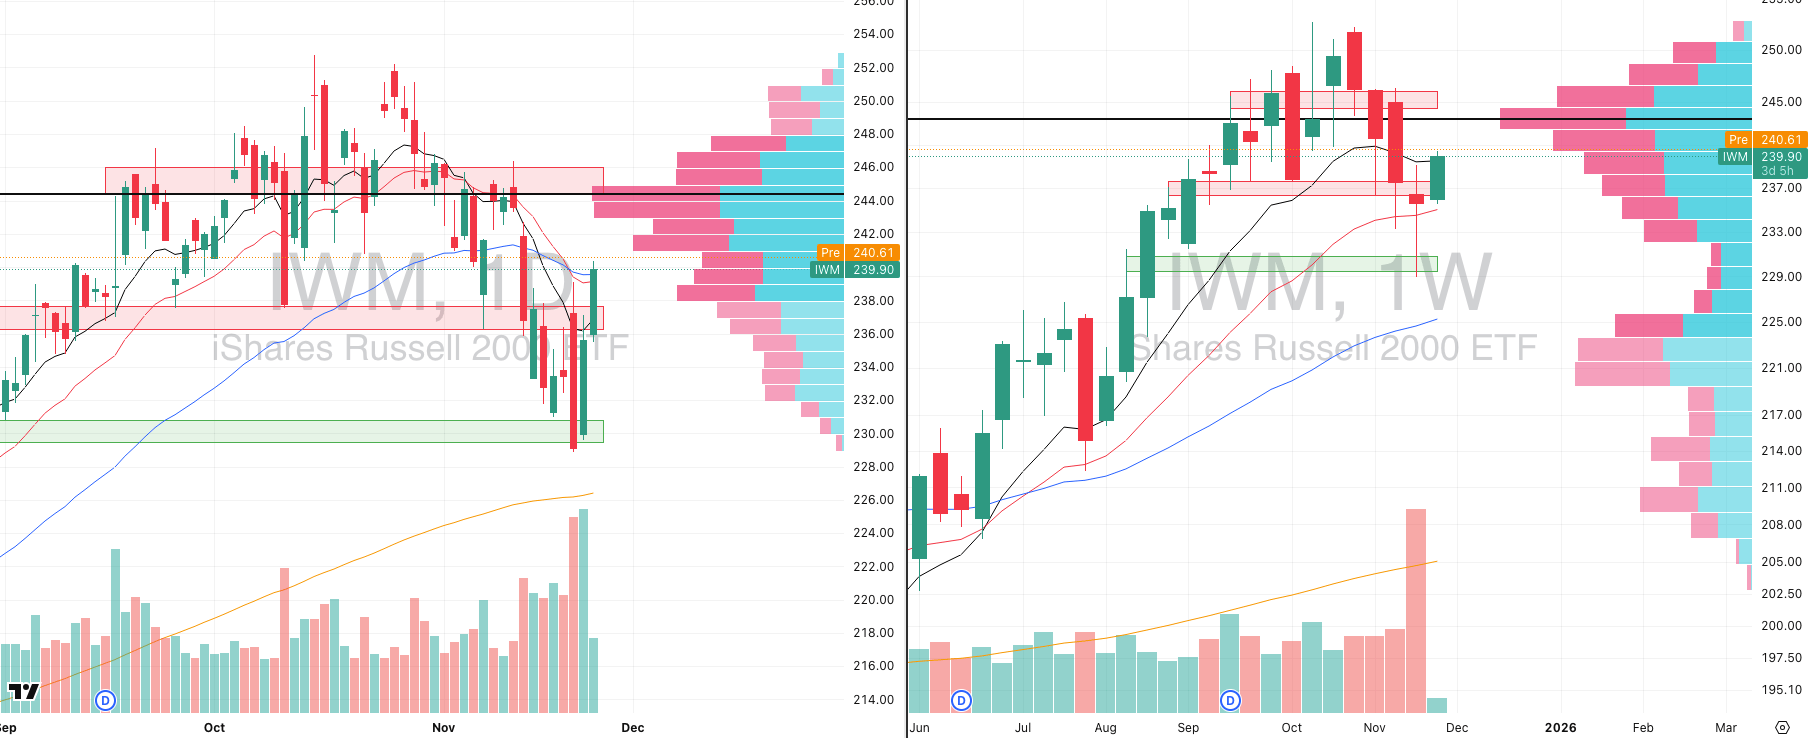
IWM VRVP Daily & Weekly Chart
% over 20 EMA: 50.07% | % over 50 EMA: 41.38% | % over 200 EMA: 53.31%
Best raw price action of the three indices- IWM is the only one that cleanly pushed back above all major daily and weekly EMAs in one move.
But the volume wasn’t there as yesterday traded at only 83% of its 20-day average, which tempers the strength of the reversal.
The saving grace is Friday where we saw a large relative-volume defense at the $230 demand shelf, which gives us a legitimate anchor for buyers and explains why yesterday’s lighter volume is forgivable.
Price is now moving straight into heavy supply that extends up toward $242 and this is where sellers rejected IWM multiple times between September and November.
Despite the strong price reaction, this is not an area to get aggressive. It’s a rally into resistance, not through it as it currently stands.
Key takeaway: IWM, MDY, and QQQ are all showing initial steps in the right direction, but the job now is tracking the true relative-strength leaders i.e. the stocks that held firm during the recent flushes.
These names will either:
(1) lead a legitimate recovery,
or (2) expose a bull trap if they crack first.
FOCUSED STOCK
LMND: A Momentum Leader Showing RS
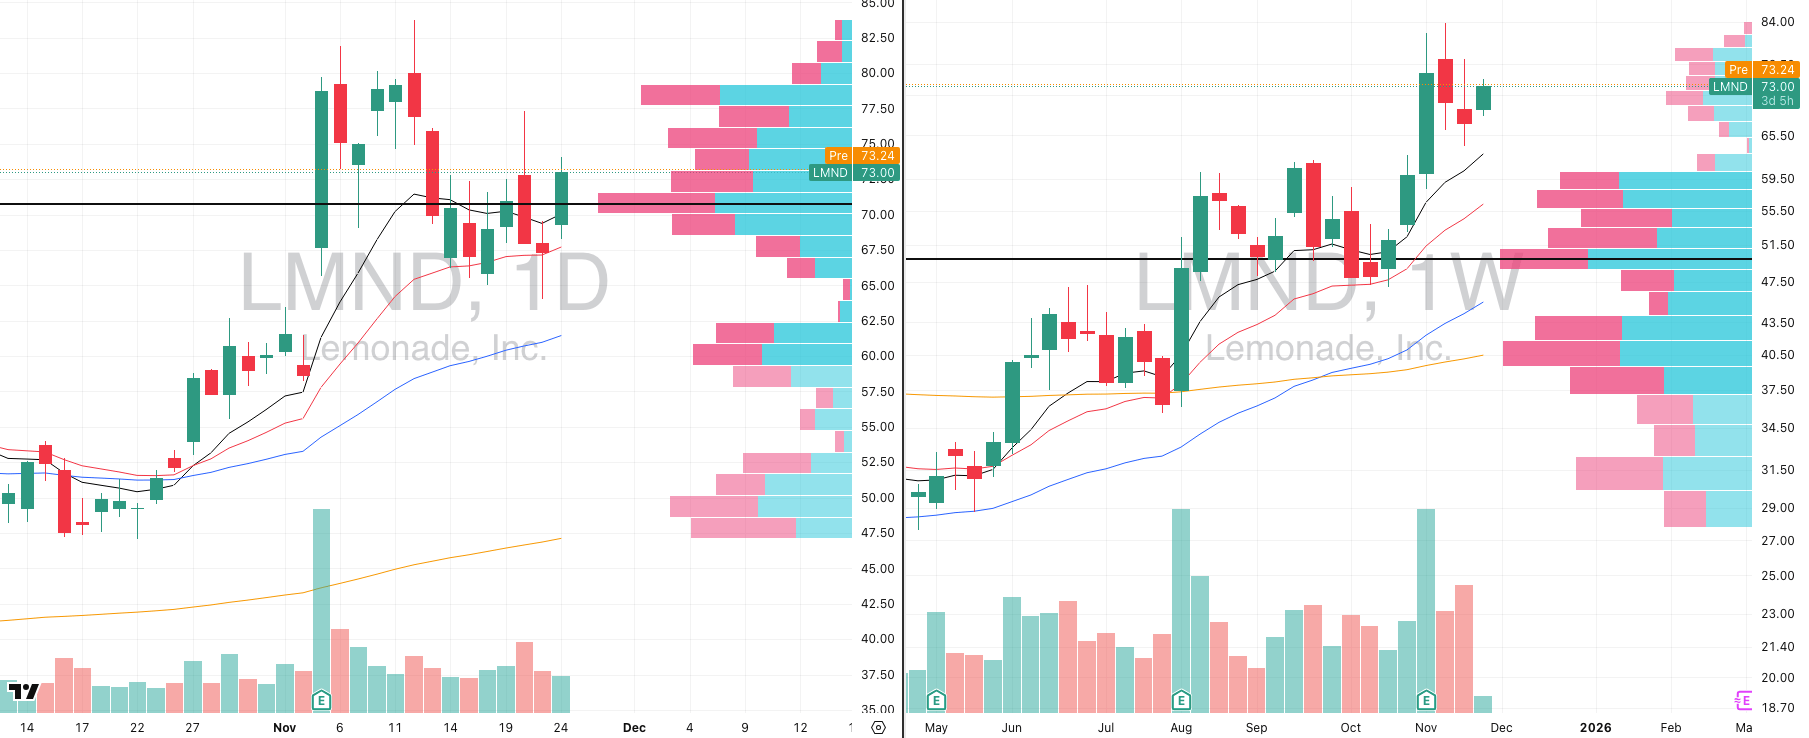
LMND VRVP Daily & Weekly Chart
ADR%: 9.04% | Off 52-week high: -12.9% | Above 52-week low: +200.3%
LMND isn’t on the immediate-action list, but it has earned a spot on our Focused Stocks radar because of how decisively it has outperformed both the financial sector and the broader market during the recent volatility.
While the financial leaders that had been driving the group- including names like HOOD- have broken down or lost momentum, LMND has held firm and continues to show remarkable strength.
The weekly chart is the key here as LMND has carved out a tight multi-week contraction while refusing to break its rising 10/20-week EMA, a level it has defended consistently since the April 2025 trend reversal.
This is a fast mover with a >9% ADR, so it’s not something to chase blindly, but the ability to build a controlled range while everything around it weakens is a signal of genuine institutional demand.
If market conditions stabilise and financials rotate back into favour, LMND is positioned as one of the highest-quality relative-strength names in the group.
FOCUSED GROUP
KIE: Accumulation Nobody Is Talking About
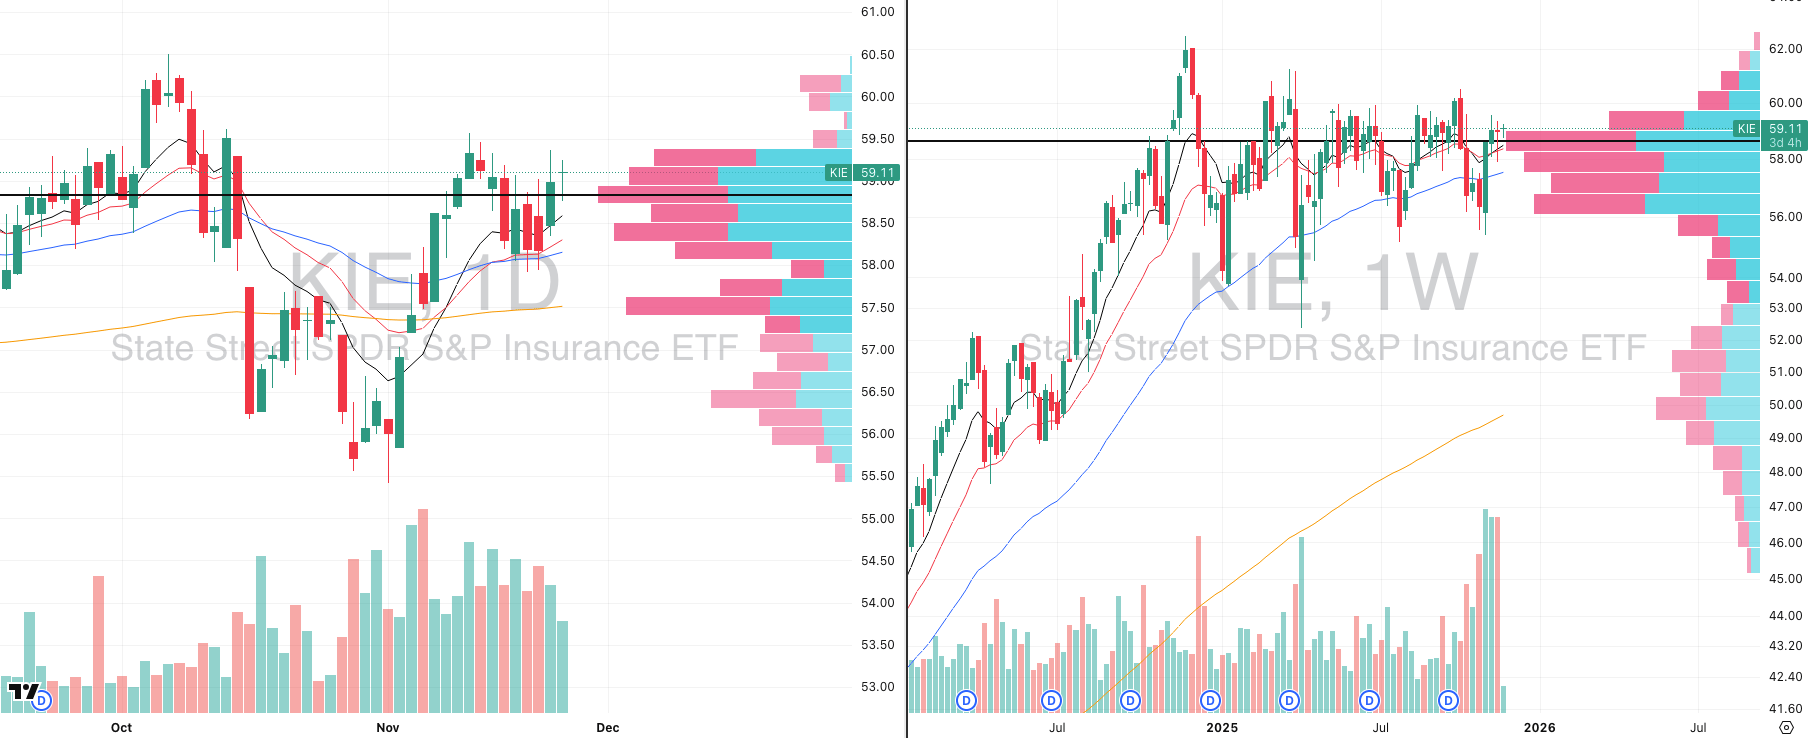
KIE VRVP Daily & Weekly Chart
KIE hit our scans again after the surge it posted at the start of November as while the broader market pulled back, KIE quietly formed a clean bull-flag structure on the daily chart.
Demand is showing up exactly where it should, first at the rising 50-day EMA (~$58), and now at the rising 10- and 20-day EMAs (~$58.60). The flag is tight, controlled, and constructive.
On the weekly chart, the story gets far more interesting as over the last four weeks, KIE has printed massive relative-volume surges as price:
Reclaimed the 50-week EMA (~$57.50)
Retested and held the $55.50 weekly demand zone
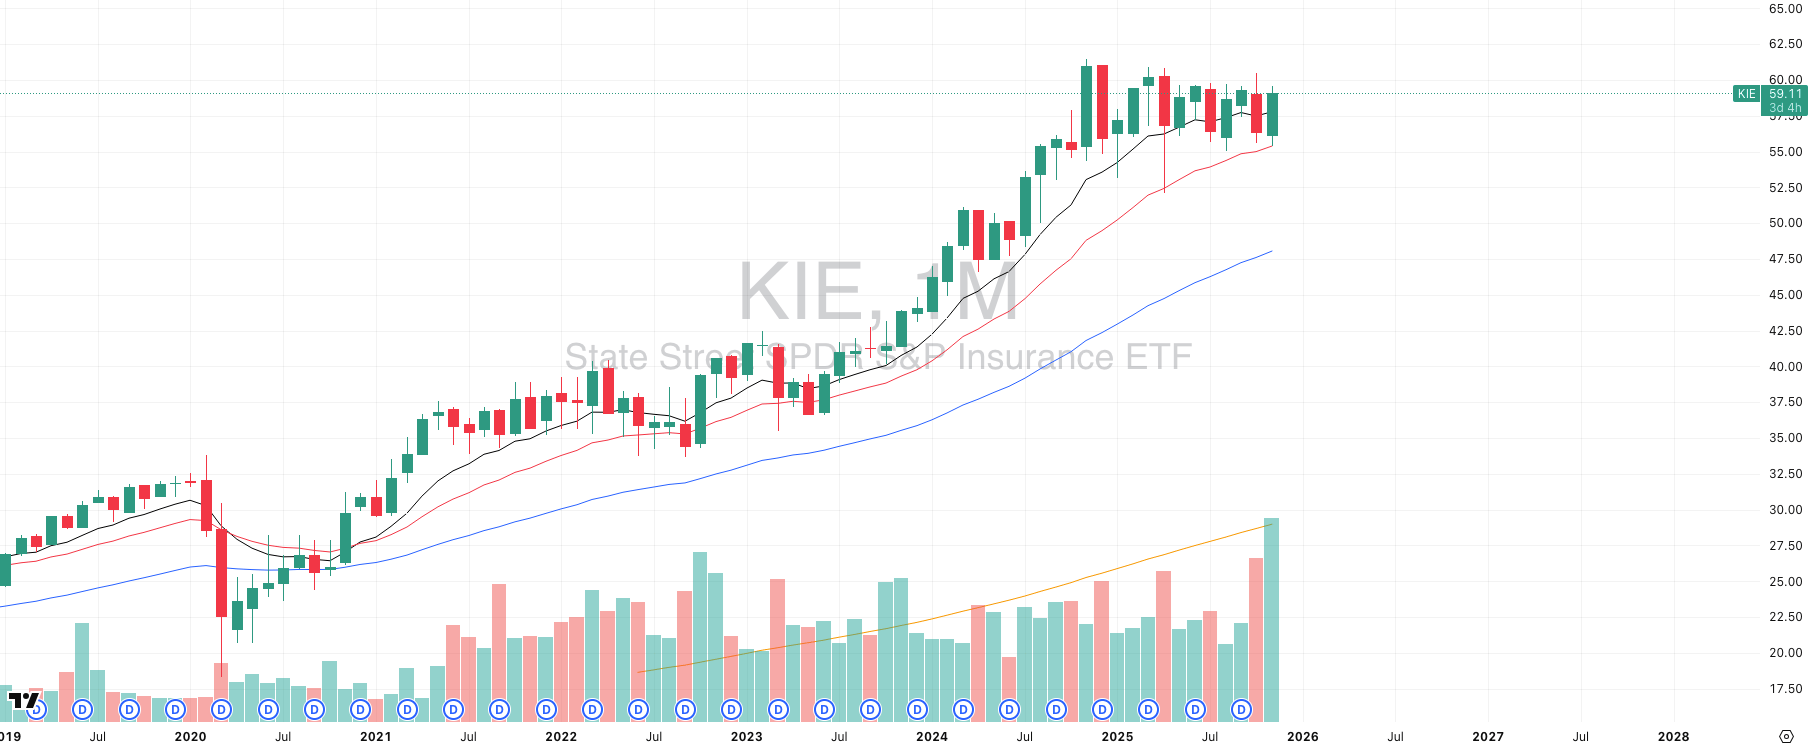
KIE Monthly Chart
The primary trend (monthly) is the real tell as November produced the highest relative-volume candle in years and it aligned perfectly with a monthly bounce off the rising 20-month EMA with price now reclaiming the 10-month EMA.
We’re not calling a breakout above $60 yet. But the multi-timeframe alignment here is exceptional:
primary-trend support → weekly accumulation → daily bull-flag setup.If KIE breaks out on the daily timeframe, the asymmetry is extraordinary as
you’d be entering a tightly defined setup on the daily that is backed by a multi-month primary trend base- the kind of structure that can carry for months.

Q&A
Got a trading question? Hit reply and ask!
Q: “I understand you can’t always trade, but how do you know when to stop and pause?”
The difference between a consistent trader and a churn-and-burn gambler is quite simply the ability to slam the brakes before the market takes your edge and your capital.
This is about hard data showing the environment or your execution has degraded.
Two biases kill traders here: sunk cost fallacy (trying to win back losses) and illusion of control (thinking skill can override bad tape).
Step 1: Peg Your Metrics to Your System
Track a rolling last-20-trades window against your 12-month baseline. Track these hard stats daily, weekly, and rolling-20 trades
Below is just an example of how you can set this up for yourself:
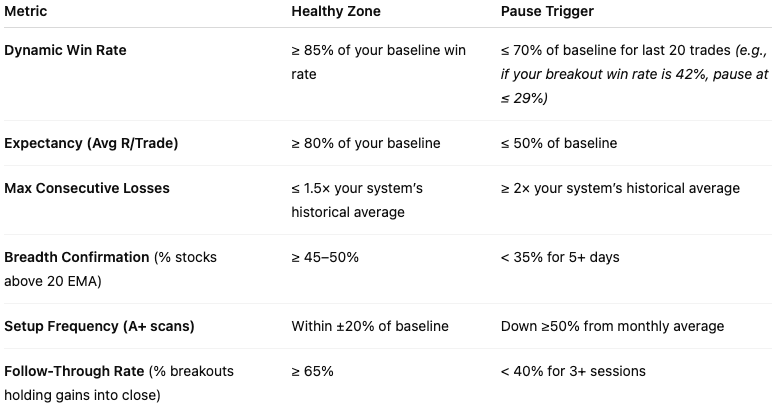
Step 2: Recognize Regime Shifts
Breadth Divergence → QQQ at highs while QQQE, MDY, IWM lag under 10 & 20 EMA.
Failed Follow-Through Days → Breakouts reversing in 1–2 days on heavy volume.
Volatility Compression → ATR% down 20–30% from 60-day average.
Crowded Tape → 50%+ of index gains from top 5–10 names.
Step 3: Protect the House
In Feb–Mar 2022, growth breakout win rates fell from 43% to 28%. Those who paused avoided a -12% system drawdown. Those who pushed through lost capital and confidence which takes months to recover.
This is the same discipline a casino uses when they shut a table with too many card counters: protect the house, protect the capital.
Did you find value in today's publication?This helps us better design our content for our readers |
Reply