- Swingly
- Posts
- A Bullish Market- If You Know Where to Look
A Bullish Market- If You Know Where to Look
In partnership with
OVERVIEW
What You Need To Know
Macro
Earnings strong but narrow; AI + megacap still driving index strength.
Fed dovish tilt + QT ending Dec 1 → liquidity tailwind into year-end.
Policy + AI capex cycle still supportive (MSFT/IREN/NVDA flow confirms).
November = historically strongest month → dip-buying regime, but selective.
Nasdaq (QQQ)
Holding rising 10-EMA; buyers defending levels with volume.
Tight contraction near highs, higher lows on hourly → momentum intact.
Above $625 = risk-on; below = retest 10-EMA.
Midcaps (MDY)
Still below POC + capped under resistance.
Weekly base-building, but distribution signs & lagging breadth.
Avoid until > ~$597–$600.
Small Caps (IWM)
Holding demand but weak relative strength vs mega-cap tech.
Rising weekly trend intact; multiple bounces off $240–244 zone.
Not leadership
Focused Stock: PL
True institutionally-accumulated leader
V-shaped earnings pivot + low-volume pullback + rising 10-W EMA defense
Tight coil under $14 → HTF breakout candidate
Focused Group: BOAT (Global Shipping)
Reclaimed weekly POC + clean trend structure.
Rising 10-W EMA support + shallow pullbacks.
Quiet leadership in real-asset space

MARKET ANALYSIS
Mega-Caps Lead, Everyone Else Survives

Earnings remain strong but narrow
~80% of S&P companies have beaten expectations so far
Leadership still concentrated in mega-cap tech + AI, reinforcing narrow breadth risk
Q3 earnings continuation this week (PLTR, AMD, SMCI) and the market still reacting to AI guidance more than numbers
AI capex + infrastructure cycle continues
Microsoft approved to ship Nvidia GPUs to UAE + expanding capex abroad
IREN signs $9.7B GPU supply deal with MSFT
Ongoing global AI chip arms race = sustained structural bid in semis / compute
Policy backdrop remains supportive
Fed dovish tilt + QT ending Dec 1st = liquidity tailwind into year-end
Macro liquidity still supports risk-on, despite tactical weakness in breadth
Government shutdown delaying hard data
Payrolls + other key prints postponed
ISM + PMI surveys take on outsized market importance this week
Expect headline-driven volatility spikes and as always, price confirmation > news reaction
Seasonality tailwind
November is historically the strongest month for S&P (~+1.8% average return)
Typically a dip-buying month, but narrow leadership means selective execution
Berkshire signals valuation caution
Operating earnings strong, but no buybacks + record $381B cash pile
Big money still sees elevated valuations and this confirms discipline > FOMO
China gold policy shift triggers pullback
Removal of local retailer tax benefit → selling pressure
Healthy reset within a strong secular metals trend; aligns with miner accumulation setups
Nasdaq
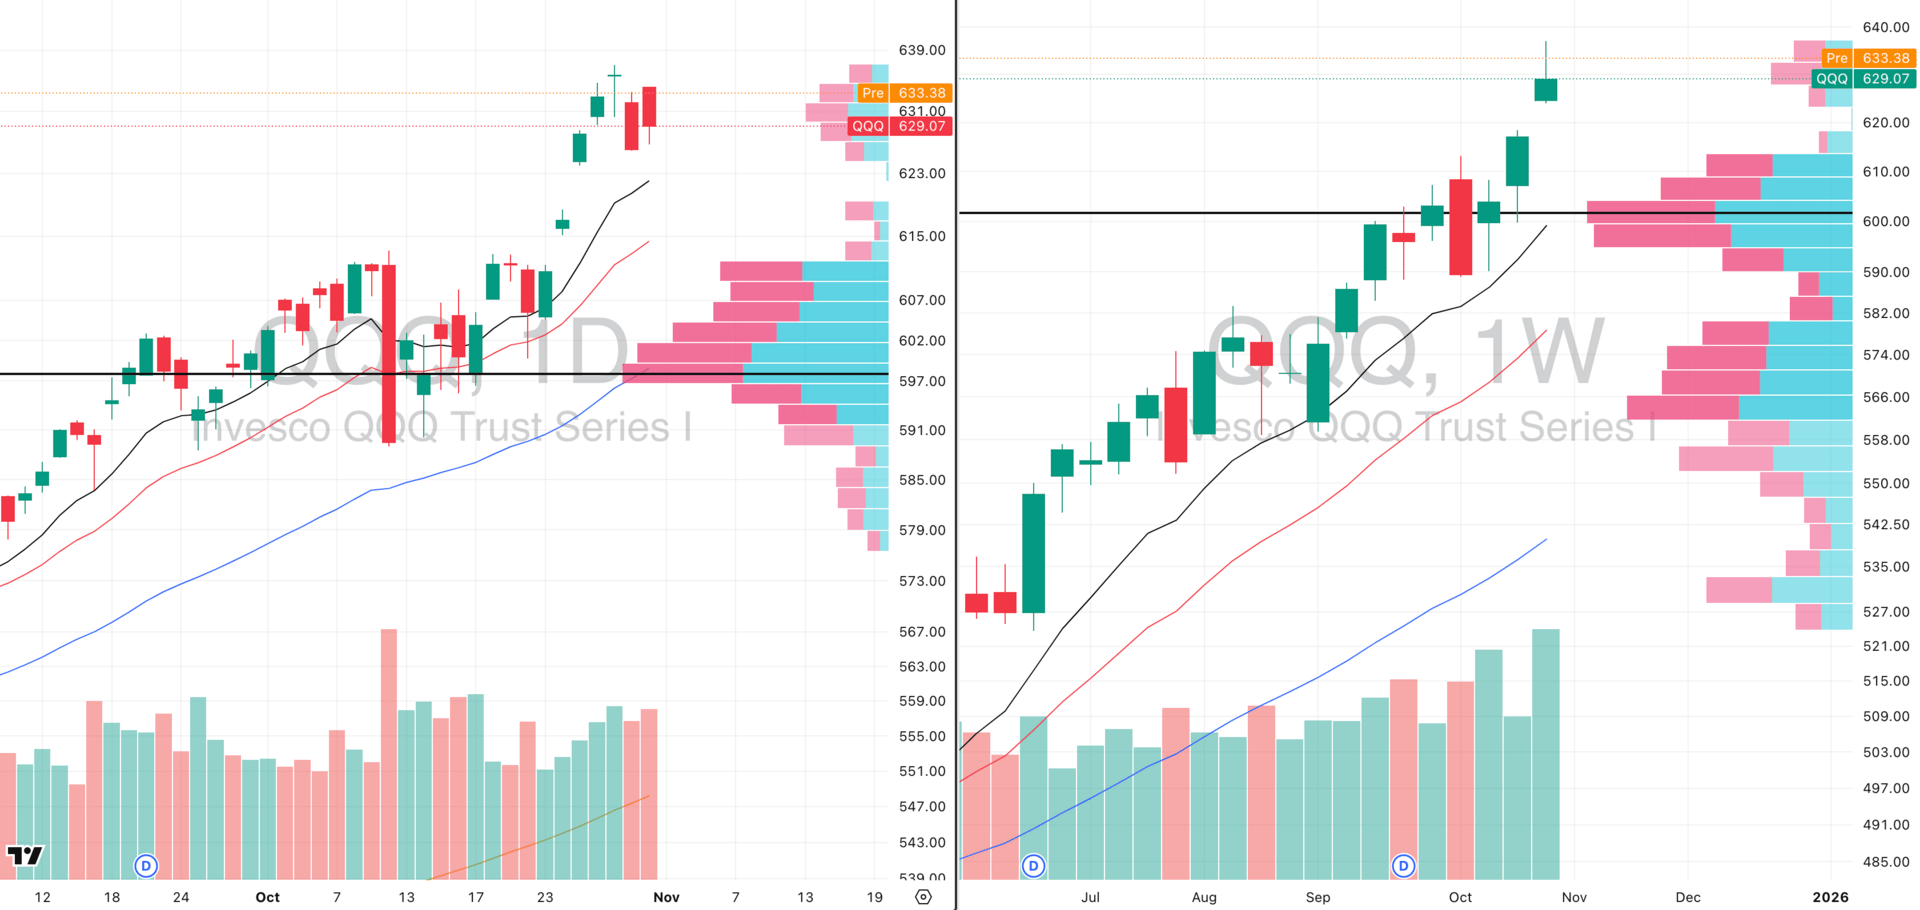
QQQ VRVP Daily & Weekly Chart
% over 20 EMA: 51.96% | % over 50 EMA: 55.88% | % over 200 EMA: 55.88%
QQQ continues to hold above the rising daily 10-EMA, keeping the momentum trend fully intact.
Friday’s intraday dip produced a hammer reversal off Thursday’s lows showing buyers defended demand again.
Volume came in at ~122% of 20-day RVOL, confirming participation on the pullback rather than distribution.
Price is digesting near highs in a tight contraction, not losing structure and this remains constructive.
We still have multiple breakaway gaps below from the recent thrust; in strong momentum phases these typically act as support emphasising very high momentum.
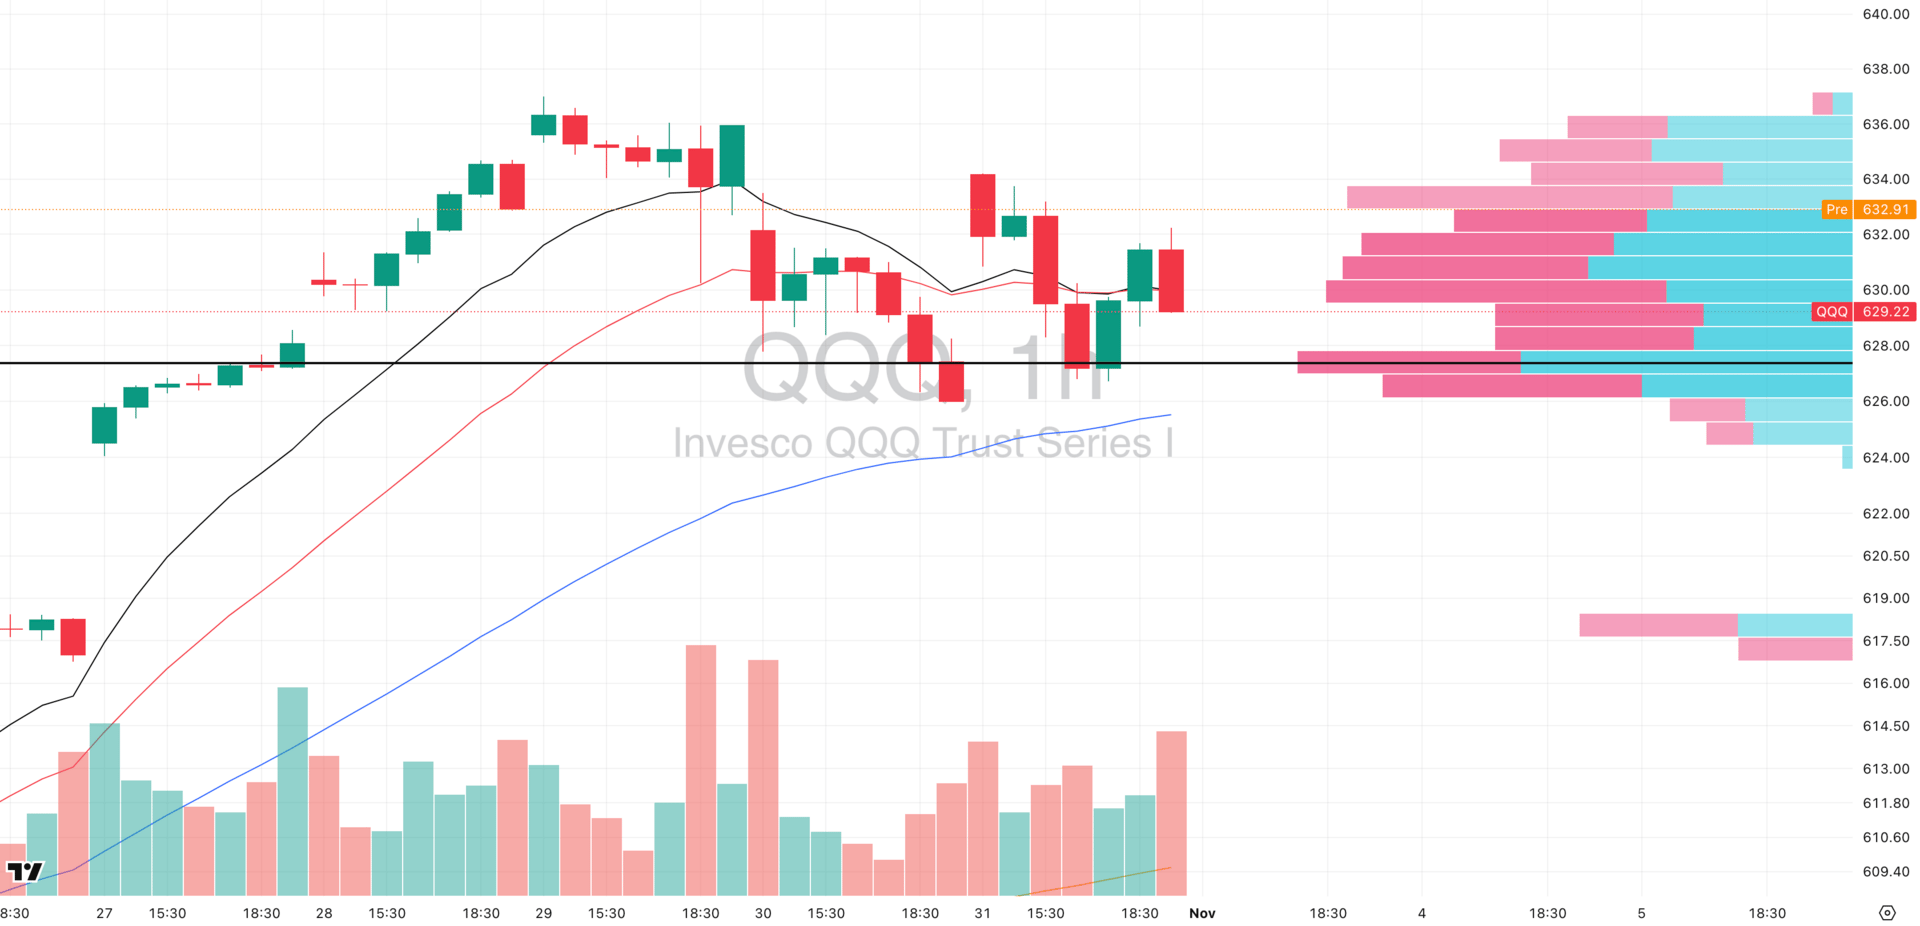
QQQ VRVP Hourly Chart
Hourly chart continues to put in higher lows riding the rising 50-EMA.
Clear double-bottom basing around $625 which is the key short-term pivot.
As long as price holds above $625 and the rising hourly 50-EMA, the trend remains orderly with buyers in control.
A clean break below $625 would invalidate the short-term structure and likely trigger a fast retest into the daily 10-EMA.
Bias remains risk-on while price holds above the rising daily 10-EMA and hourly 50-EMA structure.
S&P 400 Midcap
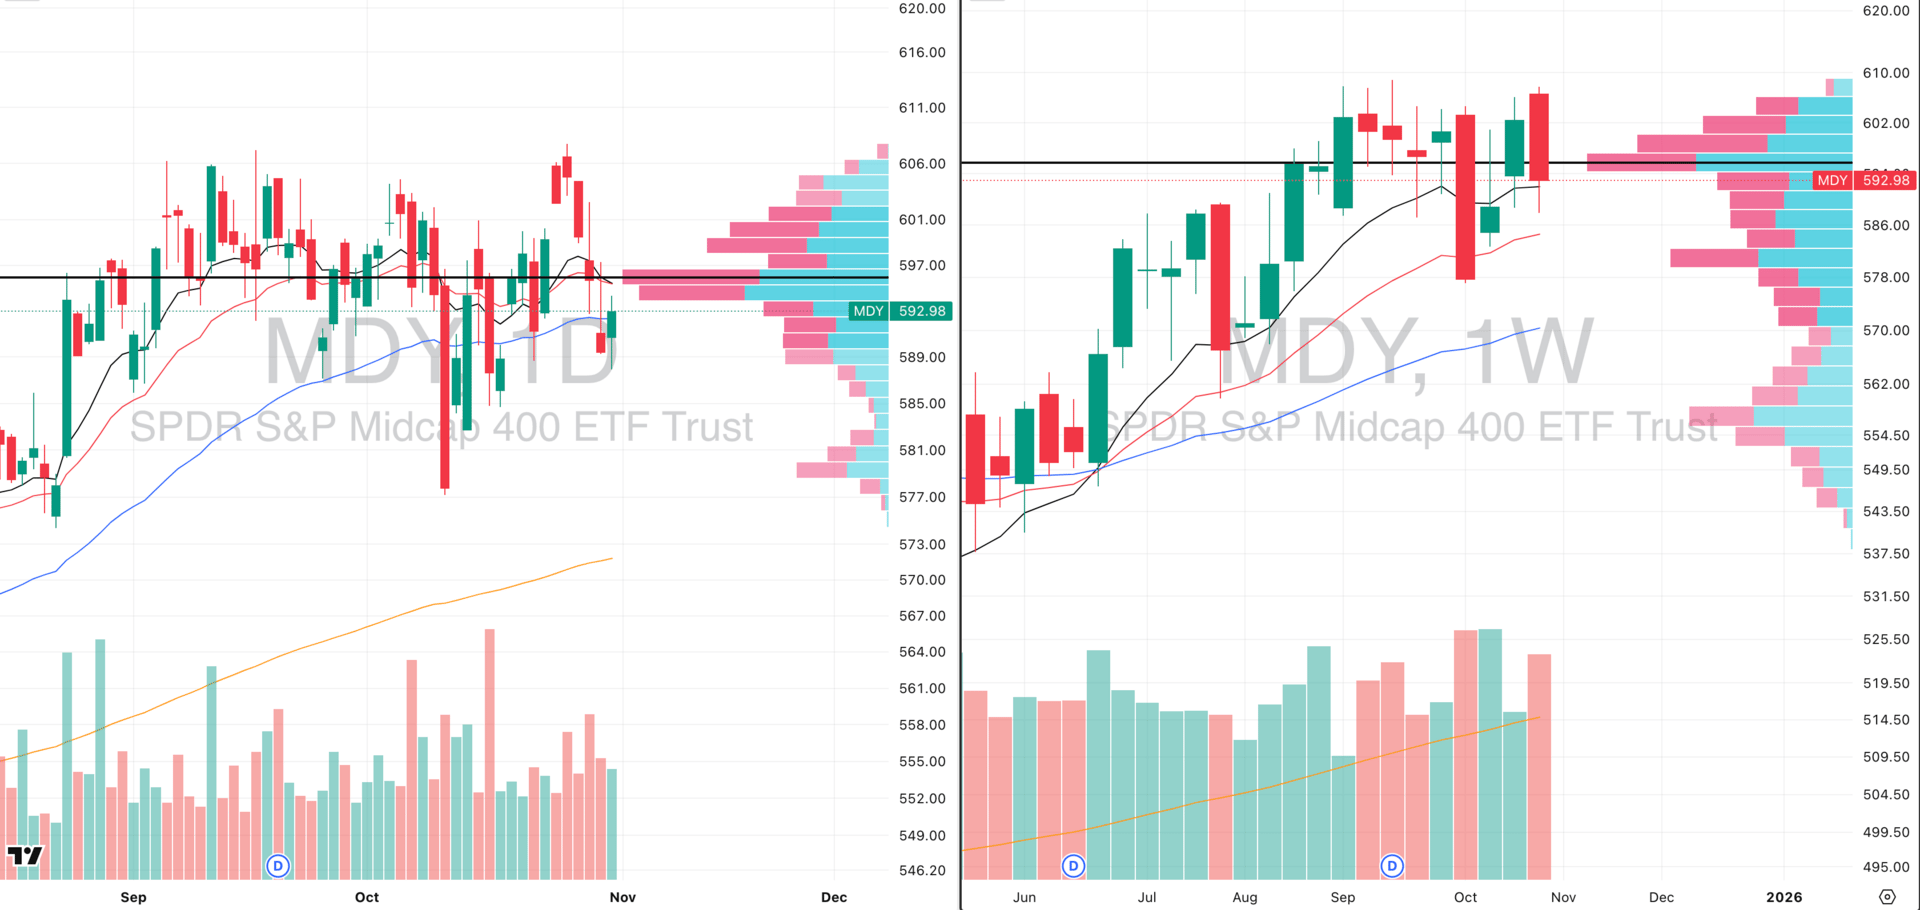
MDY VRVP Daily & Weekly Chart
% over 20 EMA: 37.90% | % over 50 EMA: 34.41% | % over 200 EMA: 50.87%
MDY continues to lag and remains below both the daily and weekly POC (~$596.50), which keeps this group in a consolidation regime rather than leadership.
Friday saw price attempt to reclaim that POC zone, but supply showed up quickly with a brief rejection into the close.
The rising 10-week EMA (~$591) continues to act as the intermediary demand zone, and buyers defended it again last week. That’s the real reference level here.
The daily structure is very noisy, but the weekly view cleans it up: this has been a sideways base-building phase since late August with obvious distribution taking place in this structure.
Until we see sustained acceptance back above ~$597–$600, this remains a secondary asset class and a complete avoid in our eyes (just compare MDY and NDX breadth above).
Russell 2000
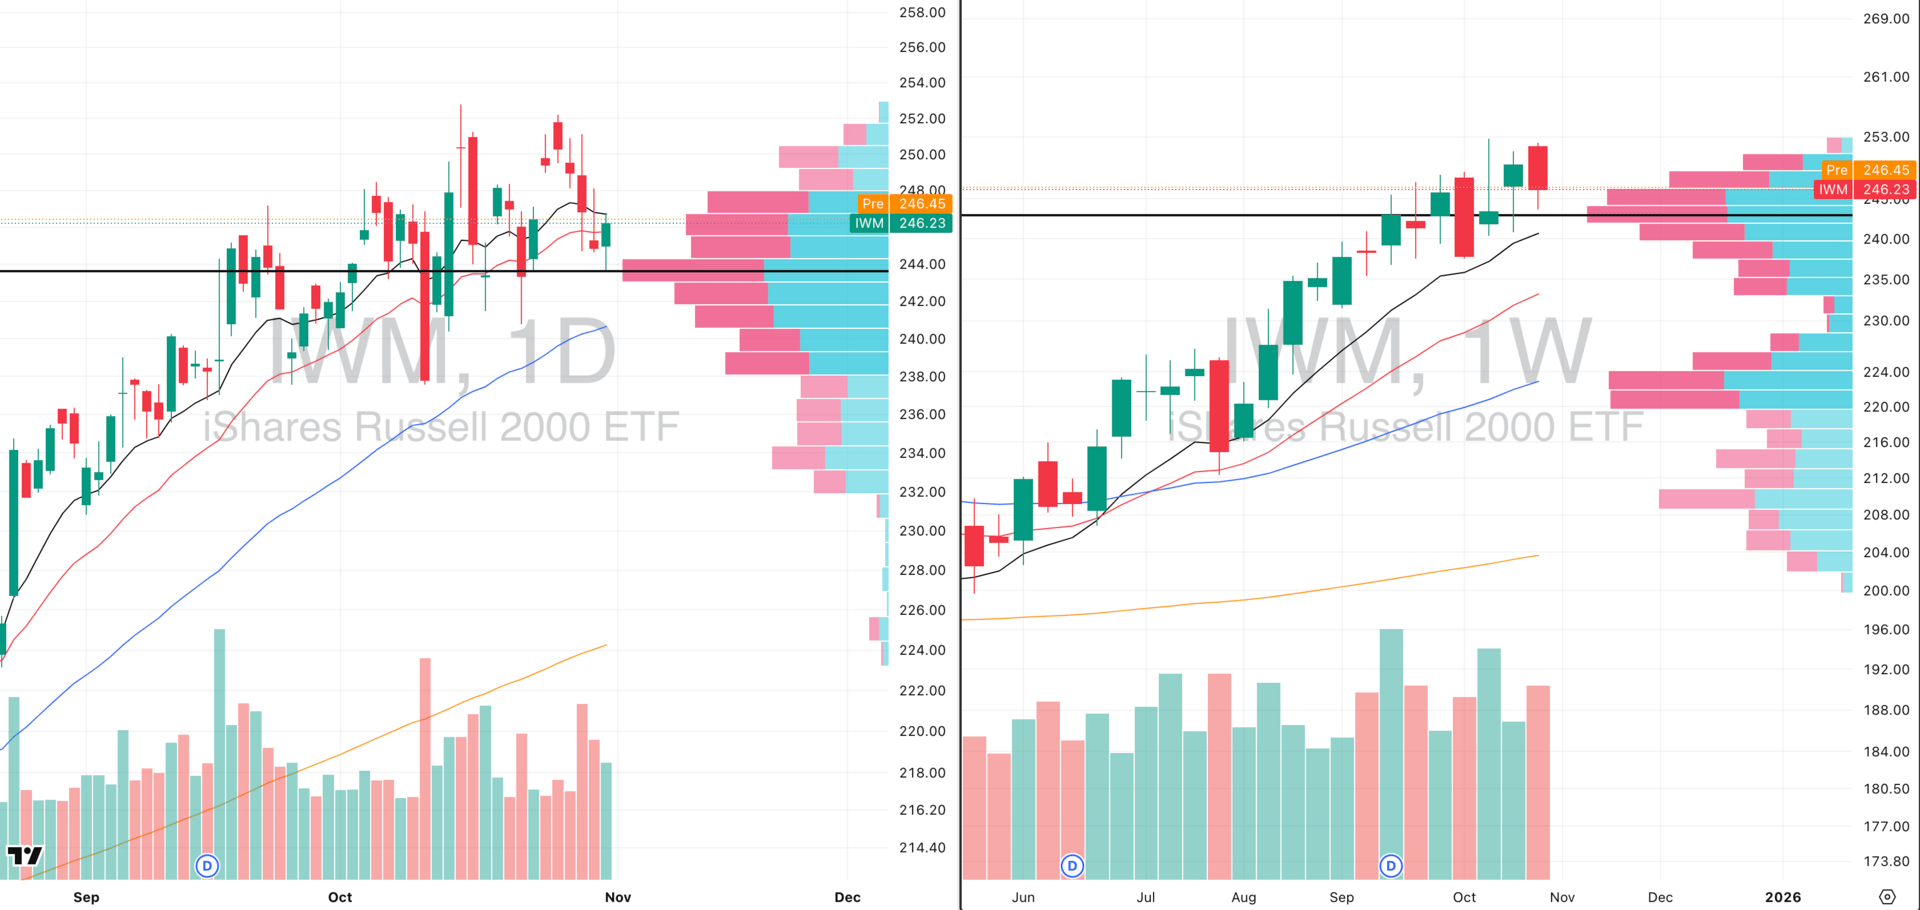
IWM VRVP Daily & Weekly Chart
% over 20 EMA: 38.50% | % over 50 EMA: 39.22% | % over 200 EMA: 53.66%
IWM remains messy and rotational on the daily, with money clearly being pulled toward megacap tech and earnings winners instead of small caps.
Despite the chop, the weekly structure is still a rising intermediate-term uptrend, and every test of the rising 10-week EMA since early October has been bought.
Price is holding right at the $244 POC, and Friday printed a green hammer off that demand pocket and we saw clear buyers defending this level again.
We've now tested the $244–$240 demand zone multiple times, and each time it has led to sharp mean-reversion bounces. If this market is going to rotate back into second-tier risk pockets, this is where it typically starts.
However, this remains not a high-conviction long zone for trend followers. Structure is intact, but relative strength is weak, and capital velocity is simply elsewhere.
Reddit’s Top Stocks Beat the S&P by 40%

Buffett-era investing was all about company performance. The new era is about investor behavior.
Sure, you can still make good returns investing in solid businesses over 10-20 years.
But in the meantime, you might miss out on 224.29% gainers like Robinhood (the #6 most-mentioned stock on Reddit over the past 6 months).
Reddit's top 15 stocks gained 60% in six months. The S&P 500? 18.7%.
AltIndex's AI processes 100,000s of Reddit comments and factors them into its stock ratings.
We've teamed up with AltIndex to get our readers free access to their app for a limited time.
The market constantly signals which stocks might pop off next. Will you look in the right places this time?
Past performance does not guarantee future results. Investing involves risk including possible loss of principal.
FOCUSED STOCK
PL: A Leader Nobody Mentions
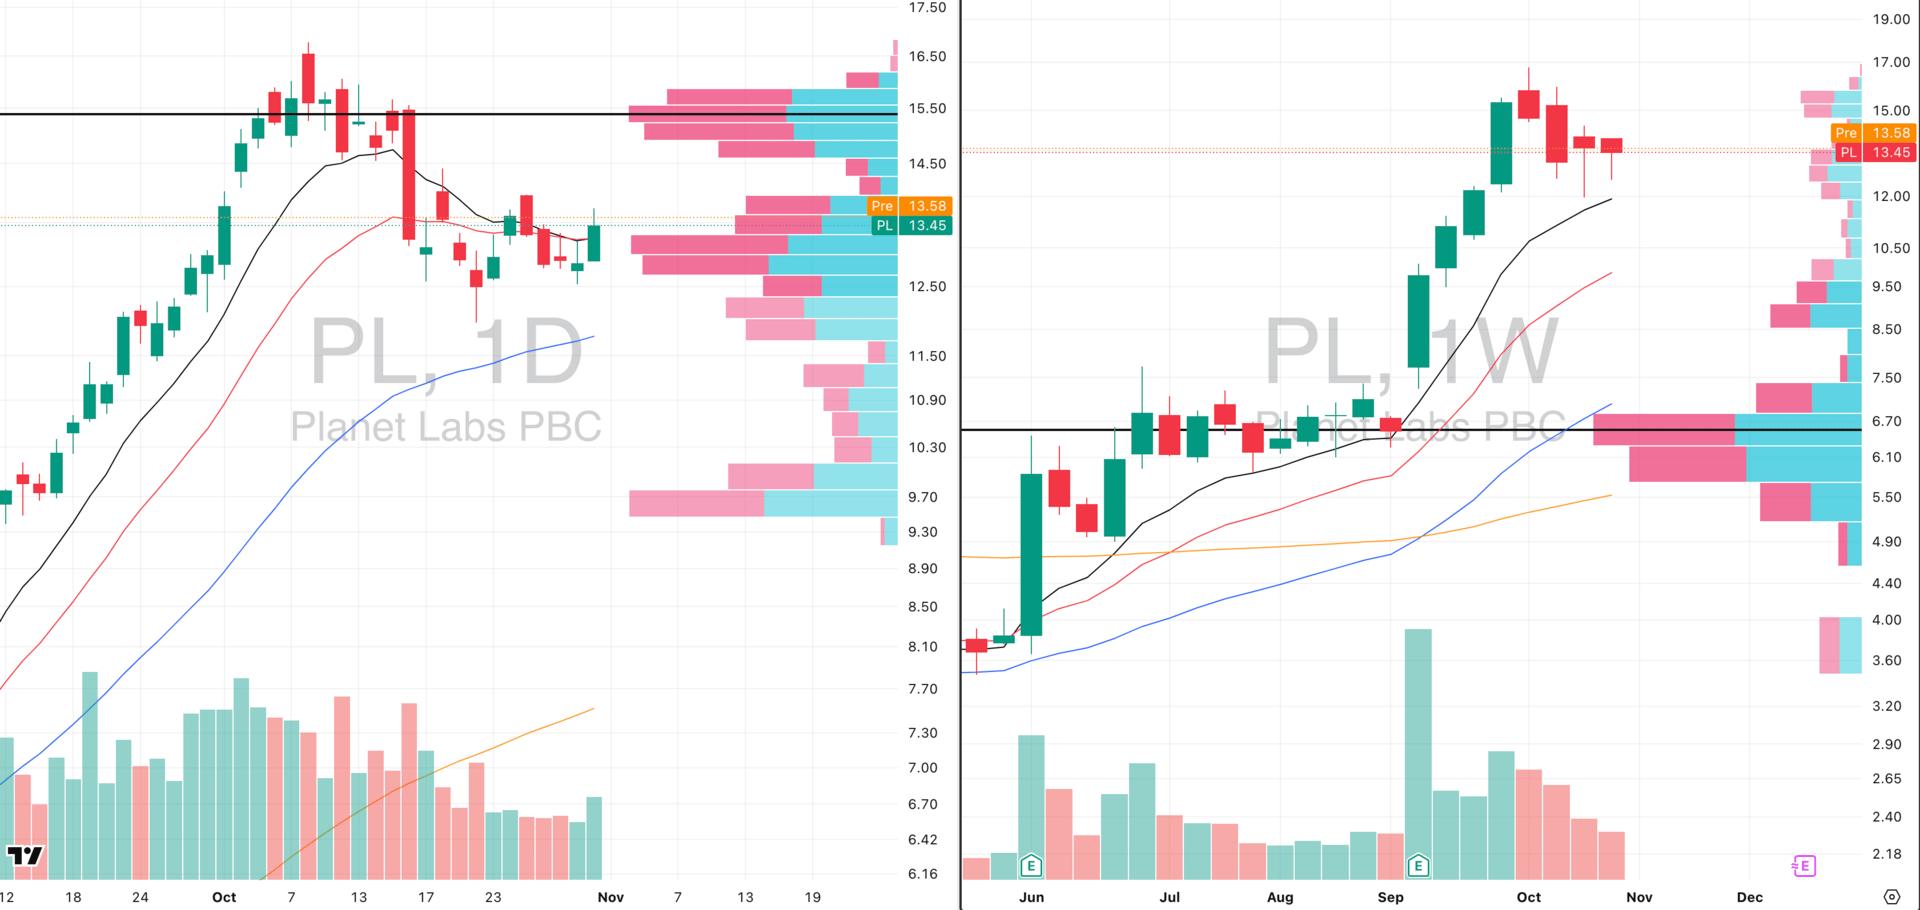
PL VRVP Daily & Weekly Chart
ADR%: 6.85% | Off 52-week high: -19.8% | Above 52-week low: +515.6%
Exceptionally clean leadership behavior across daily & weekly charts with a near perfect momentum structure.
The episodic pivot on Sept 8th (earnings beat +33.48% EPS / +11.17% revenue surprise) triggered a +112% move and this is what real institutional accumulation looks like.
Since then, price has spent two weeks pulling back on very low relative volume, resetting while respecting trend which is exactly what we want from a leader.
Weekly chart shows two red hammer candles at the rising 10-week EMA → consistent demand absorption at $12 with selling pressure drying up.
Daily chart now tightening under $14 pivot resistance, forming a high-tight consolidation with rising 10 EMA curling beneath price.
Volume trend is extremely constructive: declining during pullback, expanding on thrusts all of which confirms healthy accumulation and a reset in a new mark up/stage 2 rally.
FOCUSED GROUP
BOAT: Global Shipping Heating Up
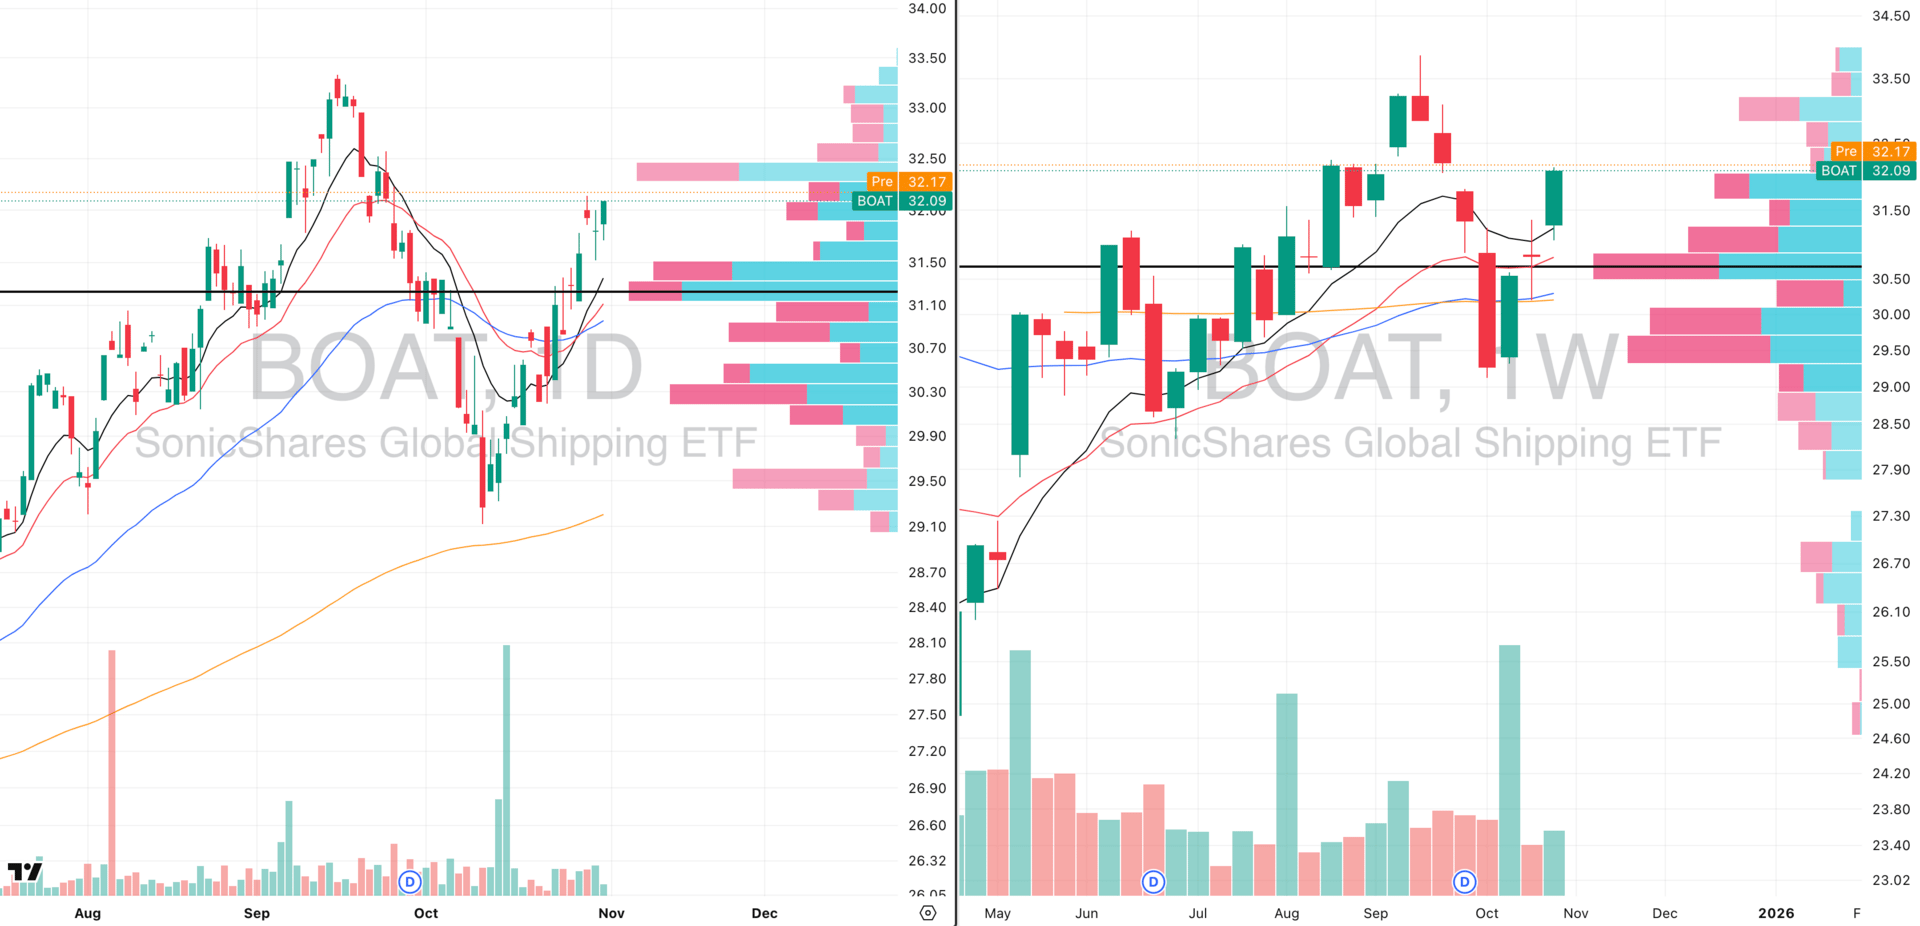
BOAT VRVP Daily & Weekly Chart
Global shipping continues to firm up technically, and BOAT is now showing clear evidence of a new uptrend emerging.
Price reclaimed the $30.70 weekly Point of Control and has pushed cleanly above that prior supply shelf and that’s the level we wanted to see converted.
Weekly chart shows a strong pivot breakout and immediate follow-through, with the rising 10-week EMA now supporting price all pointing towards structural leadership behavior.
Daily timeframe confirms trend alignment: strong rally through the POC, shallow digestion, and buyers stepping in quickly on dips.
This group has been a quiet outperformer as capital continues to rotate toward hard-asset, cash-flow sectors in parallel with metals/miners.
Near-term setup continues to favor trend continuation higher as long as price holds above the $30.50–$31 support band.

Did you find value in today's publication?This helps us better design our content for our readers |
Reply