- Swingly
- Posts
- 73% of Nasdaq Stocks Flipped Risk-On
73% of Nasdaq Stocks Flipped Risk-On
In partnership with

OVERVIEW
What You Need To Know
Macro
Markets quiet after a strong start; focus on Big Tech earnings, Fed meeting, and U.S.–China trade talks to set November tone.
Apple, Amazon, Meta, Alphabet all report this week — reactions here will decide if momentum extends or pauses.
Nasdaq (QQQ & QQQE)
QQQ posted its second breakout gap on +101% volume; >70% of Nasdaq stocks above 20/50 EMAs = strong breadth.
QQQE hit 404% relative volume, confirming broad participation — a key risk-on signal seen before major trend legs.
S&P 400 Midcap (MDY)
Inside doji on 126% volume = controlled consolidation near highs.
Similar setups in 2023–24 led to 2–4% upside follow-through.
Russell 2000 (IWM)
Small rejection on 86% volume, healthy pause, not weakness.
May retest $247 gap, structure remains strong above $244.
Focused Stock – TSLA
Multi-year base breakout from 2021 compression, retesting $457 zone.
Rare multi-timeframe asymmetry: short-term entry, long-term breakout potential.
Focused Group – XLC
Broke out from 5-day contraction at key EMAs.
But ~40% in META & GOOGL → high binary earnings risk; patience advised.

MARKET ANALYSIS
The Calm Before the Catalyst
U.S. markets are set for a quiet open this morning after a strong rally to start the week, with investors looking ahead to several major catalysts — Big Tech earnings, a Federal Reserve rate decision, and progress on a potential U.S.-China trade deal.
Optimism remains elevated after both Washington and Beijing confirmed progress on a trade framework expected to be finalized when Presidents Trump and Xi meet later this week. The deal reportedly addresses key flashpoints including rare earth exports, soybean imports, and TikTok’s U.S. operations.
The Fed kicks off its two-day policy meeting today, and traders are widely expecting another rate cut. Markets will be watching closely for signals from Chair Jerome Powell on whether another move could follow in December.
Earnings season continues in full swing, with Microsoft, Alphabet, Meta, Apple, and Amazon all reporting this week. Amazon is also in focus for planning its largest-ever corporate layoff, around 30,000 roles, as it doubles down on AI and cloud expansion.
Nasdaq
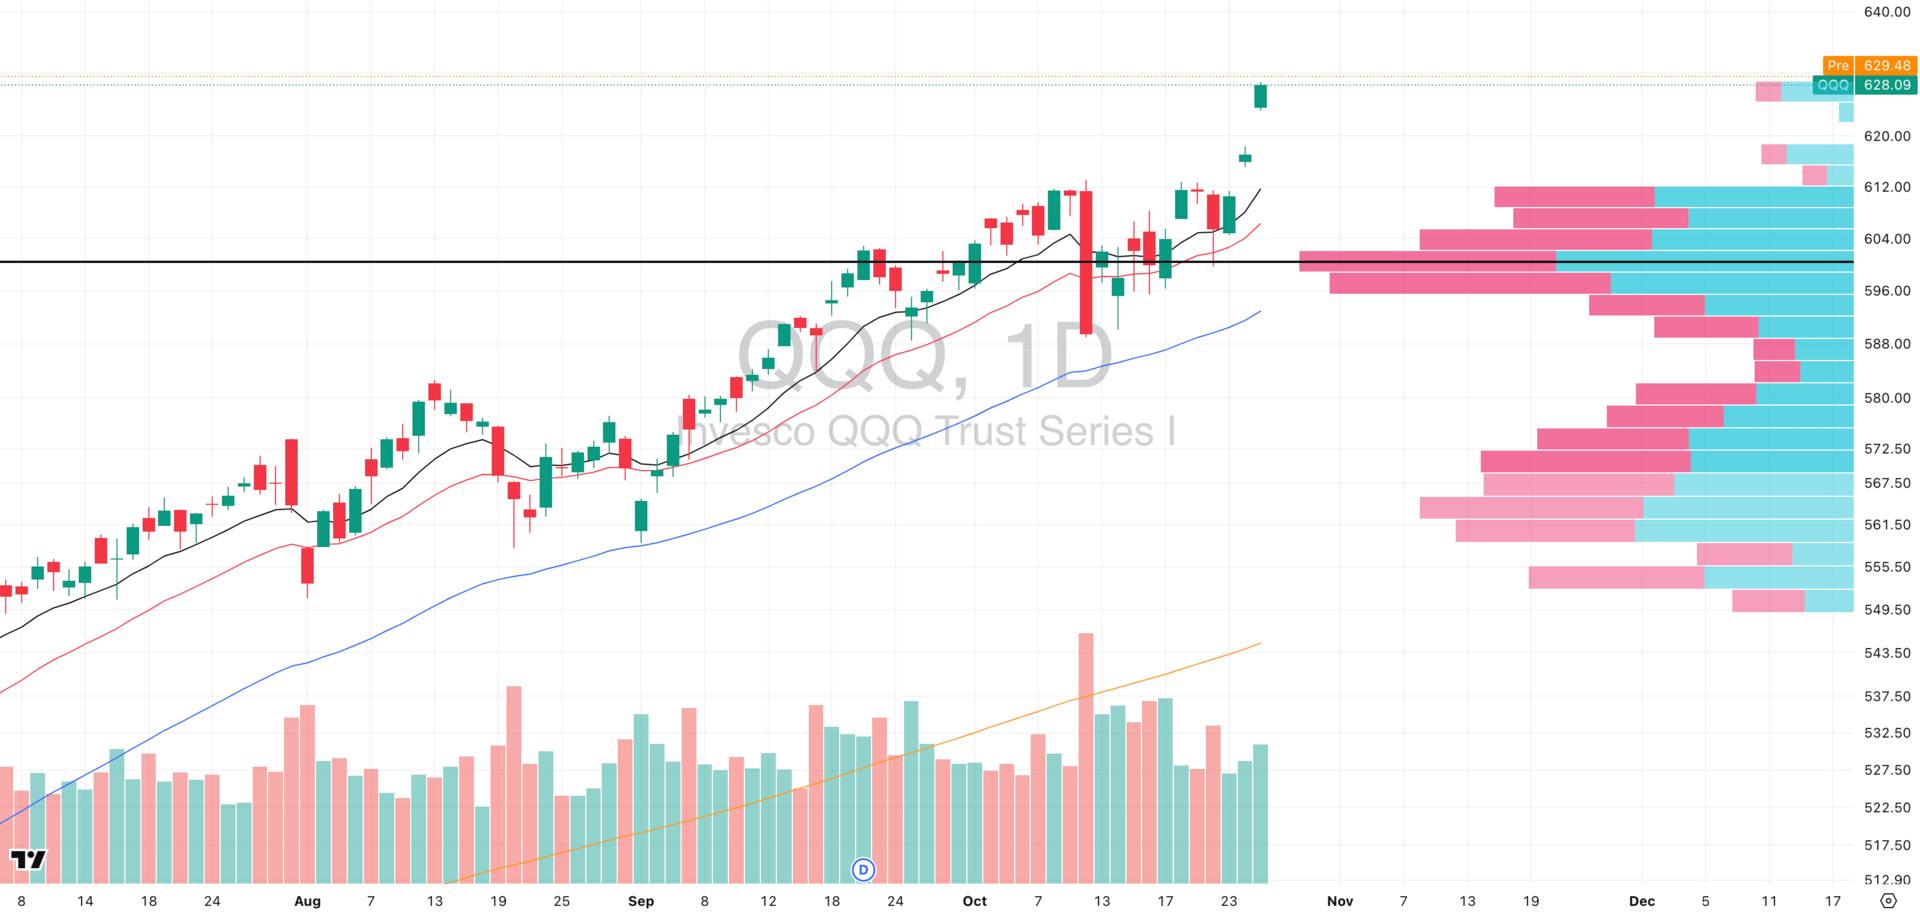
QQQ VRVP Daily Chart
% over 20 EMA: 73.26% | % over 50 EMA: 70.29% | % over 200 EMA: 62.37%
Massive breakout gap to fresh highs and this marks the second runaway gap in the current advance.
Monday’s session printed +101% relative volume, extending a three-day streak of rising relative volume which points to a large number of players positioning before the big tech earnings this week in anticipation/
Price is now cleanly above prior resistance, confirming that the Nasdaq remains the market’s leadership engine.
Momentum breadth (internally) is expanding; we now have over 70% of all Nasdaq names trading over their 20 and 50 EMAs which is >15% difference than the SPX, MDY or IWM.
Equal-Weight Nasdaq (QQQE)
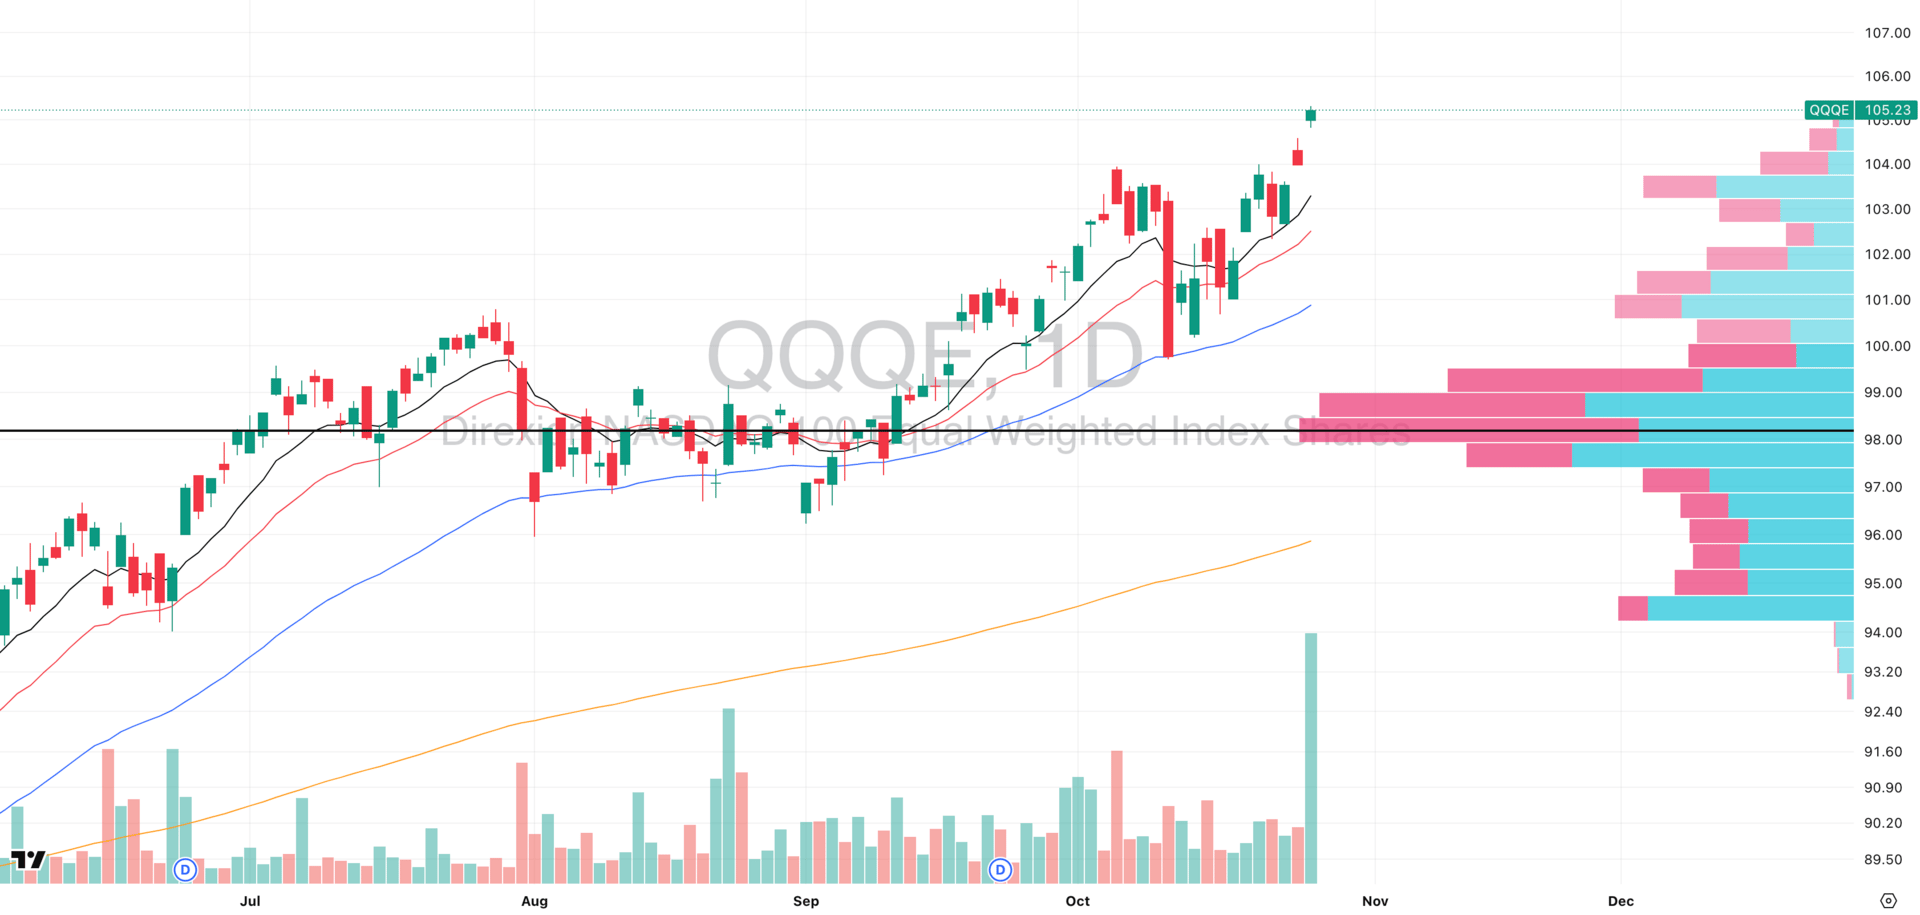
QQQE VRVP Daily Chart
Highest relative volume day since May 2025 clocking 404% of its 20-day average on Monday’s move.
The equal-weight index confirms broad participation WITHIN the large technology complex, not to be confused with the rest of the market (the Nasdaq is pure large and megacap technology stocks.
As of 2025 YTD, QQQ had returned approximately +20.07%, compared to QQQE’s ~+15.42%, indicating strong performance dominance by large-cap tech but also highlighting the breadth premium when the gap narrows.
QQQE’s concentration is considerably lower: the top 10 holdings represent only ~12% of assets in QQQE vs ~45.8% in comparable large-cap growth ETFs, demonstrating that when QQQE participates alongside QQQ, breadth is materially more meaningful and follow through has a much higher probability.
Note: Earnings This Week
Big Tech earnings dominate this week with Apple, Amazon, Alphabet & Meta set to report.
The top ten stocks in the S&P 500 now account for roughly 30 % of the index’s total weight, and in the first half of 2024, just three of the “Magnificent Seven” were responsible for nearly half of the S&P’s total gain.
During recent earnings seasons, companies that beat both earnings and revenue expectations have gained an average of 3–4 % the following day, while those that missed saw average declines of around 5 %.
Given this concentration and volatility sensitivity, reactions from these tech giants will likely determine whether the current rally extends into November or stalls for consolidation.
S&P 400 Midcap
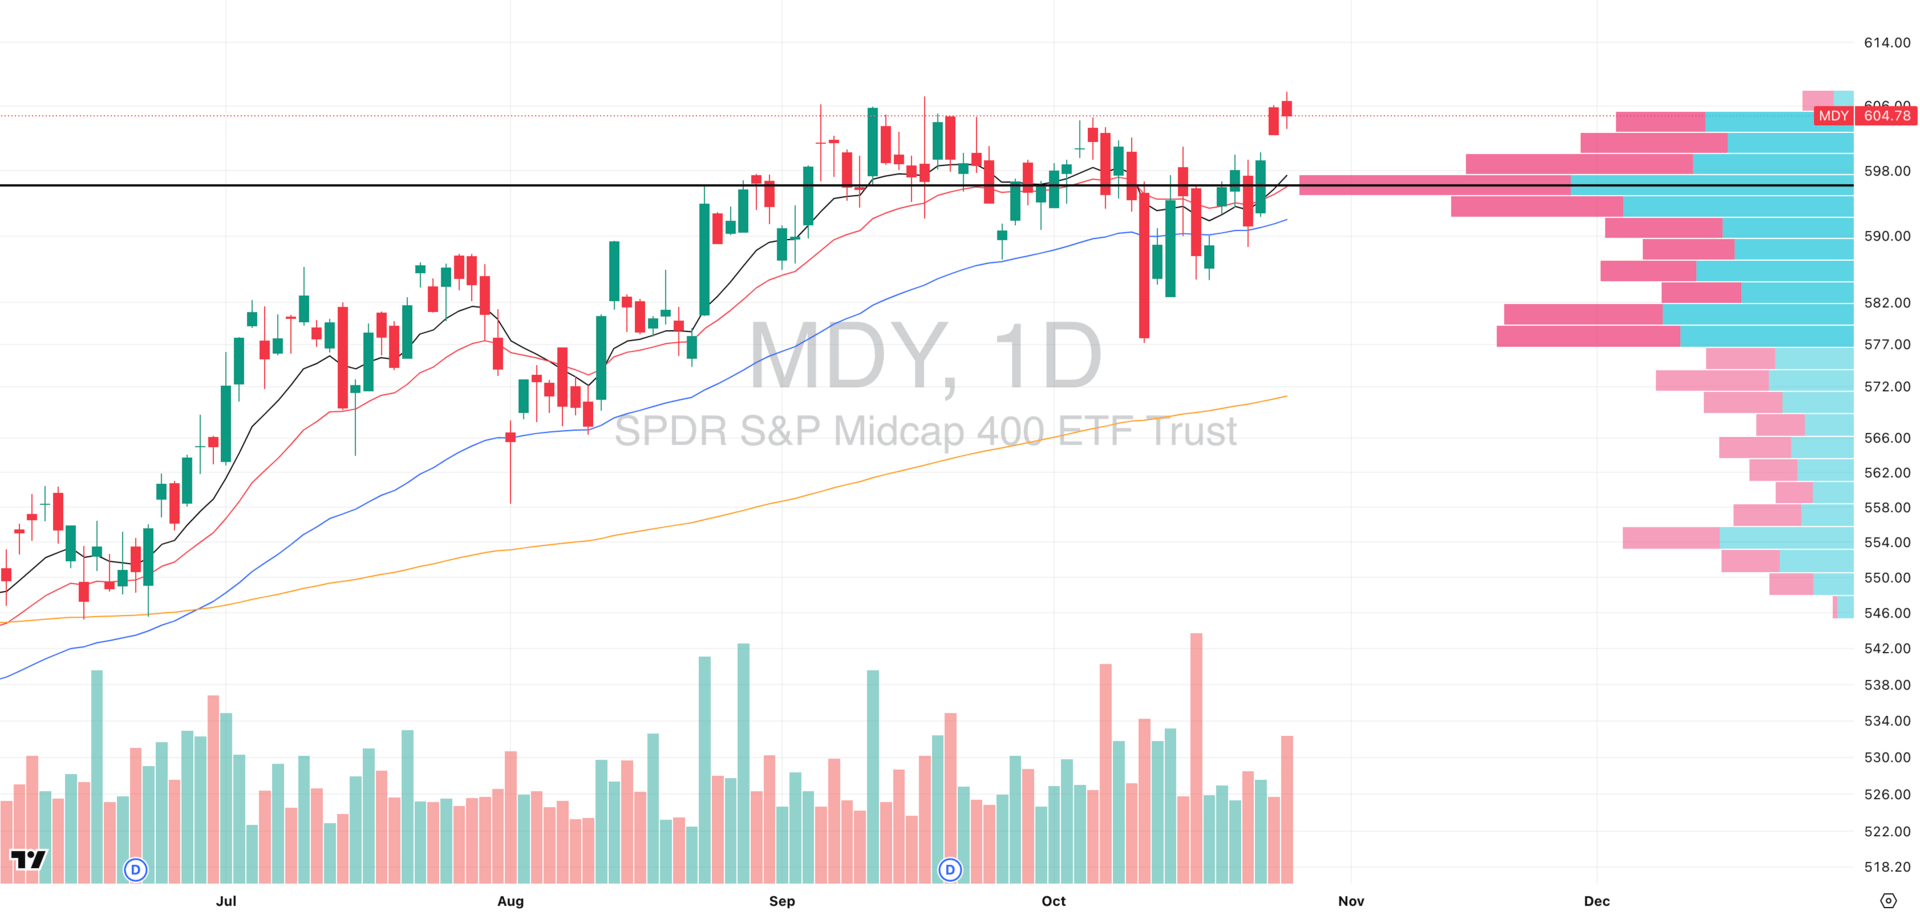
MDY VRVP Daily Chart
% over 20 EMA: 56.60% | % over 50 EMA: 47.63% | % over 200 EMA: 60.09%
MDY printed an inside doji candle on elevated relative volume (126 % of its 20-day average) which is typically a sign of controlled consolidation above a prior supply level and is a positive development.
Despite the red candle, price held tightly near year-to-date highs, signaling that buyers are absorbing supply and we dont have aggressive selling pressure stepping in.
This behavior contrasts with the Nasdaq’s runaway move and this is a healthy divergence, suggesting mid-caps are entering a rest-and-build phase after pushing over their POC from a 2 month long base.
Similar high-volume pauses in MDY (e.g., March 2024 and June 2023) have preceded 2–4 % follow-through rallies within 10 trading days, as consolidation at highs typically resolves upward once liquidity broadens.
The lag vs. QQQ isn’t a negative for the MDY, it simply reflects liquidity clustering in mega-caps ahead of earnings, with institutional rotation quietly building beneath the surface.
Russell 2000
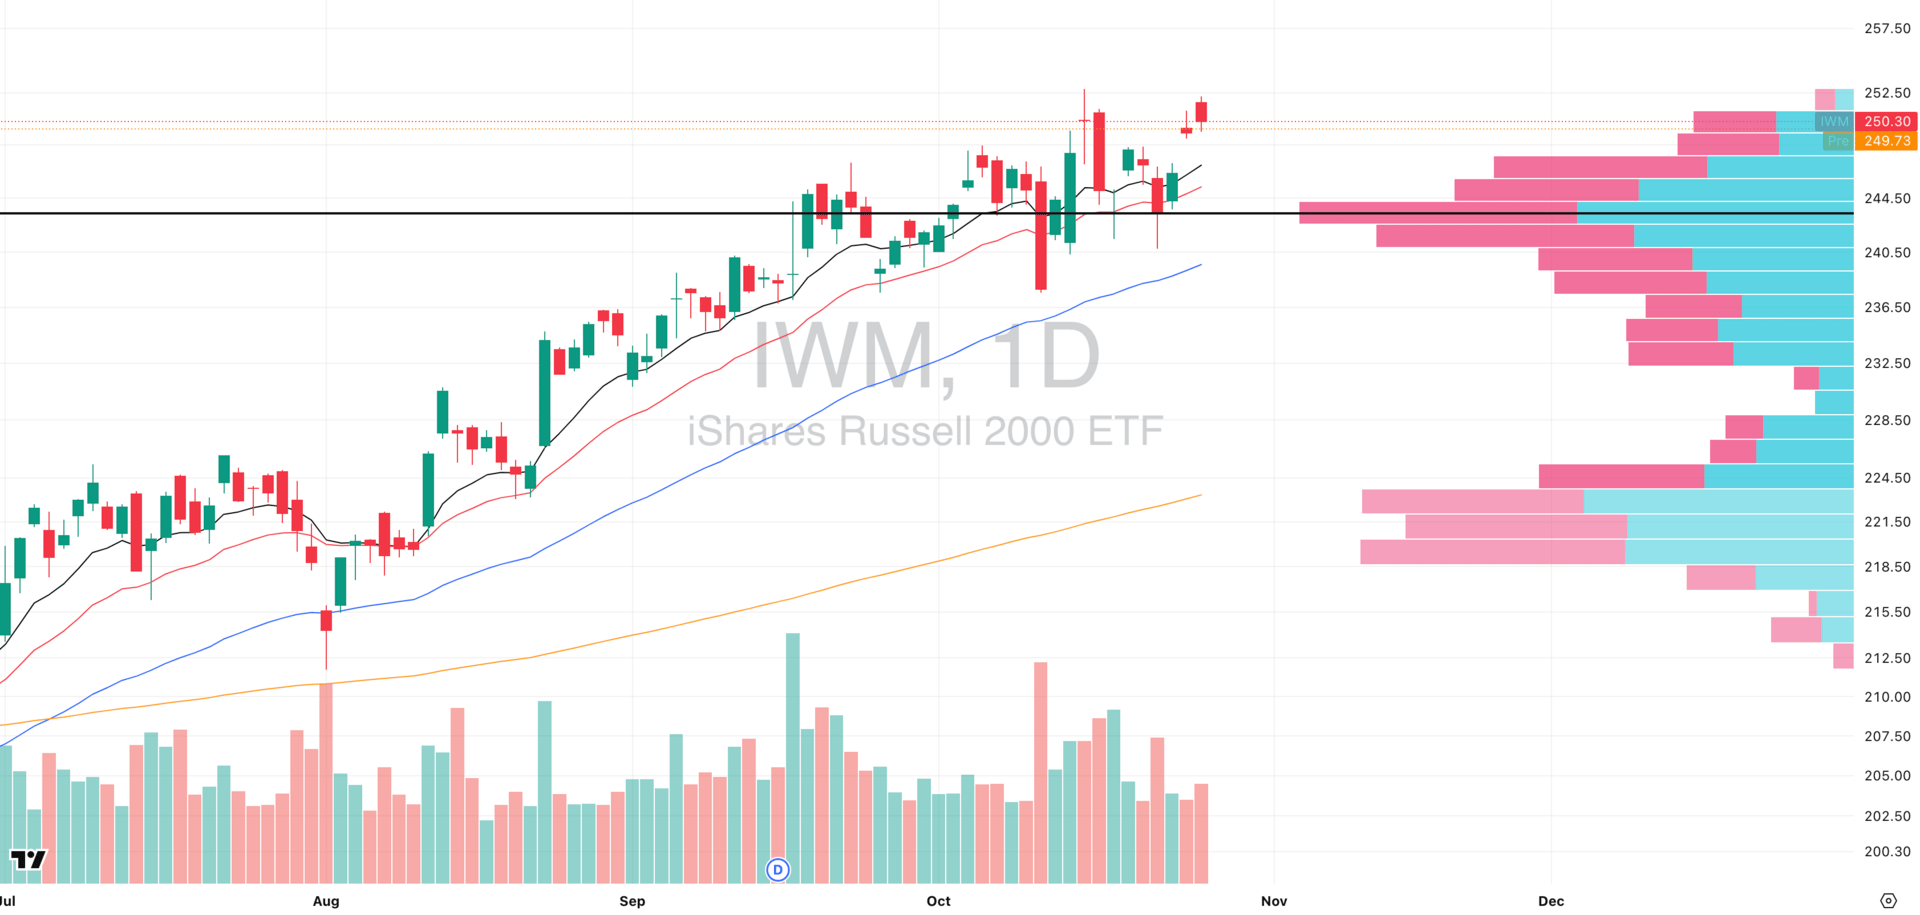
IWM VRVP Daily Chart
% over 20 EMA: 59.30% | % over 50 EMA: 51.48% | % over 200 EMA: 59.56%
IWM mirrored MDY’s action, posting a minor rejection candle on 86 % relative volume (vs. 20-day average) after Friday’s breakout attempt.
While not a cause for concern, this suggests short-term exhaustion near local highs as traders rotate capital toward large-cap tech.
A partial gap-fill down toward the $247 level remains likely if Nasdaq momentum extends, especially as small-cap liquidity temporarily thins out ahead of earnings.
Structurally, the index continues to hold above its key $244 volume shelf, maintaining the integrity of its uptrend.
The recent consolidation at highs still fits within a constructive broadening pattern, with no technical damage unless price loses the 20-day EMA cluster.
Stop Drowning in Market News. Focus On Making Money.

Every day: 847 financial headlines, 2,300 Reddit stock mentions, 156 Twitter trading threads, 12 IPO updates, 94 crypto developments.
Your problem isn't lack of information; you have too much.
While you're scanning headlines wondering what matters, profitable trades slip by. The signal gets buried in noise.
What if someone did the heavy lifting for you?
Stocks & Income reads everything:
Twitter traders
Reddit buzz
IPO announcements
Crypto insider takes
Crowdfunding opportunities
Market news
Then we send you only what can actually move your portfolio.
No fluff. No useless news. Just actionable stock insights in 5 minutes.
We track every source so you don't have to. You get the 3-5 opportunities worth your time, delivered daily.
Stop wasting time on useless “investing news” and start thinking critically about real opportunities in the stock market.
Stocks & Income is for informational purposes only and is not intended to be used as investment advice. Do your own research.
FOCUSED STOCK
TSLA: Our Most Bullish Pick
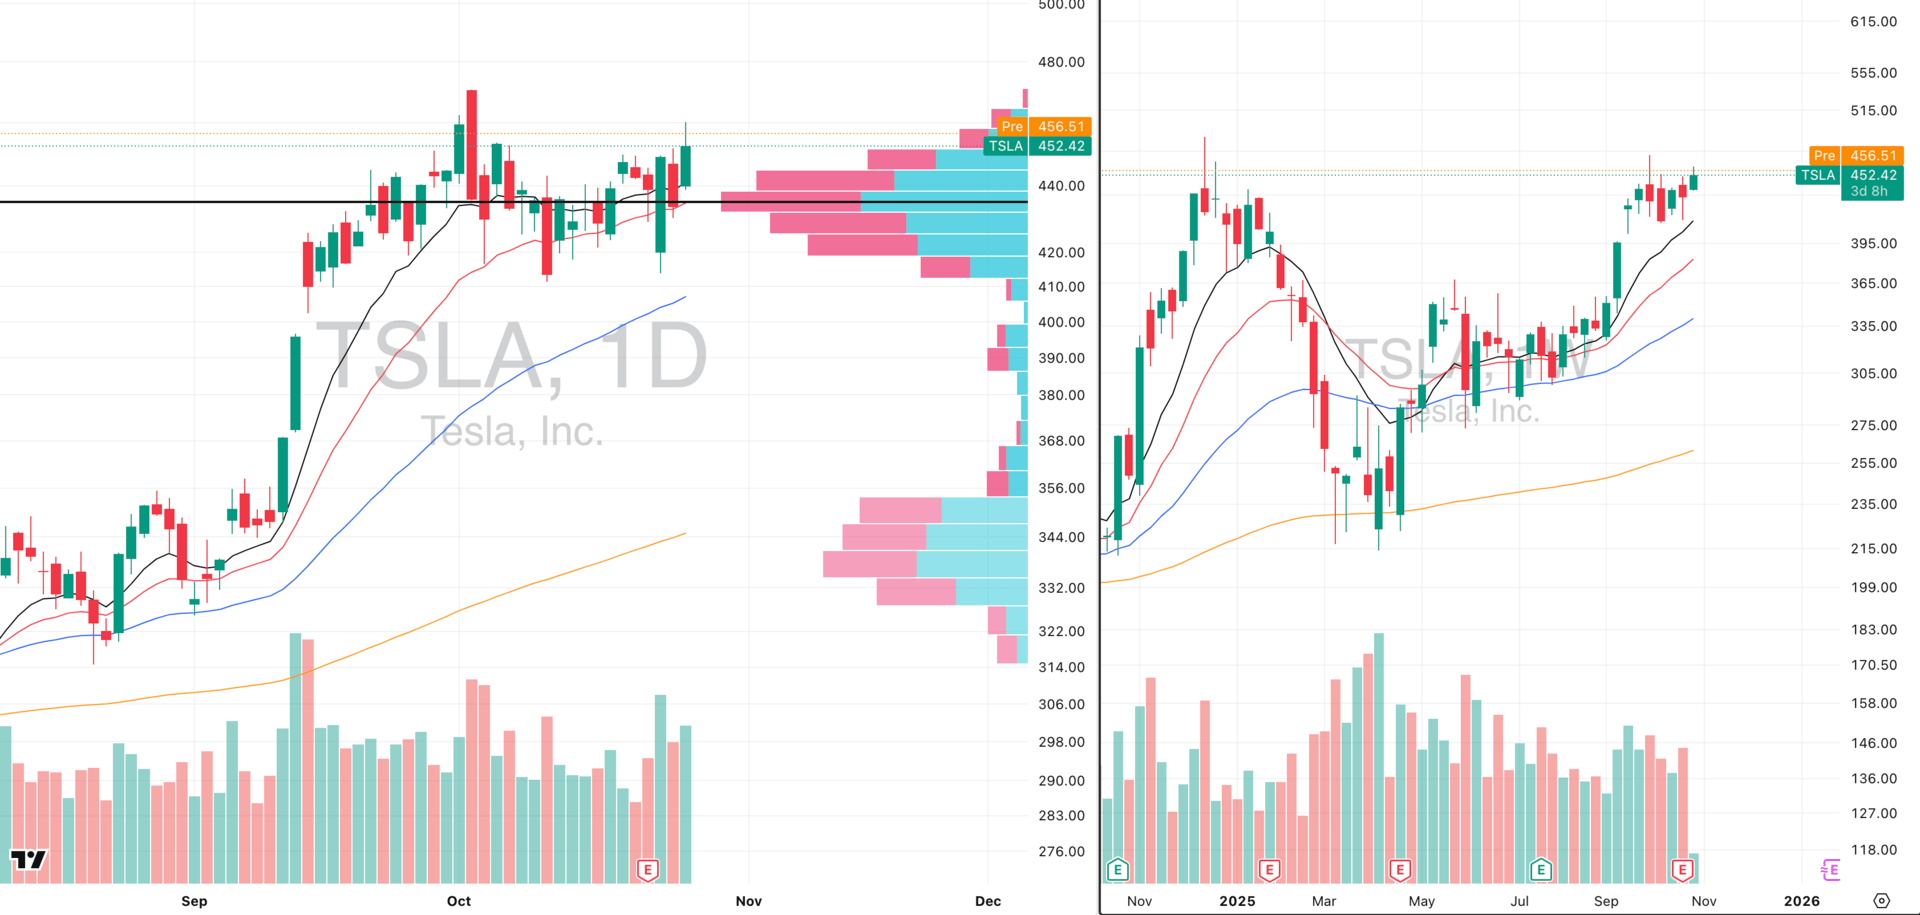
TSLA VRVP Daily & Weekly Chart
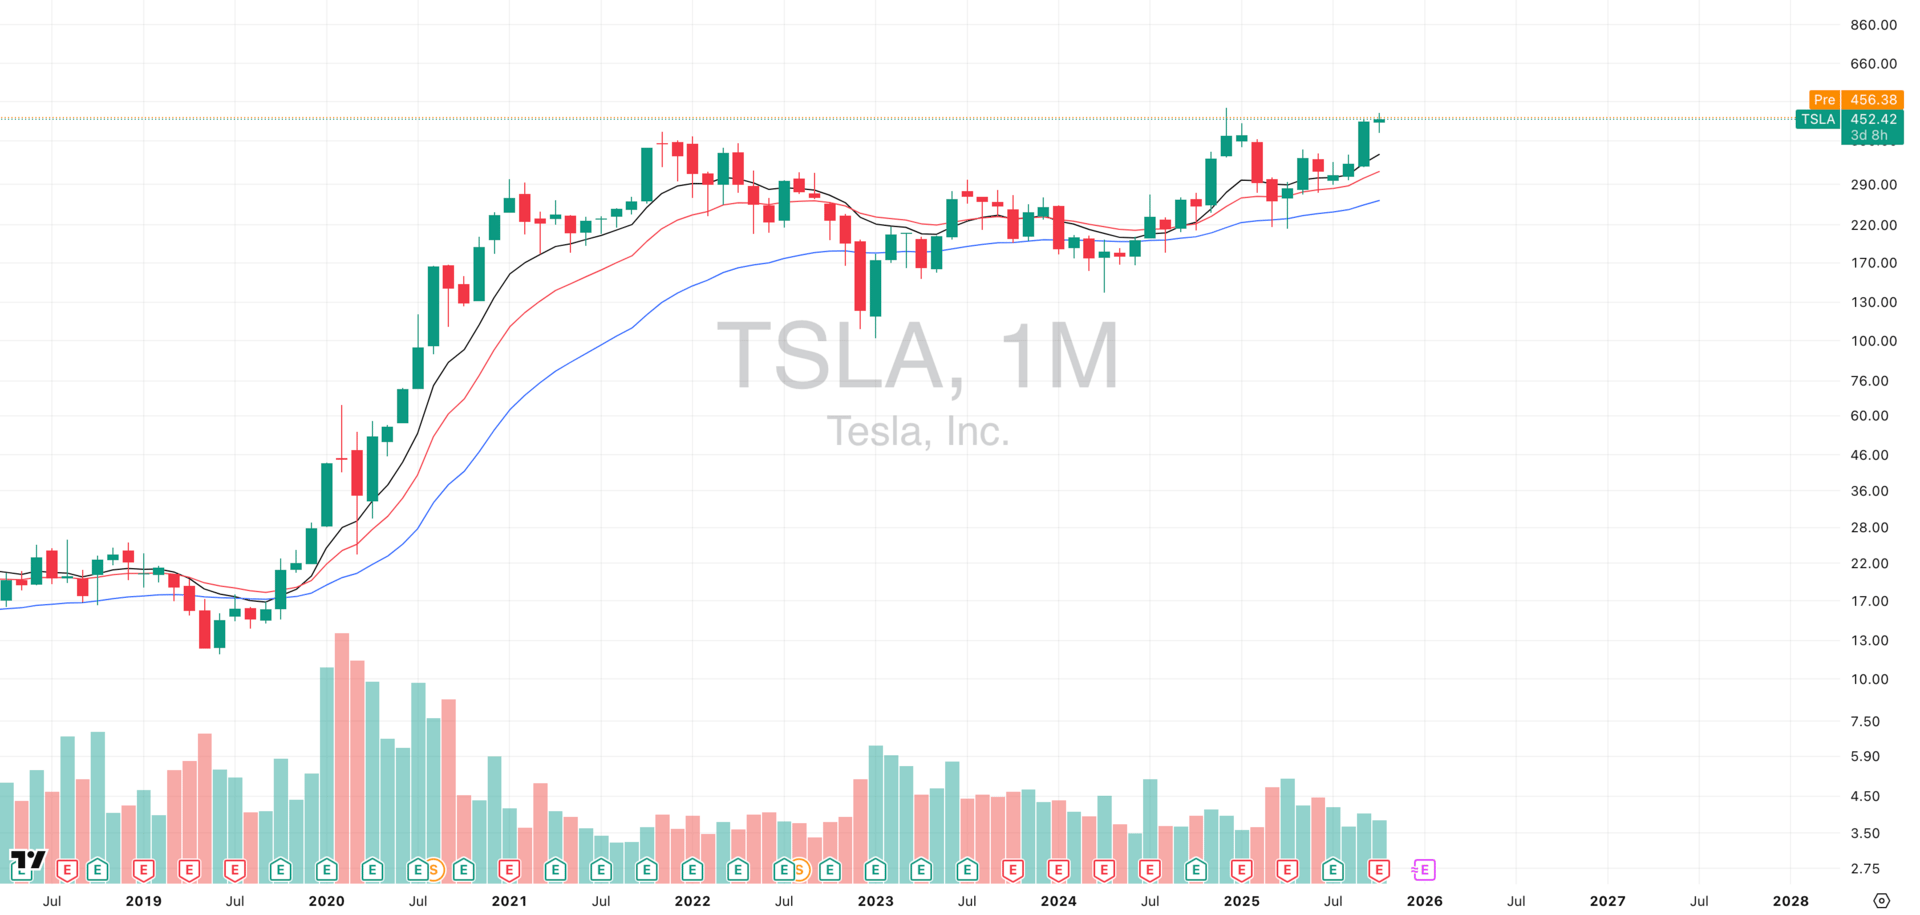
TSLA Monthly Chart
ADR%: 4.56% | Off 52-week high: -7.4% | Above 52-week low: +111.2%
TSLA continues to build one of the most technically significant bases in the market, stretching back to mid-2021.
The monthly chart shows a broad primary trend base that has spent over four years compressing under resistance and is now showing signs of a major structural breakout.
The smaller one-year base, which resolved higher last month, reinforces that the stock has transitioned from long-term accumulation to early-stage expansion. This is multi-timeframe alignment and is one of the rarest and most powerful conditions in momentum trading.
On the daily and weekly charts, TSLA has now retested the breakout zone around $457, forming a tight doji-style consolidation just beneath the highs. The earnings-related selloff last week was swiftly bought up, confirming that institutional demand is stepping in on weakness.
This is an exceptional asymmetric setup and really can’t overstate enough that traders can participate in a short-term breakout (daily timeframe) that also carries long-term trend potential (monthly timeframe).
FOCUSED GROUP
XLC: A Very Risky Breakout
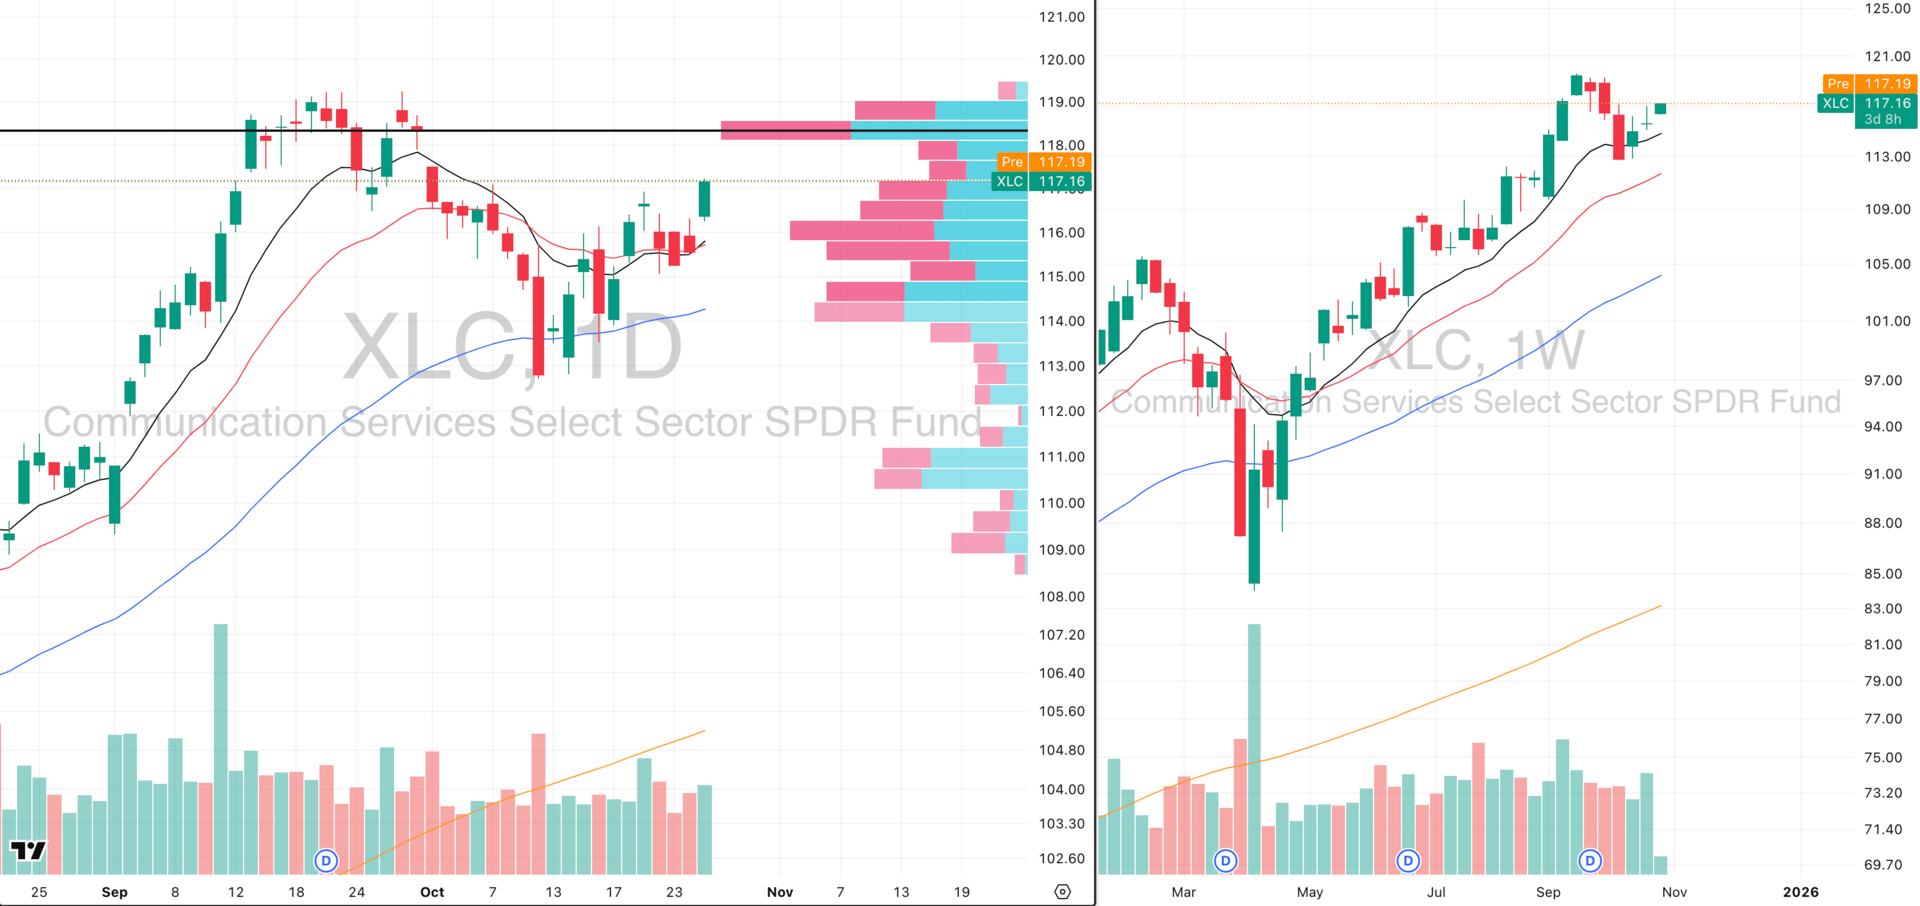
XLC VRVP Daily & Weekly Chart
XLC broke out yesterday from a tight 5-day contraction right at the confluence of its 10- and 20-day EMAs and the rising 10-week EMA after a perfect dip buy long to the rising 10 week EMA (daily 50- EMA)
However, this is not a low-risk entry zone. Nearly 40 % of the ETF’s weighting is concentrated in META (19 %) and GOOGL (18 %), both of which report earnings within the next two sessions.
That creates binary risk as if either name disappoints, XLC’s structure will unwind sharply, erasing all recent gains and leaving you with a likely gap below your stop loss.
While the technical setup is constructive, the asymmetry here skews to the downside in the very short term, as traders are effectively taking a leveraged earnings bet on two mega-cap names rather than the sector as a whole.
The best approach here is patience. Wait for earnings clarity before engaging. If META and GOOGL confirm strength, this could trigger a powerful post-earnings expansion, validating XLC’s breakout and confirming broadening risk-on participation beyond tech.
It’s always better to be out and want in, than in and want out…

Did you find value in today's publication?This helps us better design our content for our readers |
Reply